USDT.DOMINANCE Chart Update !
USDT dominance is showing a downward trend after breaking out of a previous channel, which may indicate a decrease in stablecoin dominance in the market. The price of testing a green support zone is around 4.4%. If it fails to hold above this level, a further downside to the lower red support zone around 3.9% may be possible.
This decline in USDT dominance could imply a potential increase in buying pressure within the crypto market, as funds flow out of stablecoins and into more volatile assets, fueling upward momentum in the broader crypto market. However, a bounce back above the support zone may signal a temporary reversal in trend.
Traders should watch for reactions at these key support levels to better assess the direction of market sentiment.
Disclaimer: This analysis is for informational purposes and is not financial advice. Always stay updated with market movements and adjust your trading strategies as needed.
You can DM us for information on any other coin.
@Peter_CSAdmin
Btcdominance

BTC DOMINANCE UPDATEBTC DOMINANCE ANALYSIS :
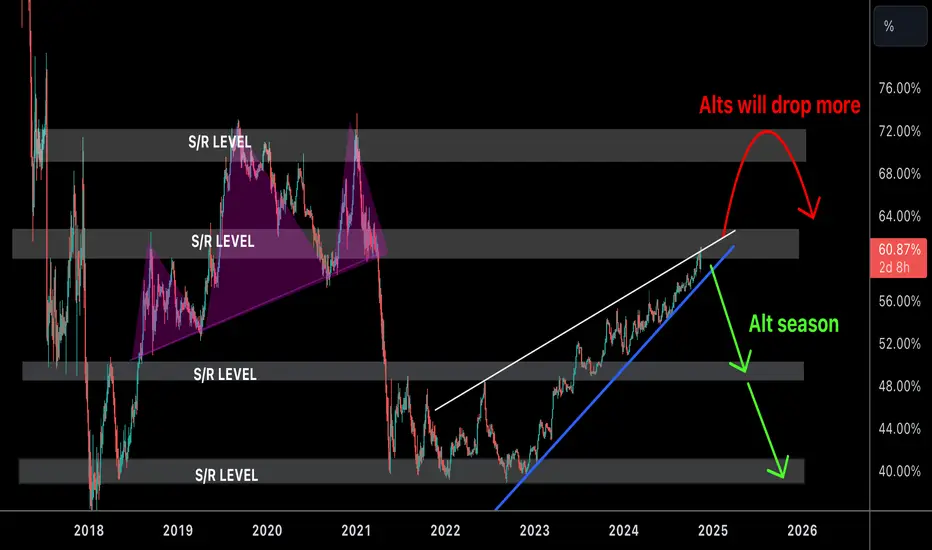
In the past 7 months, Bitcoin has been ranging between 50k and 70k, then Bitcoin made a new all-time high, during this period, altcoins have struggled to rise …yes, some have seen significant growth but the majority are still at very deep lows. The main reason for this is rise the dominance of Bitcoin alongside Bitcoin!
We are looking at the current level, I hope there will be a rejection …If it rejected here, we could see a great altcoin season, but if it continues to rise, we could reach 70% (2020 high) before the alt-season.
Keep following this chart!
Best wishes
Bitcoin's Final Push: Altcoin Rotation LoomsBitcoin dominance seems to be nearing its peak, but as with every end, we often see one last strong push.
It’s clear that only specific coins are currently outperforming Bitcoin, so I suggest continuing to focus on those until January/February. I believe Q1 will bring a massive rotation of capital into altcoins.
Just remember: most Bitcoin dominance tops tend to come after strong surges. So, I expect Bitcoin to continue climbing before we start calling the top.
If, by some chance, dominance hits 72%, I’ll be shifting the majority of my BTC stack into altcoins.

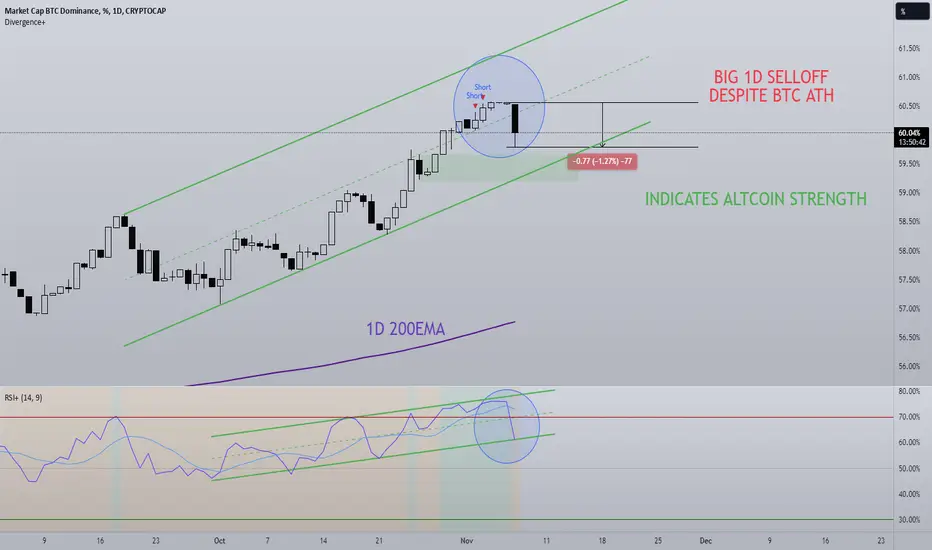
BTC DOMINANCE After a Trump victory the markets are booming, a new BTC ATH pushed bitcoin dominance to new local highs of 60.6%. Now we've seen a decent retracement on the daily candle and BTC is still in price discovery. This indicates to me that we have an altcoin resurgence on our hands, returning confidence in crypto and the green light for crypto support by America is a very important to this current rally.
I could see BTC dominance dropping to 59.5% before any continuation (bottom of the trend channel) higher and that's not particularly from a BTC selloff although that is possible as a SFP, but more likely is just BTC staying where it is and altcoins making up some ground.
RSI has dropped out of the oversold zone with this daily candle, a cool off is eventually inevitable as long as price stays flat while RSI cools it's very bullish.
A lot of that altcoin move needs to be from ETH imo, with BTC @ ATH Ethereum is 72% away from ATH... A massive difference and one that should close up going into Q1 2025.
The standard process for a crypto bullmarket is:
BTC --> ETH --> LARGE CAPS
--> MID CAPS --> SMALL CAPS
So far we're clearly still in the BTC phase, keeping a close eye on the ETHBTC chart to see if the momentum shifts towards Ethereum but that doesn't seem likely until next year at the earliest.
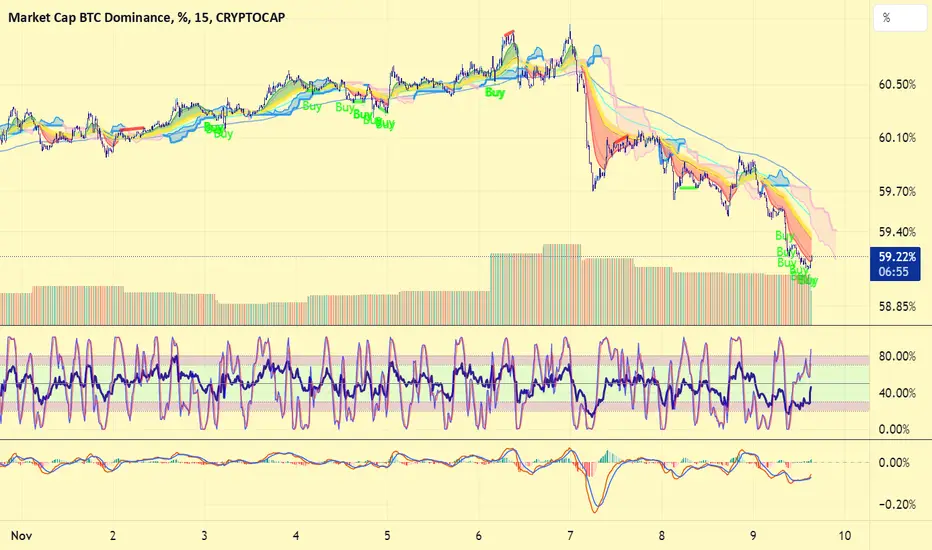
BTC dominance regaining strenghIn lower time frame, it looks #bitcoin #btc dominance is about to make a bounce after the recent short term dump.
Bitcoin's Necessary Correction: Why $69k is the Next Move!Hello Traders!
do you know why bitcoin is not falling ? let me tell you , BTC's Dominancy is just increasing and the 24H increasing from the day of election even not dropped 1% from 5th Nov till now , bitcoin will fall soon within days to the target in chart which is 68000-69898.
without giving these targets bitcoin can not go up to 92K.
follow me for more technical analysis and signals

BTC Dominance Transitioning from a range-bound market to a trending one:
EMAs and other indicators can stay highly overextended for longer than usual without signaling an immediate price retracement.
We expect any upcoming pullbacks to be relatively shallow.

BTC DominanceWe're approaching a crucial level in the market. While I can't say for sure this will be the peak, we're definitely getting close. Sentiment is low, frustration is high—clear signs we're hitting a psychological resistance point.
BITCOIN DOMINANCE about to hit double bottom target.Let's see how it reacts once there
Does it pus on through
tap it
does it consolidate
or start its reversal

BTC Dominance: 60% - "I'm the captain Now"Hello friends,
A quick follow-up to my previous BTC dominance analysis!
Remember when we talked about BTC at 54% and said 58% could be next?
Well, look where we are now - 60% dominance! Everything played out exactly as discussed.
What this means:
- We're deep in the "Alts Bleeding" phase
- The 50% danger zone is far behind us
- That 54% resistance? Completely crushed
- Next major target could be 65%
Real talk:
- This is NOT the time for alt trading
- Strong alts are barely keeping up with BTC
- Weak alts are getting destroyed
- BTC is the safest play right now
Keep it simple:
If you're still in alts, you might want to reconsider that position. BTC is showing who's boss ""Look at me, I'm the captain now"" , and fighting that trend is dangerous.
Previous analysis was spot on, and the trend is still strong. Sometimes the best trade is staying away from what's bleeding.
----------------
NFADYOR
----------------
GL & trade safe!

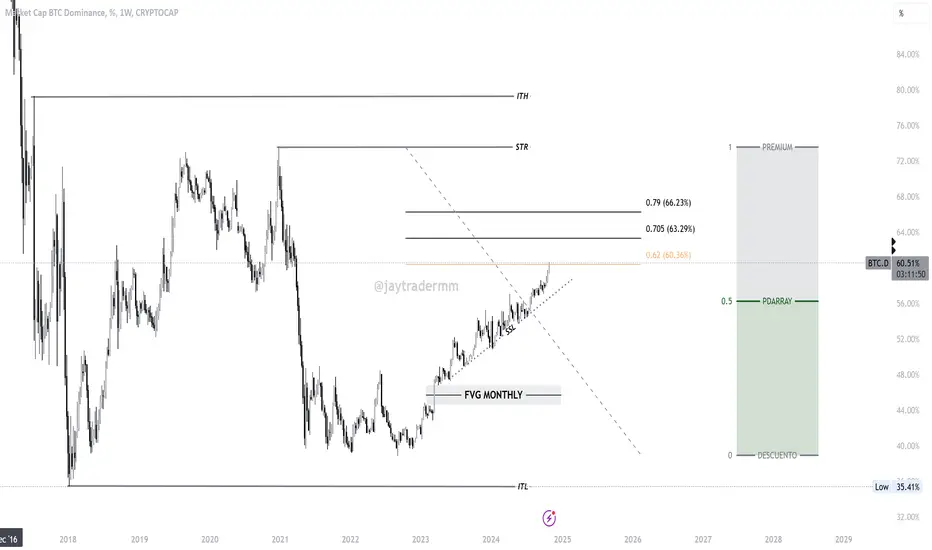
#BTC DOMINANCE, LAST OPPORTUNITY TO BUY CHEAP ALTS!Bitcoin Dominance is currently around 60.51%, keeping BTC in the 68k–70k range while altcoins drop 20-40% from recent highs.
This pattern is common in bull runs, as rising BTC dominance typically pulls altcoins down. In my experience, a rejection zone between 64% and 65.81% could trigger an altcoin rally while BTC hits new all-time highs and moves sideways.
Here are three key points to watch:-
1. BTC Dominance reaching rejection levels.
2. BTC closing above the monthly resistance of $71,378.
3. Altcoins holding higher time frame supports and showing reversal signs.
If these align, it could be a strong opportunity for altcoins.
Patience here pays off – holding USDT or stablecoins now could let you buy altcoins at lower levels soon.
I'll be sharing important updates as needed. Currently, I’m on complete bed rest due to a fractured wrist and some deep wounds, but my DMs are open if you need to reach out. I'll do my best to answer questions whenever I'm able.
Thank you for your understanding!
For now, stay focused, and let’s spot these opportunities.
If you enjoy these insights, hit like and share your thoughts. Let me know if you’d like any specific chart requests.
Thank you!

BTC.D Keep calm, don't lose your headThe market will do what it always does—play with our emotions. We're all eagerly anticipating an altseason, right? But the market will test everyone’s patience, so it's wiser to stick with spot purchases and use DCA (Dollar Cost Averaging) for entry. Don’t give up, and above all, don’t sell now—you’ve weathered a tough bear market.
Dominance is set to decline, just as it has in previous cycles within these Fibonacci parameters. Stay calm, keep your emotions in check, and remember: patience and strategy are key.
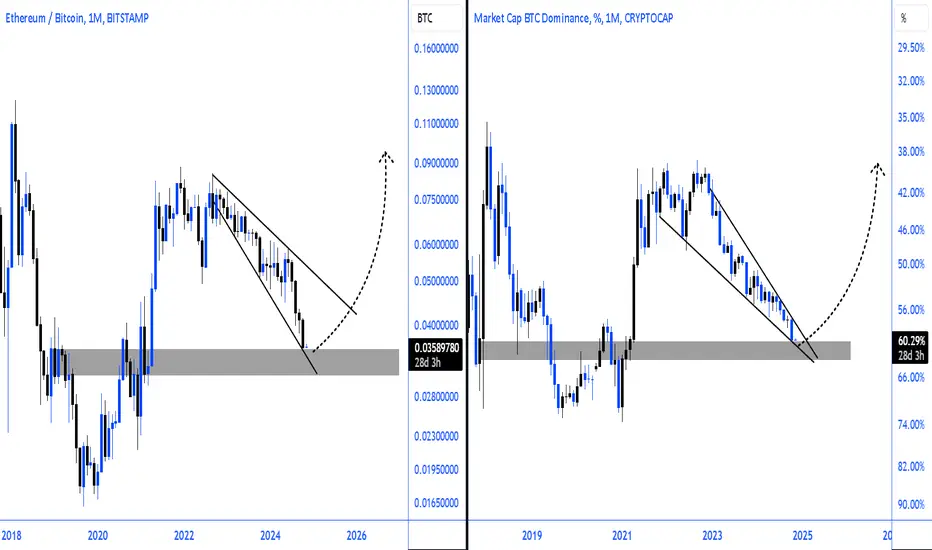
$ETHBTC x $BTC.DCRYPTOCAP:BTC.D ➡️📉 BINANCE:ETHBTC ➡️📈
#Altcoins will follow!
#ethereum has always been a key indicator for #Alts and that hasn't changed. The cycle repeats as before the bull run!
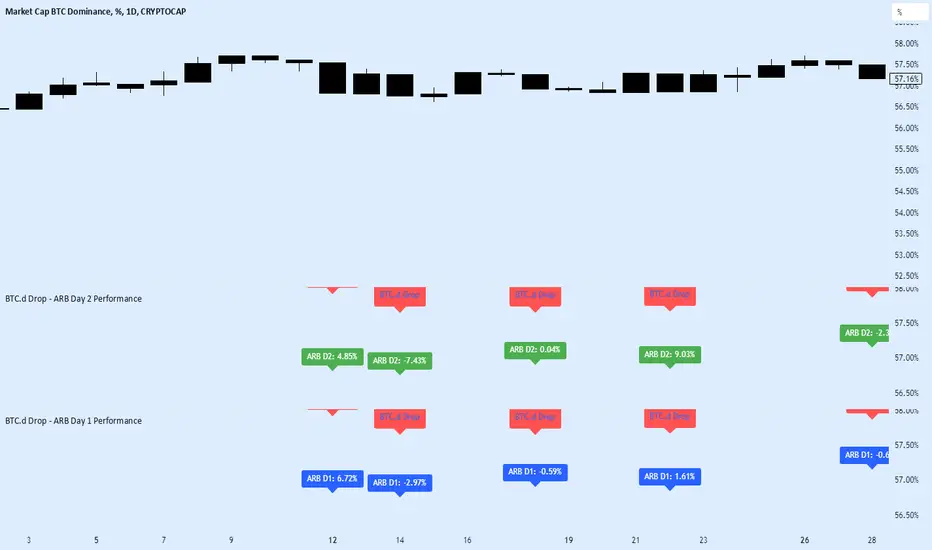
BTC.d fall over 0.5%, subsequent performance of ARBWe will try to interpret the fall in the BTC.d on day 0 and see the performance of ARB on subsequent days on Day 1 and Day 2.
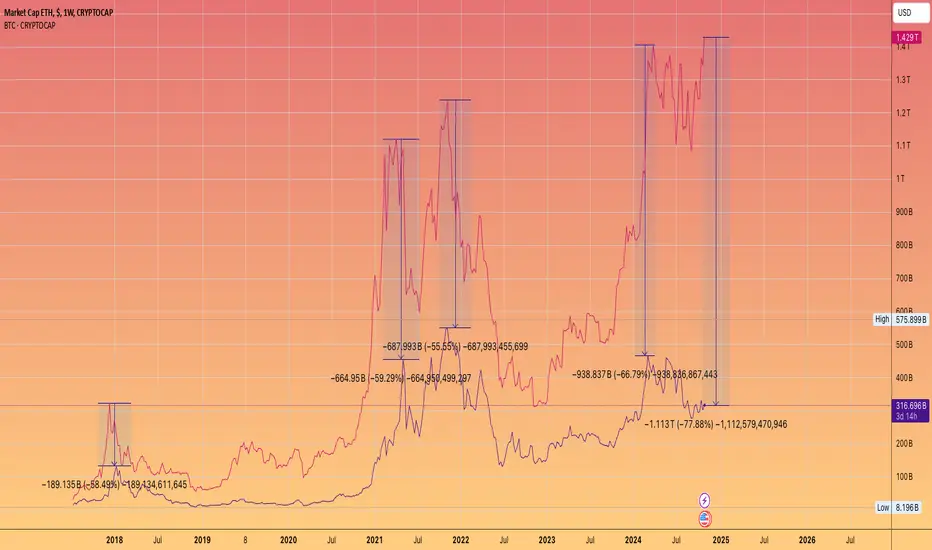
ETHEREUM is 1.1 TRILLION DOLLARS less valuable than BITCOINor -78%
The flippening was a common narrative.
ETH as hard money was also a narrative - in reality only when gas is exorbitant.
ETH as a world computer was the early narrative.
Bitcoin deserves it entry on to the world stage cycle.
ETH can become a 1 Trillion dollar + network.
Sharding and splintering of the network effects of the mainet clearly is not value creating. Splitting of communities and economic energy was the result.
Solana flippening is a good narrative that we are following this cycle.
Coins are the product of these smart contract platforms.
At the moment the best coin factory is SOL.
BTC is scarce. No coins are allowed to be created on it's. The Bitcoin forks had the stink of a founder, a human attached to it's network ... not what capital allocators.
They wanted a autonomous network that runs by itself and ossificatoin of the code. A complicated spaghetti bowl of code that the core dev team refuse to tinker with.
The results is clear at this point in time.
BTC.D top?dominance has reached the predicted target and should either begin to consolidate and then fall. Or as I expect - at most a few more days to go up and then fall, with the expectation that it will confirm resistance and we will have at least a short alt season :)

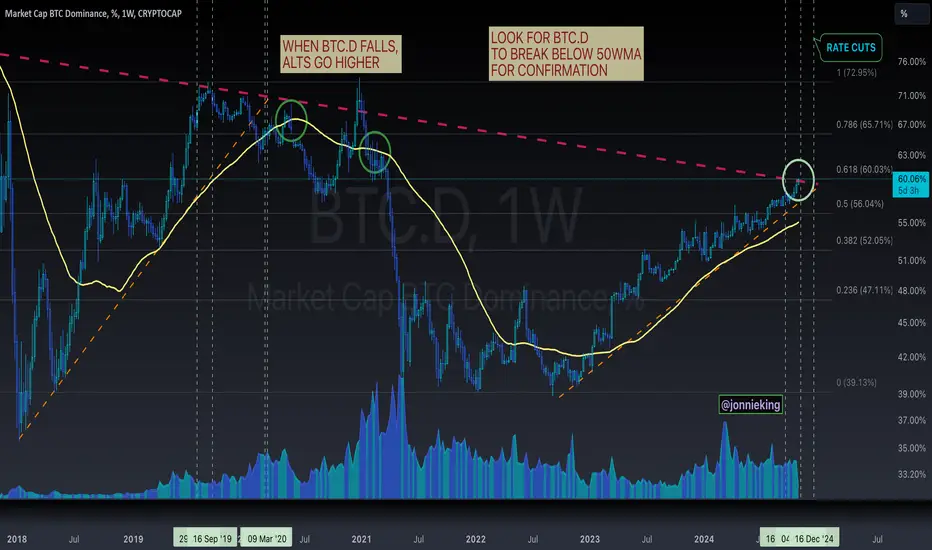
Bitcoin Dominance Update: BTC.D is about to surge to %68Bitcoin dominance has broken the main long-term resistance on the weekly and monthly charts, making it very bullish and likely to reach new highs.
In this case, we expect Bitcoin to dominate the crypto market and surpass altcoins in gains. After reaching the target of 67%, we can anticipate the alt-season to start, marking the time for altcoins to make moves.
I'm not sure if we’ll have an alt-season like before, but some altcoins are likely to experience good returns. DYOR

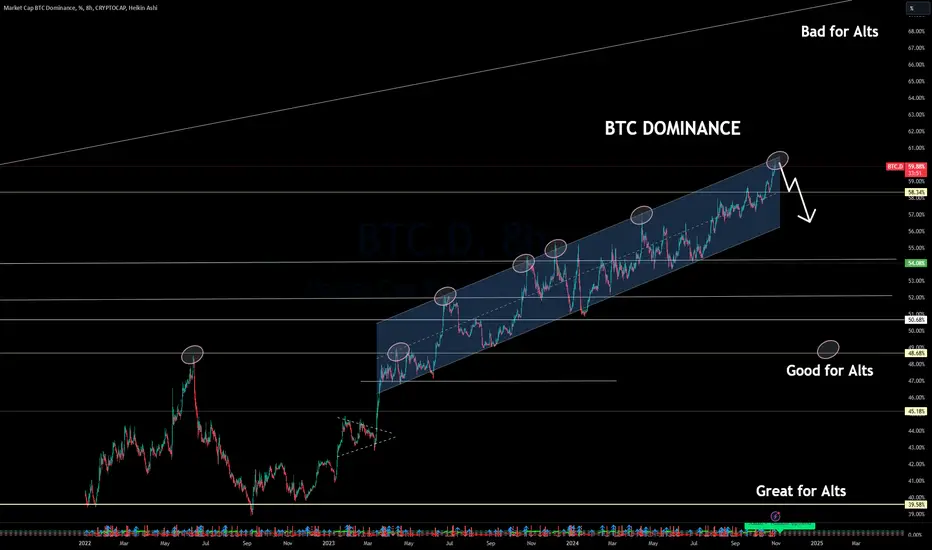
BTC Dominance explained - Impact on Altcoins and Market CyclesBTC Dominance Explained 📊 – Impact on Altcoins and Market Cycles
Understanding Bitcoin dominance is crucial for navigating the crypto market, especially when planning moves with altcoins. Let’s dive into this BTC.D chart to get a clearer view of what BTC dominance signals and how it can shape your portfolio strategy.
The BTC Dominance Range and Altcoin Opportunities 🌐
Bitcoin dominance measures BTC’s market share relative to all cryptocurrencies. Currently, we’re moving within an upward channel, nearing a significant resistance at 59%. Historically, levels above 58% have been challenging for altcoins, as a strong BTC dominance means funds flow primarily into Bitcoin rather than altcoins. The higher this percentage, the more “BTC-centric” the market becomes.
However, if BTC dominance reverses from this resistance, which the chart suggests as a possibility, it could open the door for altcoins to perform strongly. Key levels where altcoins tend to gain traction are around 54%, 50%, and ideally below 48%. Dropping to or below these levels is often where we see capital shifting into altcoins, allowing them to shine as BTC consolidates.
Why BTC Dominance Matters for Ethereum and Other Alts 🚀
As noted in my recent Ethereum analysis, a breakout for ETH could coincide with a decrease in BTC dominance. Ethereum, currently flirting with a big breakout level around $2,800, could see significant upward movement if BTC dominance declines. The fundamentals of ETH are also aligning with this technical picture, setting up a favorable environment for Ethereum to absorb some of Bitcoin’s market share.
How to Use BTC Dominance in Your Trading Strategy 📉
When BTC Dominance Rises: High BTC dominance typically signals caution for altcoin investors. When dominance is around 58% or higher, the market is likely to favor BTC over other coins. This is a “BTC season,” where Bitcoin absorbs most of the inflow, leaving altcoins with reduced momentum.
When BTC Dominance Declines: If BTC dominance drops below 54% and further towards 50%, it becomes “altcoin season,” a period where alts, especially high-cap projects like Ethereum, tend to outperform. Watch these support zones closely; they often indicate when BTC is overextended and funds may rotate into alts.
Channel Boundaries for BTC Dominance: This channel on the 8-hour BTC.D chart shows BTC dominance’s cyclical nature. Every time dominance reaches the channel’s top, altcoins often benefit if BTC reverses. Conversely, approaching the bottom of the channel can signal potential BTC strength, drawing funds away from alts.
Current Market Setup: Preparing for an Altcoin Move?
We’re at a tipping point, with BTC dominance testing upper resistance. Should we see a reversal, we could enter a favorable phase for alts, particularly Ethereum, which is primed for a breakout. The combination of Ethereum’s strong technical position and the possibility of BTC dominance declining is a powerful signal for the alt market.
By understanding and leveraging BTC dominance in your strategy, you can more effectively time your altcoin entries and exits, aligning with macro movements rather than just isolated setups. This cycle-driven approach is essential for maximizing gains across different market phases.
One Love,
The FXPROFESSOR 💙
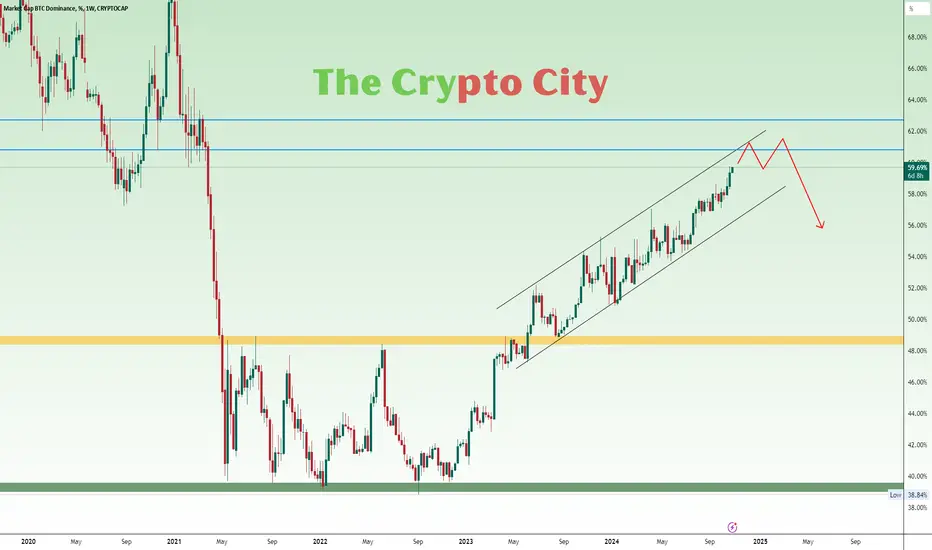
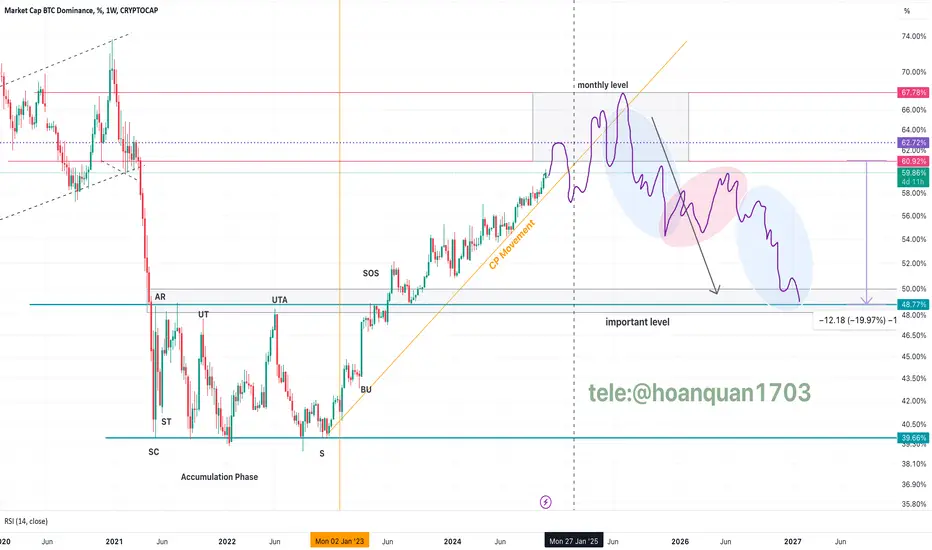
BITCOIN DOMINANCE ANALYSISBTC Dominance (BTC.D) on the 1W timeframe is expected to rise towards the marked zone between 60.92% and 67.78%. Once it reaches this level, we anticipate a potential decline in BTC.D. This shift would likely signal capital moving from Bitcoin to altcoins, paving the way for an increase in altcoin prices.
$BTC.D Hits 60% - What's Next?CRYPTOCAP:BTC has pumped over 10% the last few days which sparked Bitcoin Dominance to reach the long awaited 60% milestone.
Depending on how strong the weekly close is, CRYPTOCAP:BTC.D could reach as much as 65% before Alts start to play catch up.
1 week away until the US Presidential Election, with the following day FOMC bringing another round of rate cuts.
Things could get wild real fast. Buckle up!
Observations on Bitcoin Dominance ChartThe Bitcoin dominance level is approaching a significant resistance level, warranting attention. Although this chart is a representation rather than a real market, it appears to adhere to certain universal mathematical principles, suggesting that it may respond to key levels.
Notably, a strong resistance level is present above 60.92, which could potentially cap the current Bitcoin dominance. On the downside, support levels are visible at 57.5 and 55.5, with a more substantial support area at 50.5.
From a broader perspective, the chart indicates that we are currently in a downtrend, which may ultimately lead to a retest of the 39.0 level in the long term (potentially spanning several years).
While the outcome is uncertain, particularly given the representative nature of this chart, a potential decline from current levels could have significant implications for the market. Specifically, it may signal the onset of an "alt season," where alternative cryptocurrencies experience increased activity and growth.
Further updates will be provided as necessary, potentially in the coming years.

BTC.D#Bitcoin Dominance Analysis
BTC.D is exactly at Resistance (60%).
Breakdown from this level , will create a massive pump in #Altscoin
Mega #BullSeason Loading

BTC.D#Bitcoin Dominance Analysis
BTC.D is exactly at Resistance (60%).
Breakdown from this level , will create a massive pump in #Altscoin
Mega #BullSeason Loading
