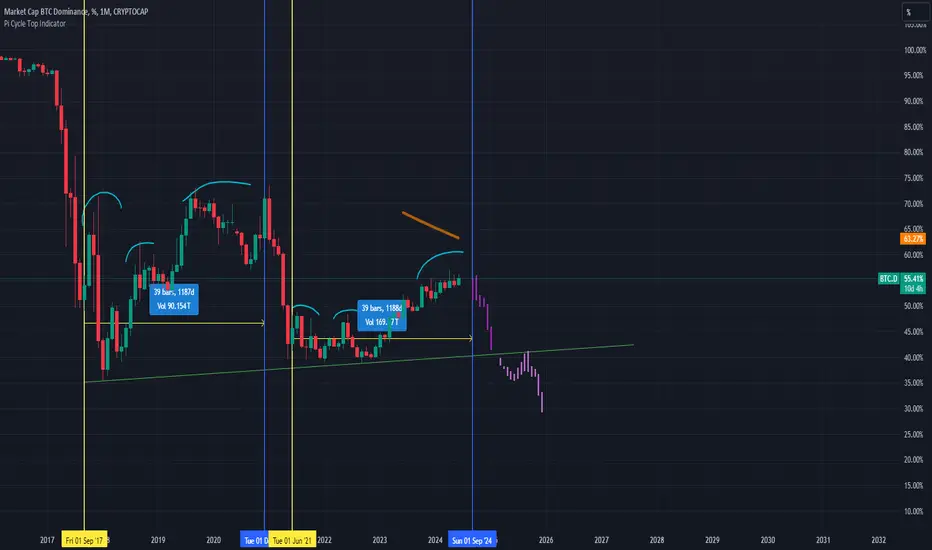
The Ragnarok of Bitcoin dominance?With concerning of TotalMarketCAP, We can see the end of Bitcoin dominance on Market
Btcdominance
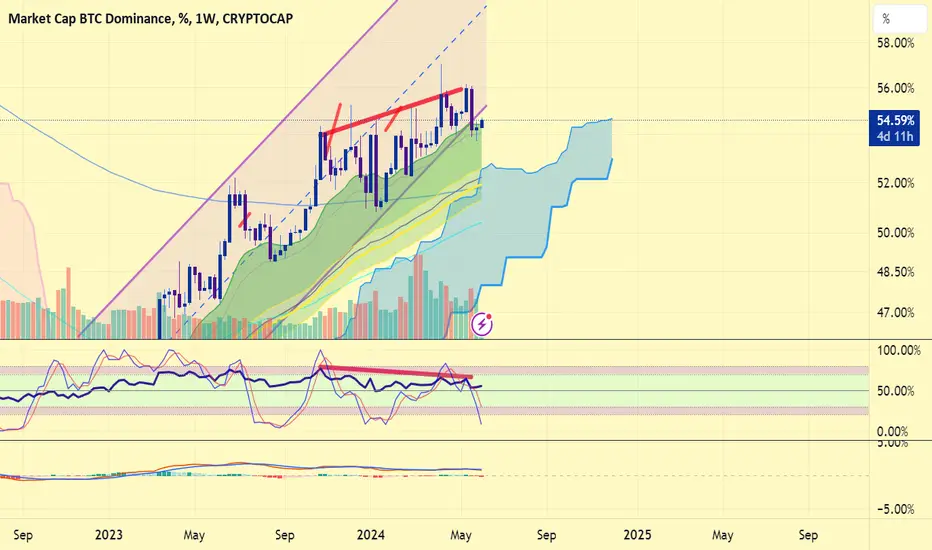
Bitcoin Dominance Technical AnalysisCurrently, Bitcoin Dominance (BTC.D) retesting the channel trend line after a breakdown from it and bounced back from the support zone (Green) at 53.69% - 54.39%. BTC.D was moving in an ascending channel from august 2022 till May 2024.
Due to the upward movement of BTC.D after making support from green zone to ascending channel trend line the alt market is heavily bleeding. That is why we always say every time you take a trade use stop loss because this market is very volatile.
If Bitcoin Dominance rejects from the channel and breaks down from the green zone we will see massive gains in the price of alt’s market and if it do inverse and did not break the zone in green moves upwards and breaks into the channel that will be a bad dream for the alt’s.
According to our analysis, we could see BTC.D pull back from here and we will see it moving towards the next levels and massive pumps in alt coins price.
Overall, we understand that BTC.D is currently in a bullish momentum. It is retesting the channel trend line and has rebounded upward from the support zone, indicating a bullish sign. However, if it breaks down from the support zone, it could shift to a bearish momentum.

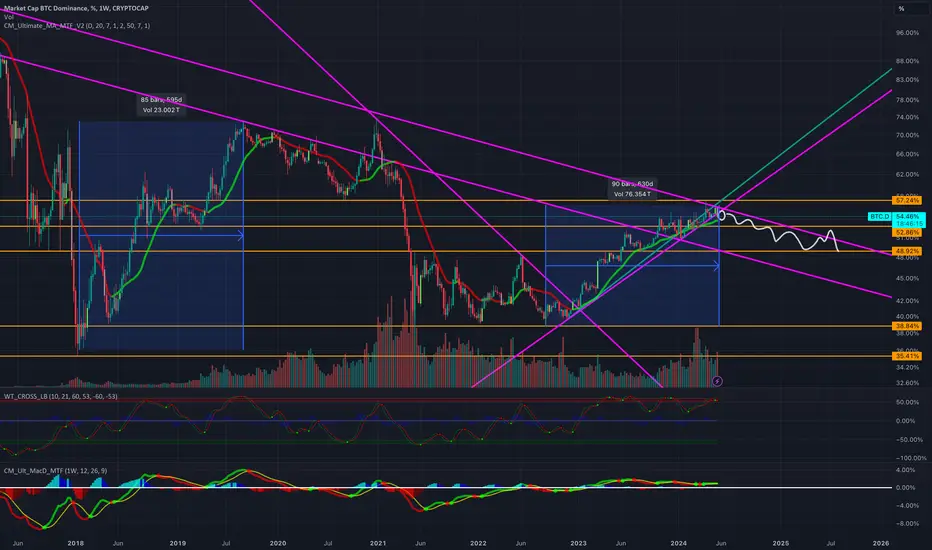
Bitcoin Dominance: Alt-Season IncomingBTC.D is facing a very important resistance and losing momentum. I expect altcoins to start pumping in the upcoming months while the Bitcoin dominance decreases
Bull Flag | Falling Wedge FormingMight be a drop here down towards the 200 day EMA/MA and the bottom of this bull flag or falling wedge on the daily.
This could provide some reliefs to #alts vs. BTC while Bitcoin corrects down to 60-63k area
Short-term short until 53-54% area, then long again, may range within the wedge for a while, too.

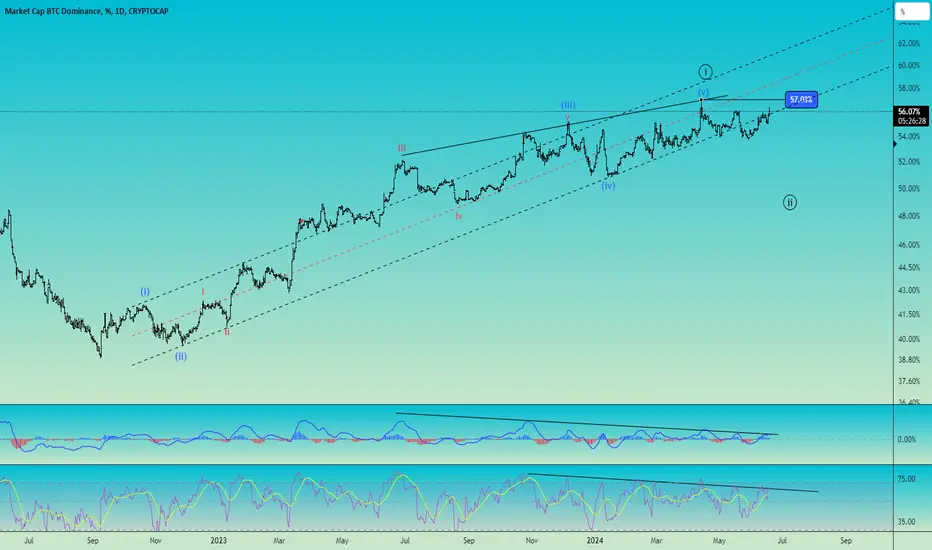
Bitcoin Dominance Elliott wave countBitcoin Dominance showing weakness also oscillators diverging may signal a switch to altcoins season soon!
TOTAL 3 - Can do +30% move versus #BTC pre halving #ALT runThis chart Total 3 minus the 3 biggest stablecoins
OVER the price of #Bitcoin
If this number is going up so are your #altcoins
We have a clear double bottom forming
just a matter of clearing the neckline to confirm.
Also interesting to note how the 0.786 Fibonacci was front-run by eager investors looking for Risk assets.

It might be end of the bullish trend in 4h chart.If daily price closes in the orange channel and continues to range around the roof in the mentioned channel, it might be a good opportunity for a short position. I'm still long, BUT am waiting for some more confirmations in the solbtc and btc.D charts.

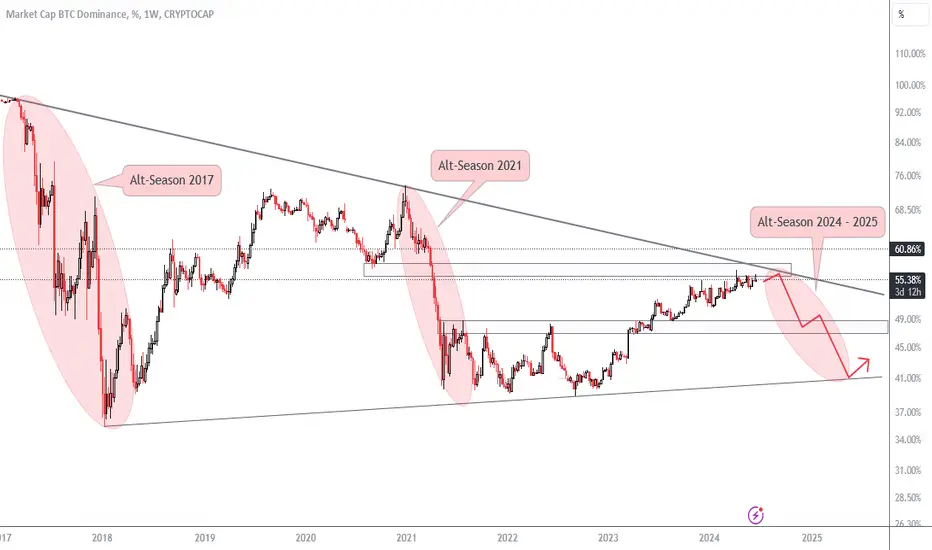
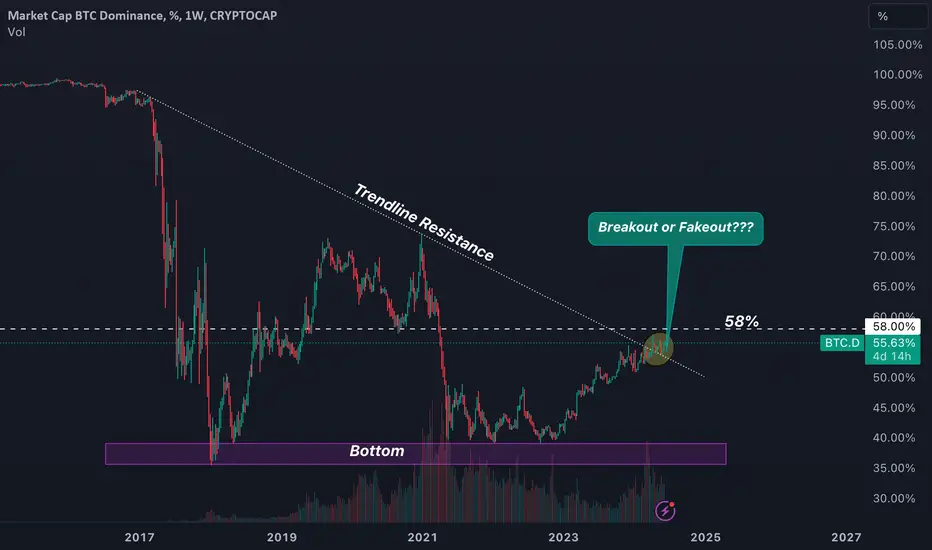
Bitcoin dominance consolidation?The dominance dump that led to the last alt coin rally, based on reviewing the monthly chart, shows a bearish engulfing candle (red box) before breaking down out of a multi year trend. This time we are seeing a recent bullish engulfing candle (green box) and what seems like a possible bearish fake out based on the bullish trend support line over the past 2 years.
What do we think is next, fellow plebs? Bitcoin dominance multi year breakout this cycle? Or what every alt coiner has been calling for over a year now …is it finally time for “alt season”???
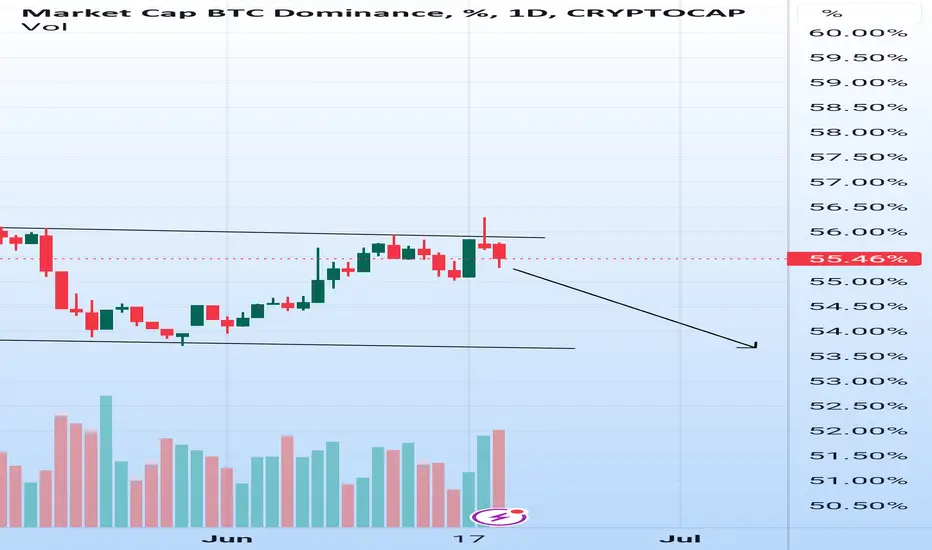
BTC.D
BTC.D is at 55.60% (Live),
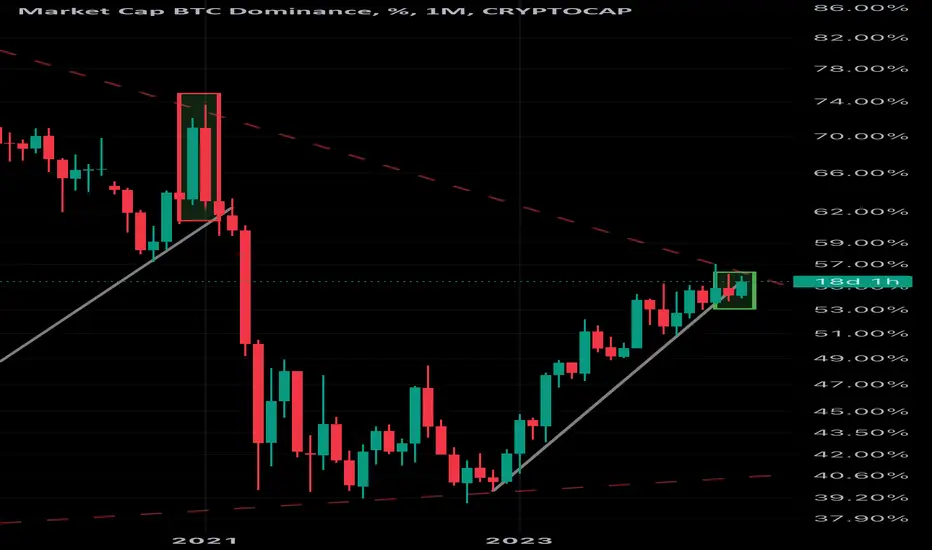
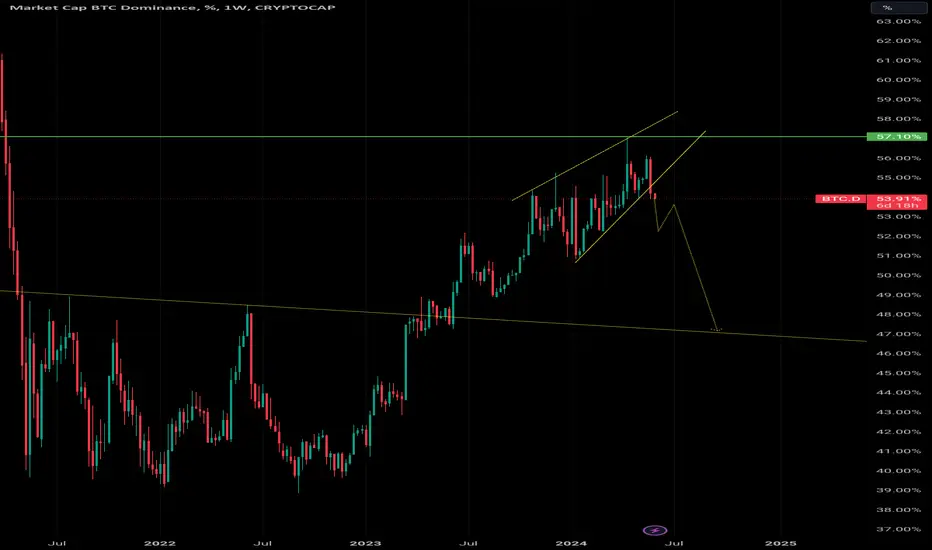
Breakout Of Trendline Resistance (58%) Will Lead A More Crash In AltsCoin
FakeOut Will Be The Bullish Sentiment For Alts Market
ETHEREUM DOMINANCE #ETH.D To 38% = $19,000 ETHThis would really upset the #Bitcoin maxis's wouldn't it? :)
The number's in terms of dollar's per coin start to get ginormous.
Assuming a $6 trillion Total Market cap and a peak dominance of 38% by ETH
= 2.28 Trillion market cap for Ethereum
Divided by the current supply of 120M coins
We get a usd value of $19k per coin
Is this my prediction ? IDK
Smashing through $10k so significantly seems hard to imagine
Unless a Ethereum ETF is launched early next year!!!
Rather than a Bull trap if approved late in 2025
Either way The ETH 38% dominance could very be a likely scenario in my mind based on this chart pattern alone.

$BTC dominance' s bearish retest#btc #bitcoin dominance has bounced after leaving the channel. Now, #btcd performing a bearish retest. If reclaims the channel BTC.d may rise. But, in my previous posts, i have said BTCD chart has an important bearish divergence (now as seen on the chart with red lines). Thus, if bearish retest succeeds, BTCD declines here and fails to enter channel, money will likely flow into #altcoins or #usdt . USDT is more likely, because #memecoins sucked the money already.
Not financial advice.
$BITCOIN DOMINANCE UPDATE👨🏻💻 CRYPTOCAP:BTC DOMINANCE (LOCAL) UPDATE
#BTC dominance was rejected from the historical descending trend line (that I believe will never be broken upwards), but faced a local horizontal support at 54%.
Once this level is broken downwards, the massive Altcoin Season will start. When majors will finally print not just 5% - 15%, but 50% - 100%+ profit.
As I said, expect this summer to be insanely profitable.
- - - - - - - - - - - - - - - - - - - - - -
CRYPTOCAP:BTC.D
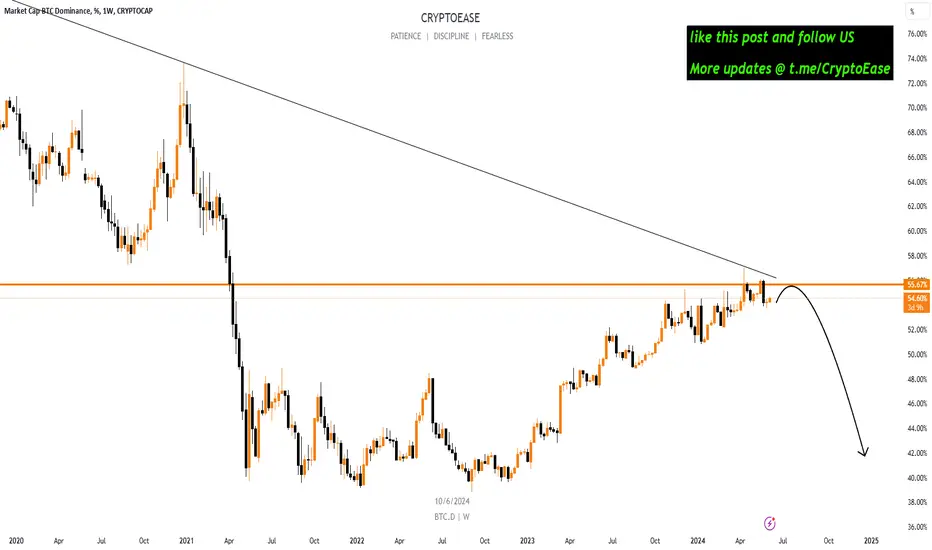
Follow #CryptoEase and Share it With Your Crypto Mate 😉
$BTC dominance will likely fallA bearish divergence formed in #btc #bitcoin dominance chart in mid term and also #BTCD is losing the ascending channel. The money will flow into #altcoins or #usdt ?Not financial advice.
BTC.D ALTSEASON 🔥🍻Hello friends, I hope you're all doing well.
The altcoin party is closer to us than the jugular vein..
The Rising Wedge Bearish pattern has broken downward.
TOTAL3 has also broken through its current resistance and pulled back.
did you notice what's happened in BTC.D (bitcoin dominance) hereafter good jump from 53.76%, we faced our big resistance which percent is 56.09%
then we saw a good correction from what we bounced .
here we are again at that strong support line which is 53.76%
we have two scenario for future:
1.we break down that support line(53.76%) which can cause our btc dominance weakness
2. we break up that yellow range and start another leg up to 56.09%
why should we analyze BTC.D chart?
watch and analyze this chart will give you a good insight for understanding where is money going throw , bitcoin or alt coins.

Beginning of Alt-Season?As you can see BTC.D making huge divergence, and Bitcoin's volume going down bit by bit. Doesn't mean that Bitcoin gonna go down right away, maybe it is time to BTC to cool down a bit. 47% is reasonable target, but could go down till 43%. Longer it goes down better for Altcoin and Alt-season.
Will do update on some of the altcoin.

Can BTC dominance break free?CRYPTOCAP:BTC.D chart is testing the trend line.
I'm not sure whether BTC dominance will rise after crossing the trend line, but it's a good time to take a look.
Let's see what happens!
ALT season incomingBTC Dominance has been rising since the end of 2022.
That's about 1.5 year.
We can find a similar pattern from Jan 2018 - Sep 2019 (little over 1.5 year), BTC dominance had dropped from Sep 2019 - May 2021 (about 1.5 year)
I drew the expected BTC dominance for next 1 year (white line)
Let's see the result after a year.
BTC.D at Critical Support: Potential Altcoin Bullish ScenarioBTC Dominance (BTC.D) is currently testing a crucial monthly support line from the end of 2022. A break below this level could signal a significant trend reversal, favoring altcoins and potentially marking the start of an altseason.
Key Points:
Critical Support Test: BTC.D is at a key monthly support line from late 2022.
Historical Context: The last significant breakdown of this level occurred at the end of the 2021 bull run, with another instance in mid-2022.
Potential Impact: A break below the 54% level could push BTC.D down to the next major support around 52%, which would be extremely bullish for altcoins.
Conclusion:
Losing the 54% support level in BTC.D might lead to a drop to 52%, possibly initiating a strong bullish trend for altcoins. This scenario could be the start of altseason, so keep a close watch on BTC.D for potential trading opportunities in the altcoin market.

Here's What You Can Expect On Wall Street & In The Crypto SpaceThere are no surprises with the U.S. dollar, vix, gold, precious metals, commodities, and stocks. Everything is right on track. We are nearing our SPY blow-off top target of 570-600, but we have some time to hit that before the U.S. election charades and the future recession. We'll review these things and then focus on what price action will look like in the coming weeks for the crypto space. Plus, I have added an extra video for my members in which I'll review the current altcoin entries we are in. I'll let you know clearly what my sentiment and strategy is for trading these coins, a few of which have 3-4x targets! Quickly, I believe our local low in the altcoin space is in and we are going to pop soon. Some coins will fare much better than others. I want you in those coins. Let's go!

The party is about to start in ALTsThe party is about to start in ALTs..There might be a little more pain.
Even Some ALTS will Bounce in discovery mode.
