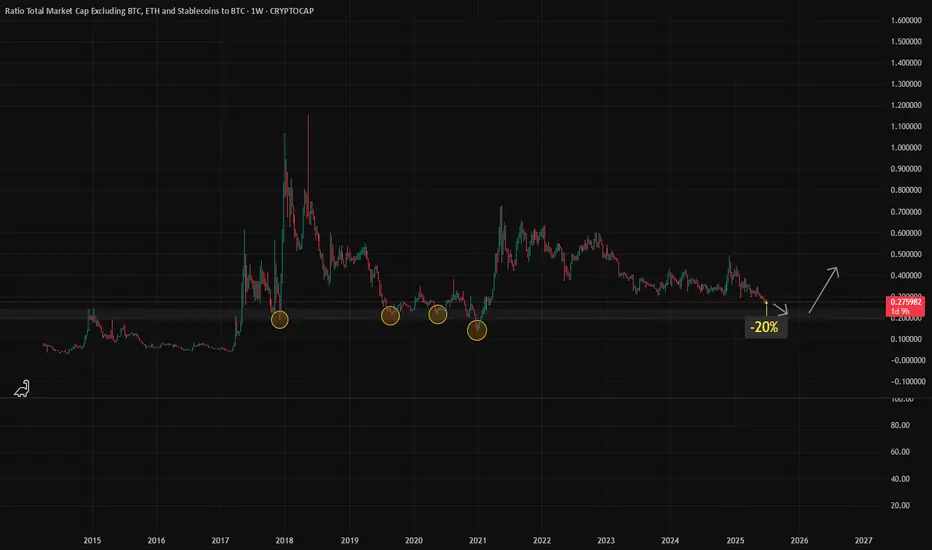
Altcoins Near Key Support, Possible -20% Drop before reversal ?Sharing my analysis on the altcoin market cap (excluding BTC, ETH, and stablecoins) compared to BTC over the past 10 years
I have marked important zones (yellow circles) where altcoins have historically bounced after strong corrections.
Current Outlook:
- I expect a possible -20% more downside, bringing it near 0.22, which aligns with a key historical support zone.
- This level has acted as a strong base multiple times, in 2018, 2020 and 2021
What I’m Watching:
- If price reaches that zone and holds, it could signal the start of the next altseason.
- Past patterns show similar moves before big reversals.
- However confirmation through volume and market sentiment is important before making any move
Final Note:
Not financial advice, just sharing what I see on the chart. If the ratio hits 0.22 and shows strength, it could be a key level to watch. Thanks
Btcdominance
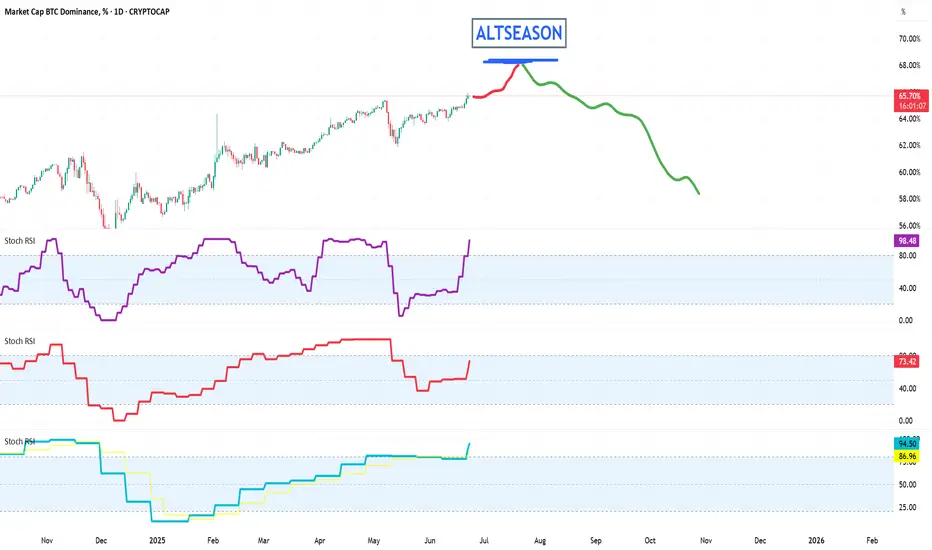
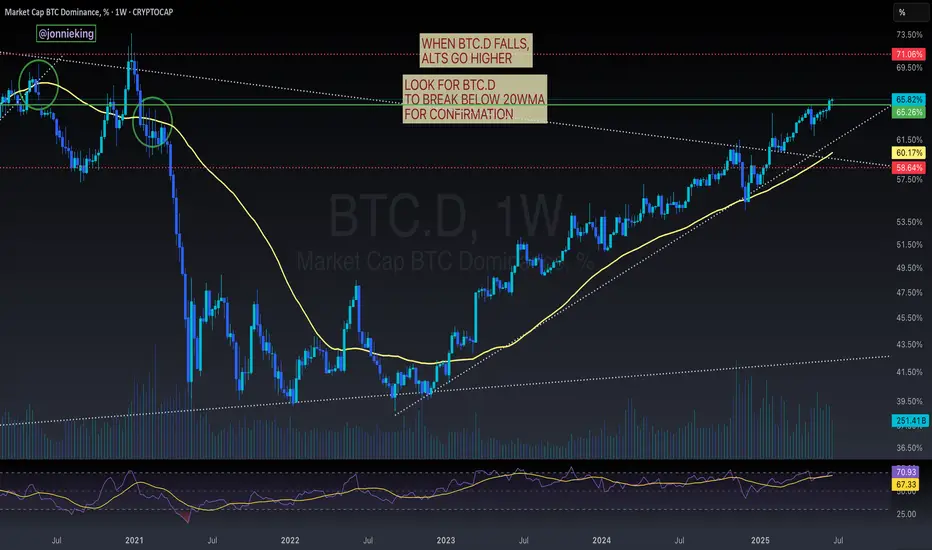
Bitcoin Dominance Nearing a Top — Altseason Incoming in JULYBitcoin Dominance (BTC.D) is approaching overbought levels on several key oscillators across multiple timeframes. While the 1-Week chart still shows momentum that could push BTC.D slightly higher over the next few weeks, the indicators are signaling an upcoming shift.
📅 Timing the Rotation:
We're eyeing mid to late July as the likely window for a rotation into altcoins. This would mark the beginning of a potential mini altseason, where top-performing altcoins could outpace Bitcoin for a limited but lucrative period.
💼 Strategy Insight:
This could present a strong opportunity to trim or exit older alt positions from earlier in 2024—especially if they rally hard during this period of temporary dominance weakness.
🔍 Watch the oscillators and volume trends closely. The BTC.D reversal could be subtle at first but may lead to outsized moves in select alts.
TradeCityPro | Bitcoin Daily Analysis #119👋 Welcome to TradeCity Pro!
Let’s go over the analysis of Bitcoin and the key crypto indexes. As usual, in this analysis I’m going to review the futures triggers for the New York session.
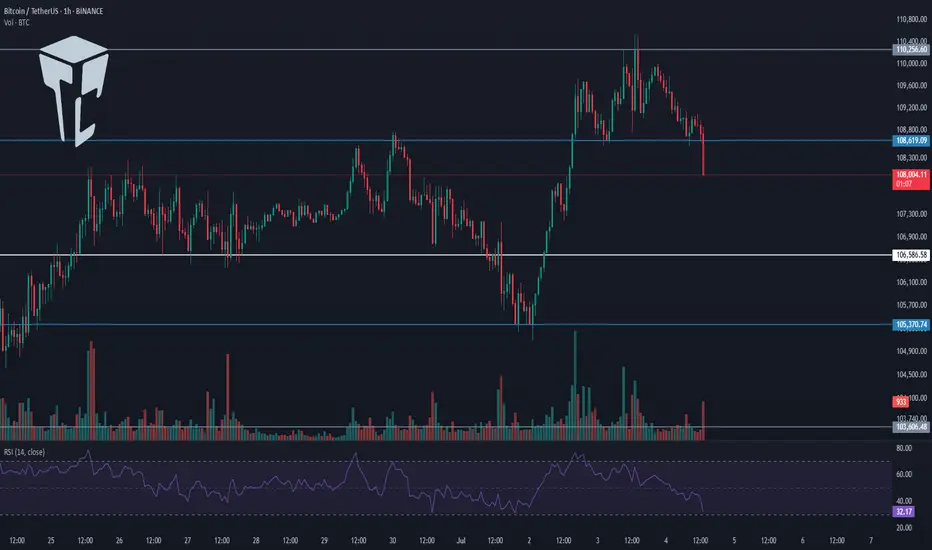
⏳ 1-Hour Timeframe
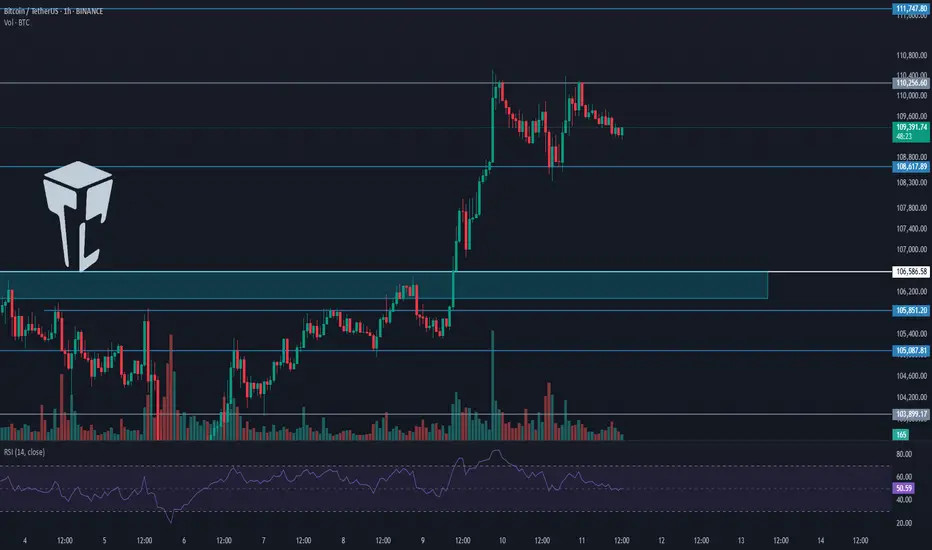
Yesterday, the price broke out of the range box between 108619 and 110256 that I had marked for you, and with the heavy selling volume that entered the market, this bearish move took place.
✔️ This move continued to the 107448 zone, and as you can see, we are now in a consolidation and rest phase, and once again the volume has dropped significantly.
✨ As I mentioned in yesterday’s analysis, I believe this low volume will persist through the weekend, and for a solid move to happen, we’ll need to wait for the new week to begin.
💥 For now, the price has room to move up to 108619 and perform a retracement. A break above the 50 zone on the RSI greatly increases the likelihood of this move.
📊 If selling volume re-enters the market and the price moves downward, the short trigger we have is the 107448 level, and breaking it could start the next bearish leg.
📈 For a long position, the price must first stabilize above 108619, and then, if we see that buying volume continues and increases, we can enter a long position. The main trigger will be 110256.
⭐ I myself won’t be opening any positions for now and will wait until the market shows some proper volume and trend before entering. If you plan to open a position based on these triggers, I suggest you take on very little risk so that in case your stop-loss is hit, you don’t lose much money.
👑 BTC.D Analysis
Let’s look at Bitcoin dominance. Yesterday, dominance touched the trendline I had marked and is still dealing with this dynamic resistance.
💫 A bottom has formed at 65.38. If this bottom is broken, we’ll get confirmation of rejection from the trendline, and dominance could have a bearish move down to 65.04.
⚡️ If the trendline is broken instead, we’ll have a new trigger at 65.52, and breaking it would confirm a bullish reversal in dominance. The main trigger will still be a break of 65.64.
📅 Total2 Analysis
Now let’s move on to Total2. This index dropped to the 1.13 zone and has now pulled back to 1.14. It seems like it’s getting ready for another downward move.
☘️ If Bitcoin dominance gets rejected from the trendline and moves down, and if Bitcoin moves upward, Total2 could make a very sharp move.
🔑 Even if Bitcoin drops, Total2 might range or even move up. For now, our short trigger is 1.13, and aside from 1.14, we don’t have any specific long trigger.
📅 USDT.D Analysis
Finally, let’s look at Tether dominance. This index made a bullish move to 4.85 after breaking 4.78 and is now in a corrective phase.
📊 If 4.85 is broken, the next bullish leg could continue up to 4.93. If a correction happens, dominance might pull back to 4.78.
❌ Disclaimer ❌
Trading futures is highly risky and dangerous. If you're not an expert, these triggers may not be suitable for you. You should first learn risk and capital management. You can also use the educational content from this channel.
Finally, these triggers reflect my personal opinions on price action, and the market may move completely against this analysis. So, do your own research before opening any position.
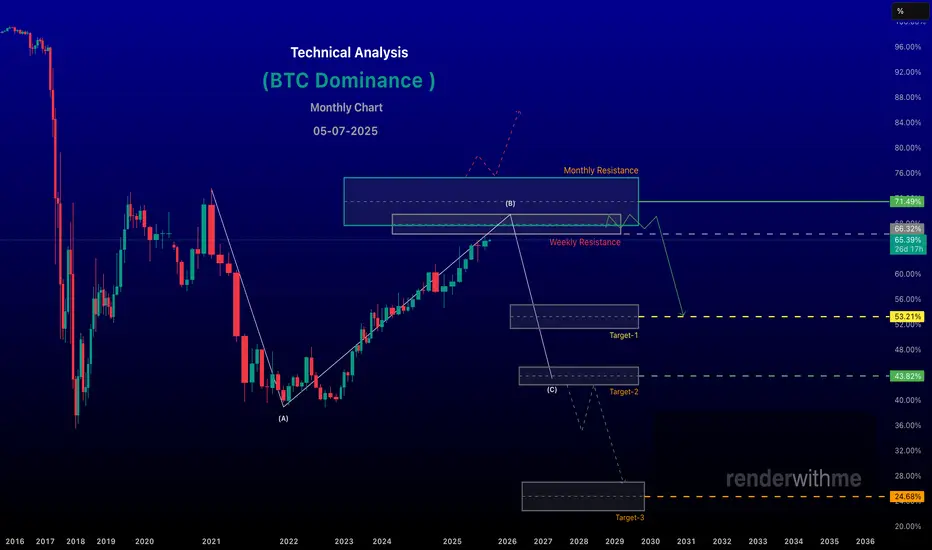
renderwithme | BTC - Dominance about to hit resistanceBitcoin dominance (BTC.D), which measures Bitcoin’s market capitalization as a percentage of the total cryptocurrency market cap, is a key indicator of market sentiment and capital flow between Bitcoin and alt coins . As of July 5, 2025, recent data and technical analysis suggest Bitcoin dominance is at a critical juncture, with potential shifts in market dynamics for the upcoming week. Below is an analysis based on current trends, historical patterns, and technical indicators.Current State of Bitcoin DominanceCurrent Level: Bitcoin dominance is approximately 64.36% to 65.68%, based on recent data .
Recent Trends: Dominance has been testing a multi-year resistance zone between 66.5% and 69.5%
Historical highs in this range (e.g., 64.34% in early 2025) have often preceded pullbacks or altcoin rallies.
Chart indicate bearish signals, such as weekly bearish divergences and potential reversal candles, suggesting a possible decline.
Technical Analysis for Next WeekResistance and Support Levels:Resistance: The 66.8%–67.2% zone is a critical resistance level, aligning with Fibonacci extensions and a long-term descending trend line. A failure to break above this could signal a reversal.
Support: Key support levels are at 61.90%–62.20%, with a potential drop to 58% if bearish momentum accelerates.
Chart for your reference
Disclaimer --
This analysis is based on recent technical data and market sentiment from web sources. It is for informational purposes only and not financial advice. Trading involves high risks, and past performance does not guarantee future results. Always conduct your own research or consult a SEBI-registered advisor before trading.
#Boost and comment will be highly appreciated
TradeCityPro | Bitcoin Daily Analysis #118👋 Welcome to TradeCity Pro!
Let’s dive into the Bitcoin analysis and key crypto indexes. As usual, in this analysis, I’ll review the futures triggers for the New York session.
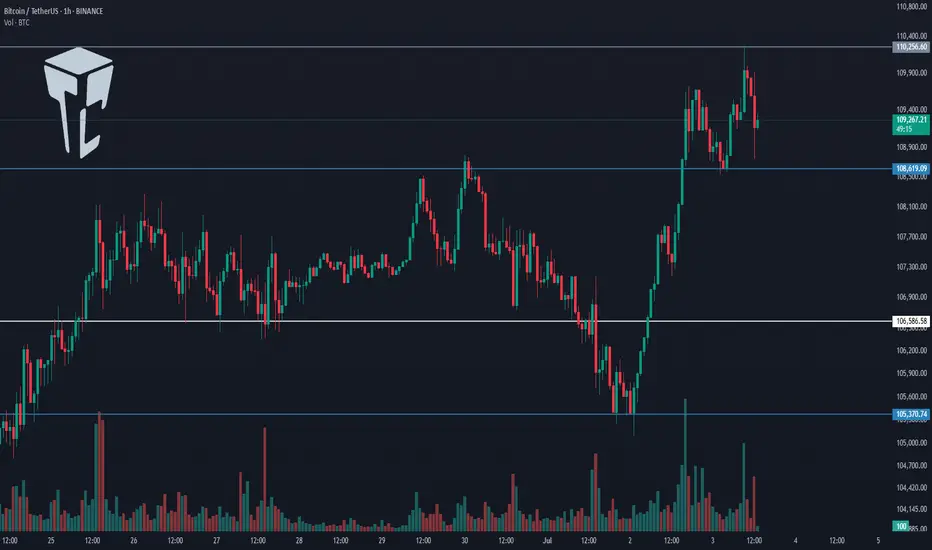
⏳ 1-Hour Timeframe
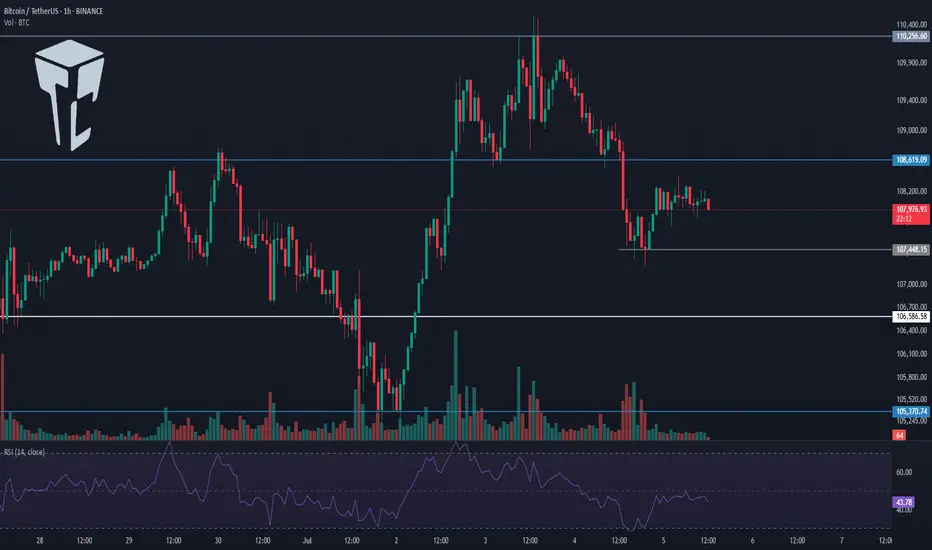
On the 1-hour timeframe, the price remains within the same range box between 108619 and 110256, and it is currently sitting at the bottom of that box.
✔️ Since yesterday, market volume has significantly declined — as you can see, there's practically no real volume in the market.
⭐ On the other hand, it seems the 108619 trigger is about to be activated, and price may move downward. However, personally, as long as market volume stays this low, I prefer not to open any positions.
📊 If we see selling volume entering the market following a break below 108619, I’ll consider opening a short position. But in the current situation, as mentioned, I prefer to stay out of the market.
💥 The RSI oscillator is steadily and gradually declining like a waterfall. This is also due to the lack of volume in the market, which has led to very low price volatility.
⚡️ So for now, it's better not to rely on RSI data because without volume, RSI readings won't be useful.
📈 If the price gets supported at the 108619 level with a good buying volume and starts moving toward 110256, the chance of breaking that level will increase significantly.
👀 If that happens, I’ll personally try to open a long position once 110256 breaks. But I think today, Saturday, and Sunday will remain the same in terms of market conditions, and real volume will likely return starting next week.
👑 BTC.D Analysis
Moving on to Bitcoin Dominance, a descending trendline can be drawn here, which has been tested twice and is now being approached again.
☘️ If BTC dominance gets rejected from this trendline and moves downward, it will likely reach the 65.04 support level. If the trendline breaks, the next resistance will be 65.64.
📅 Total2 Analysis
Looking at Total2, you’ll notice it’s showing more bearishness than Bitcoin and has lost the support it formed at the 1.15 level.
💫 This happened because BTC dominance has been rising since yesterday, which means more money has been flowing into Bitcoin than into altcoins.
🔼 The next support level for Total2 is at 1.13, and a potential downside move may reach this zone. The suitable long trigger remains a break above 1.17.
📅 USDT.D Analysis
Finally, USDT Dominance has exited the range box it had formed and climbed back above the 4.78 level.
🎲 If this upward move continues, the next major resistance will be 4.90. However, if this move turns out to be fake, the short trigger for a bearish reversal will be a break below 4.72..
❌ Disclaimer ❌
Trading futures is highly risky and dangerous. If you're not an expert, these triggers may not be suitable for you. You should first learn risk and capital management. You can also use the educational content from this channel.
Finally, these triggers reflect my personal opinions on price action, and the market may move completely against this analysis. So, do your own research before opening any position.
BTC Dominance – History Repeating? Altseason 2025 Loading? Hey Traders!
If you’re finding value in this analysis, smash that 👍 and hit Follow for high-accuracy trade setups that actually deliver!
This chart is SCREAMING for attention 👀
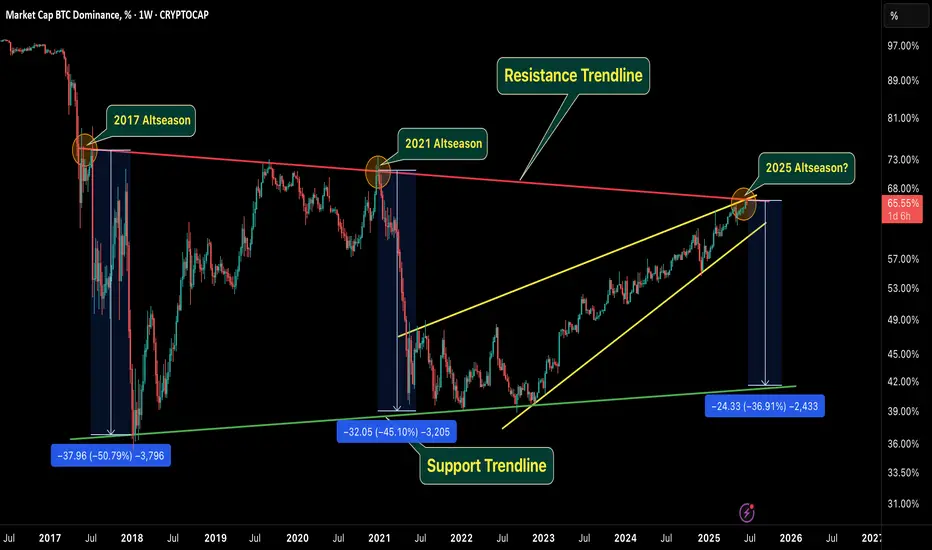
We’re at a critical inflection point on the weekly BTC Dominance chart — and if history has taught us anything, it’s that altseasons are born when dominance collapses from resistance.
🧠 Key Observations:
🔺 Macro Resistance Trendline:
Rejected in 2017 → Altseason 🔥
Rejected in 2021 → Altseason 🔥
Now (2025?) — BTC.D is again touching this same red trendline...
🟢 Support Trendline:
BTC.D formed a clean long-term support from which previous dominance drops have bounced — currently lining up around 42–45%.
📉 Previous drops after rejection:
2017: –50.79%
2021: –45.10%
2025 projection? –36.91% (which would bring us to the same support zone again)
🟡 What It Means:
If BTC.D gets rejected from this resistance again, it could mark the start of the long-awaited Altseason 2025. A breakdown from this wedge would likely result in capital rotation from BTC into altcoins — just like in previous cycles.
🔍 What to Watch:
A confirmed rejection from this red resistance line
Drop below the yellow wedge support
BTC sideways / ETHBTC strength = green light for ALTS
💥 This could be the altcoin opportunity of the next couple of years.
Conclusion:
All eyes on BTC Dominance — because when it falls, altcoins usually FLY.
📊 Stay updated, stay ready.
TradeCityPro | Bitcoin Daily Analysis #117👋 Welcome to TradeCity Pro!
After nearly 20 days of inactivity on this channel, we’re back with our regular analyses. As the first post in this new round, I’ll continue the Bitcoin series and present analysis number 117.
✅As usual, the analysis is done on the 1-hour timeframe to identify potential futures triggers for the New York session.
📰 Before diving into the charts, let’s briefly look at the market fundamentals. Over the past three weeks, we’ve had the news of the conflict between Iran and Israel. Aside from the initial couple of days, it didn’t have a significant impact on the market, and eventually, the market stopped reacting to it. Right now, the two countries have agreed to a ceasefire and seem to be negotiating.
🔍 In my opinion, the market is unlikely to care anymore whether this war continues or not. Whether they reach an agreement or not probably won’t make a big difference to the market.
🔑 The other major event was the Federal Reserve meeting. Everyone was expecting Jerome Powell to provide some clear outlook regarding US monetary policy, but once again, that didn’t happen. Powell didn’t provide any meaningful data.
📊 This uncertainty led to minimal market volatility and prevented any strong legs from forming, with no significant volume entering the market as everyone was waiting for Powell’s remarks. Since that didn’t yield much, the market remains indecisive for now.
💥 We’ll have to wait and see what kind of impactful news comes in the future. Until then, it’s best to remain patient.
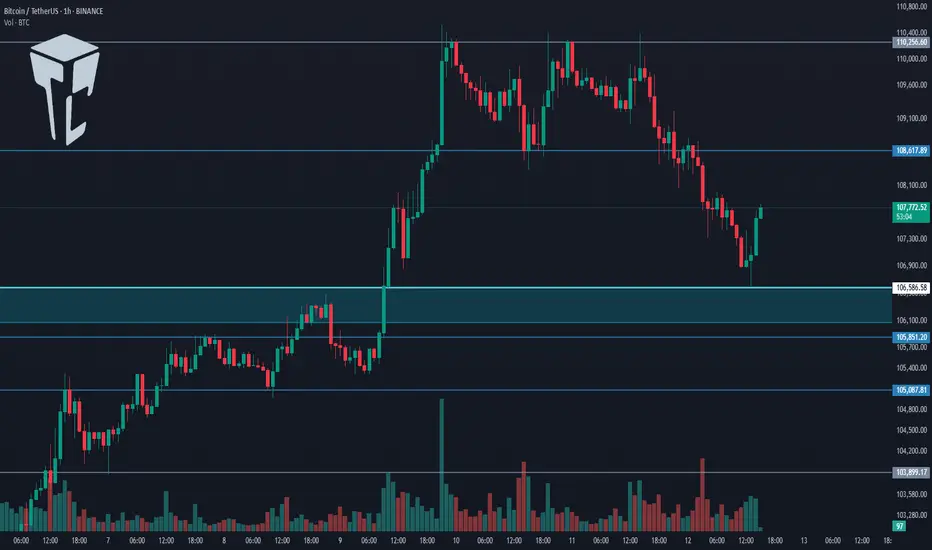
⏳ 1-Hour Timeframe
On the 1-hour chart, you can see a bullish move that started from the 105370 zone, and with strong buying volume, price broke through 108619 and reached the top of 110256.
✨ Currently, price has only wicked into 110256 and hasn’t shown a decisive reaction to it yet. If it revisits this zone, we’ll be able to observe its real reaction to the supply level.
🔔 The current support zone is 108619, which has already received a bounce, forming a range box between 108619 and 110256.
📈 If the 110256 level breaks, the upward move could continue with another bullish leg.
🔽 For short positions, the first trigger would be a confirmation below 108619. But for a more reliable short, I would wait for the price to form a lower high and a lower low below that zone before entering.
👑 BTC.D Analysis
Bitcoin dominance is currently hovering around a key support at 65.04. A key resistance sits at 65.64, which would be the first trigger for bullish continuation.
⭐ The main breakout level for starting a new bullish trend in dominance would be 65.97. For bearish confirmation, a break below 65.04 would suffice.
📅 Total2 Analysis
Looking at Total2, a range box has formed between 1.15 and 1.17, with price oscillating in between.
🧩 Momentum is currently bullish, and there’s a high chance of breaking above 1.17. If this level is broken, we could see another bullish leg and a long position would be valid.
📉 For shorts, a break below 1.15 would be the first signal, but I personally prefer to wait for a clearer trend change before entering any short positions.
📅 USDT.D Analysis
USDT dominance is also ranging between 4.72 and 4.78, very similar to Total2.
📊 A break below 4.72 would confirm a bearish move, while a break above 4.78 would indicate bullish continuation for dominance.
❌ Disclaimer ❌
Trading futures is highly risky and dangerous. If you're not an expert, these triggers may not be suitable for you. You should first learn risk and capital management. You can also use the educational content from this channel.
Finally, these triggers reflect my personal opinions on price action, and the market may move completely against this analysis. So, do your own research before opening any position.
BTC.D Daily – Bearish ShiftBTC.D on the daily is turning bearish.
PSAR has flipped bearish, and MLR < SMA < BB center — a clear sign we could see lower levels ahead.
The next possible support is the 50MA.
Always take profits and manage risk.
Interaction is welcome.

₿itcoin Dominance New Cycle High 66% ₿itcoin Dominance reaches new cycle high tapping 66%
If there's one thing I learned this cycle, it's never to sell your CRYPTOCAP:BTC for Alts.
If you want to play the casino, play with USD 💯
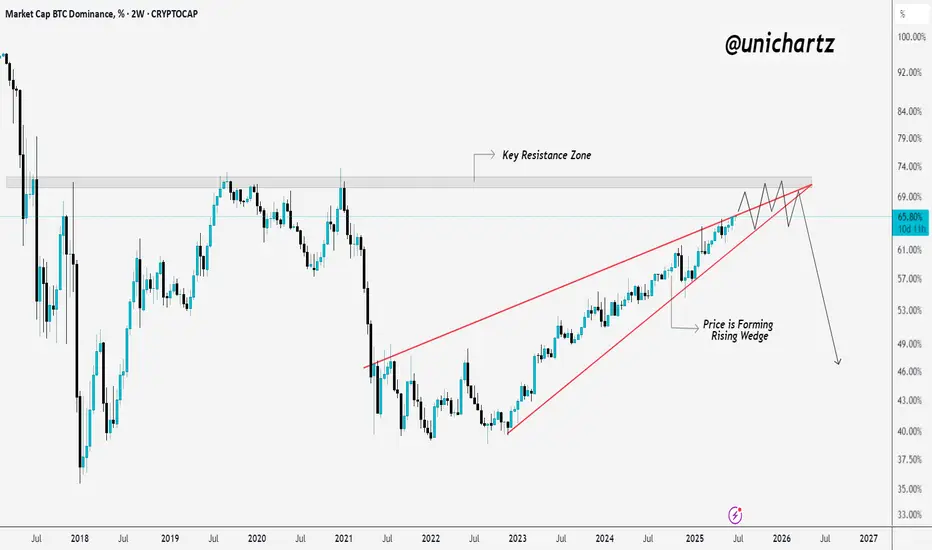
BTC Dominance Nearing Major Reversal Zone?Dominance has been grinding higher for months, but it's now walking into heavy resistance, and the structure looks like a rising wedge (not a great sign for bulls).
This setup often ends with a breakdown, which could be the spark altcoins are waiting for.
It’s not confirmed yet, but the chart’s starting to hint at a shift.
Watch closely, big moves usually follow tight squeezes.
Altseason isn’t cancelled, it’s just delayed. Here's WHY!CRYPTOCAP:BTC Dominance Update:
Altseason isn’t cancelled, it’s just delayed.
The key zone to watch is 69.5%–73% dominance. That’s where we’re likely to see a strong rejection if it doesn't start soon, which seems unlikely given the current circumstances.
The longer it takes to reach that level, the stronger the altcoin rally will be once it hits.
This isn’t hope, it’s exactly what the charts are showing.
Historically, 70% dominance has acted as a major reversal zone.
If there are signs of reversal before this level, I'll let you know beforehand.
So follow me if you don't and share this chart with your crypto friends.
Do not forget to keep cash/stables!
Let me know what you think in the comments.
Thank you
#PEACE
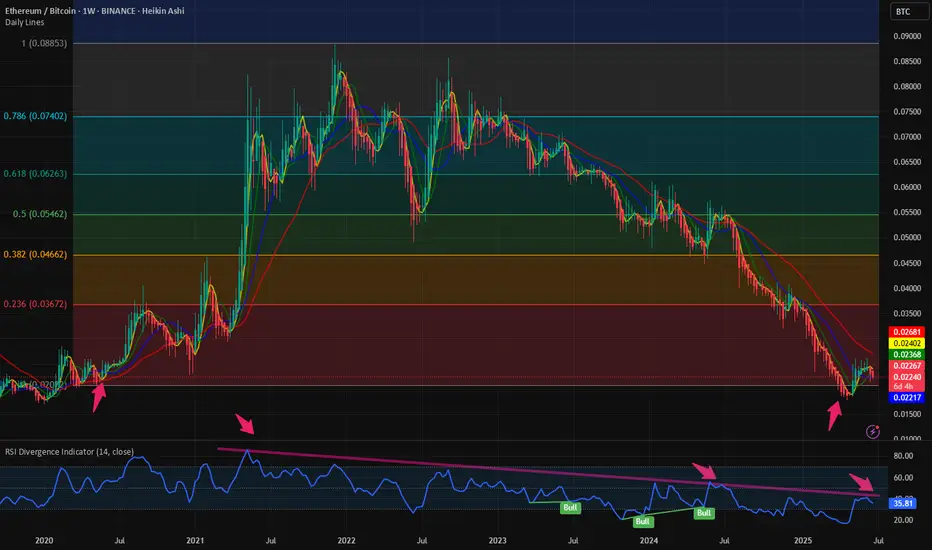
$ETHBTC failed multiyear breakout. To understand the investor positioning in the Crypto markets we must understand the CRYPTOCAP:BTC values of the Altcoins. In terms of USD the valuations might go up but if we look at the pair trade of the Altcoins relative to CRYPTOCAP:BTC we can relay understand the flow among the various Cryptocurrencies.
Let’s understand the relationship between CRYPTOCAP:BTC and CRYPTOCAP:ETH , the second largest Crypto and the largest one in the CRYPTOCAP:TOTAL2 index. Below we have plotted a multiple year BINANCE:ETHBTC chart for reference. IN the previous cycle the BINANCE:ETHBTC char bottomed @ 0.02 and then BINANCE:ETHBTC had a bull run where the chart topped out on 0.09. This was during the rush of Crypto Punks and the likes which were traded using $ETH. At the same time the RSI of BINANCE:ETHBTC also peaked at 90. Since then, it has been bleeding slowly.
The BINANCE:ETHBTC has suffered a series of lower lows and lower highs forming a bearish pattern. The RSI also never regained in strength and has also been forming lower highs and lower lows. This April the BINANCE:ETHBTC touched the last cycle low of 0.02. Since then, it has tried a bounce back but failed again at 0.025. My prediction is that the BINANCE:ETHBTC will struggle to break out of the 0.236 Fib retracement levels plotted on the previous cycles Highs to the Lows.
Verdict : BINANCE:ETHBTC looks bearish on medium to long term. Short term bounce back possible to 0.0375.
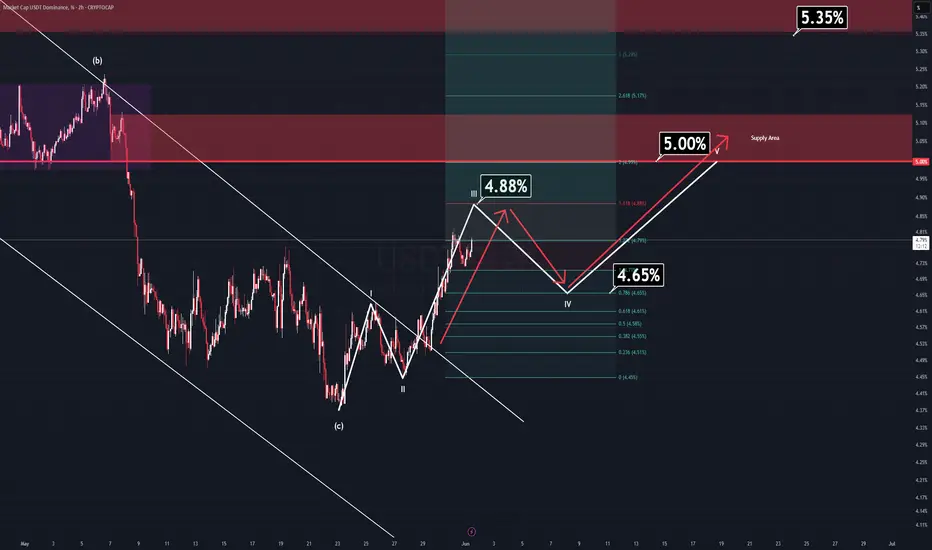
USDT Dominance Update (2H)The USDT Dominance (USDT.D) chart — often referred to as the “reverse chart of crypto” — is currently showing signs of strength. On the micro time frame, a new impulsive wave structure has emerged, and we are likely progressing through wave 3 of this formation.
Wave 3 appears to be targeting the 4.88% level.
A minor correction (wave 4) may follow.
Ultimately, wave 5 is projected to reach the 5.00% zone.
Market Implications:
If this scenario unfolds as expected:
Bitcoin could down toward the $100,000–$101,000 range.
However, altcoins may face a sharp correction, with potential losses of 15–20%, exacerbated by the rising BTC dominance and capital flow concentration.
⚠️ While macro bullish momentum remains intact for the market, this short-term USDT.D surge could present a temporary but significant shakeout, especially across the altcoin sector.
— Thanks for reading.
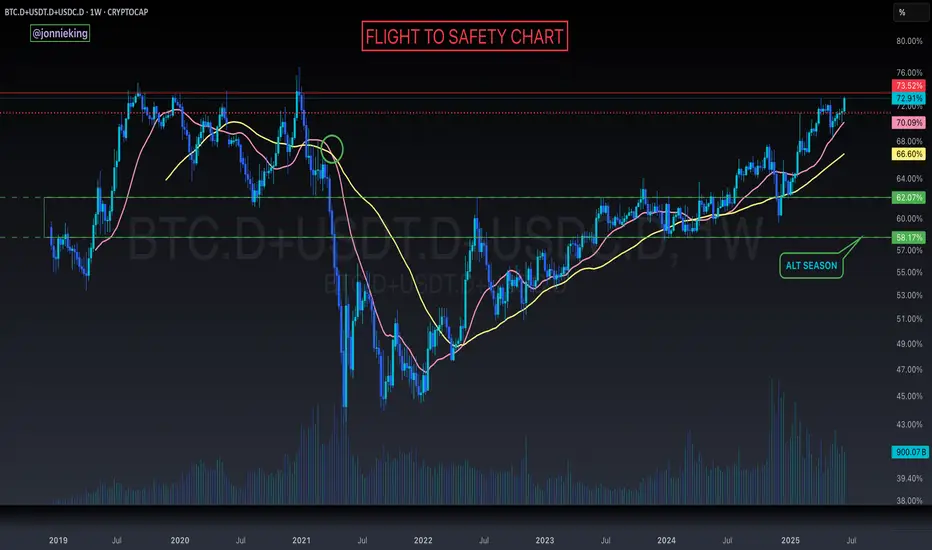
BTC.D + USDT.D + USDC.D > FLIGHT TO SAFETY SurgingStructures are being broken across the board 🚨
Looks like the Flight to Safety chart is closing the week at a new cycle ATH.
Should push to 74% before we see a meaningful turn around.
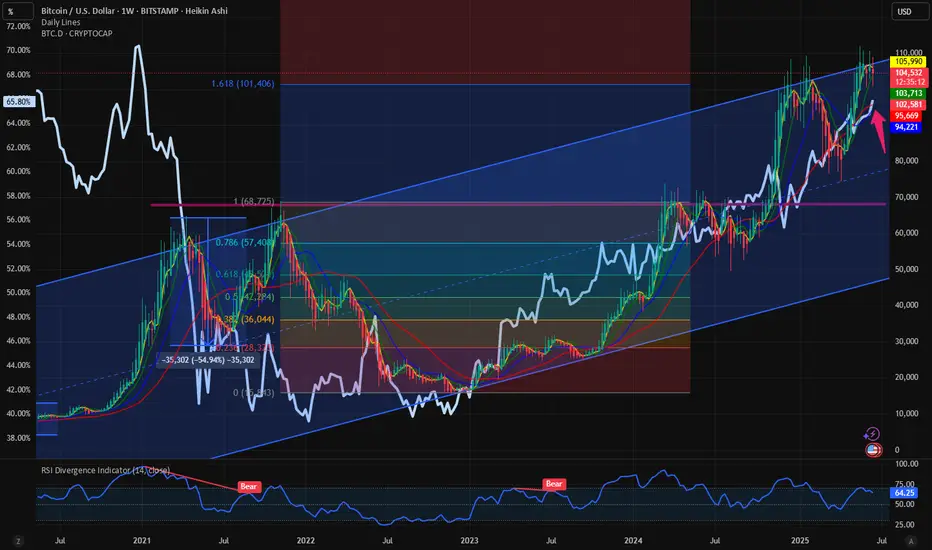
$BTC weathering the storm: $BTC.D close to 66%. $BTC to 160K. With all the volatility in the capital markets, Crypto is not immune to such swings. IN this space we have time and again analyzed the charts and have indicated that the best bet in the Crypto is to stay with CRYPTOCAP:BTC in these turbulent times. Even if CRYPTOCAP:BTC is above its previous cycle highs, this cannot be said about many altcoins like CRYPTOCAP:ETH , CRYPTOCAP:SOL , CRYPTOCAP:DOGE , CRYPTOCAP:LINK etc. A few days ago, on 15th June I wrote about the sloppy participation of CRYPTOCAP:TOTAL2 in case of an expanding $USM2.
CRYPTOCAP:TOTAL2 and ECONOMICS:USM2 : Correlation never broken. What now? for CRYPTOCAP:TOTAL2 by RabishankarBiswal — TradingView
Even if the ECONOMICS:USM2 is at an ATH CRYPTOCAP:TOTAL2 is still below its previous cycle highs. We asked the question what will CRYPTOCAP:BTC do if ECONOMICS:USM2 expands by 1-2T $. Even during the war and turbulent times CRYPTOCAP:BTC chart looks bullish as ever. It is still above its previous cycle highs; it is holding on to the psychological level of 100K $.
Now comes I think the most important chart in the crypto space is $BTC.D. The Dominance is currently above 65.5 %. Exactly here on 14th April we forecasted that CRYPTOCAP:BTC.D will go to 66%.
CRYPTOCAP:BTC.D to 66%, CRYPTOCAP:TOTAL2 / BTC down to 0.43 for CRYPTOCAP:BTC.D by RabishankarBiswal — TradingView
And again on May 20 I said the recent weakness in CRYPTOCAP:BTC.D is temporary and it will eventually reach 66%.
CRYPTOCAP:BTC.D : Have we seen the top or a local top in the CRYPTOCAP:BTC.D ? for CRYPTOCAP:BTC.D by RabishankarBiswal — TradingView
So where do we stand today. We are closer to 66% than to making a new local low. At 65.7% the path of least resistance is towards upside. And the USD valuation of CRYPTOCAP:BTC faces some resistance to breaking out of the upward sloping parallel channel which we have been following for the last few months. Currently the resistance level is 107K $ and we got rejected there.
Verdict : CRYPTOCAP:BTC.D goes to 66%. CRYPTOCAP:BTC consolidates here and 160K as Cycle top target.
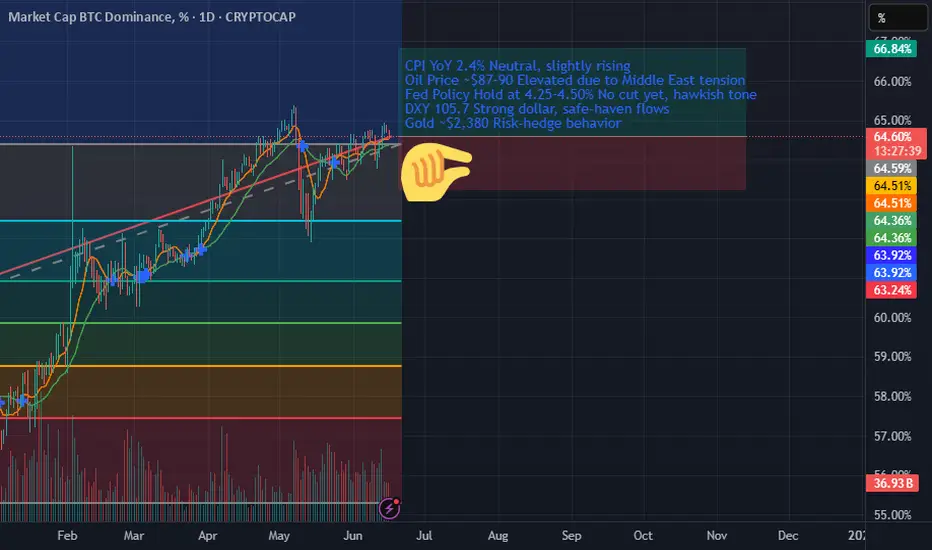
is this altseason? regardless the war? Oli? CPI? ...CPI must fall under 2.0%
Oil must retrace to the $70s
Fed must signal a real cut, not conditional pause
DXY must fall below 103
Until then, BTC remains the vault,
and the rest of the crypto market remains the graveyard.
Alts are complexity.
Ethereum is complexity.
Smart contracts are complexity.
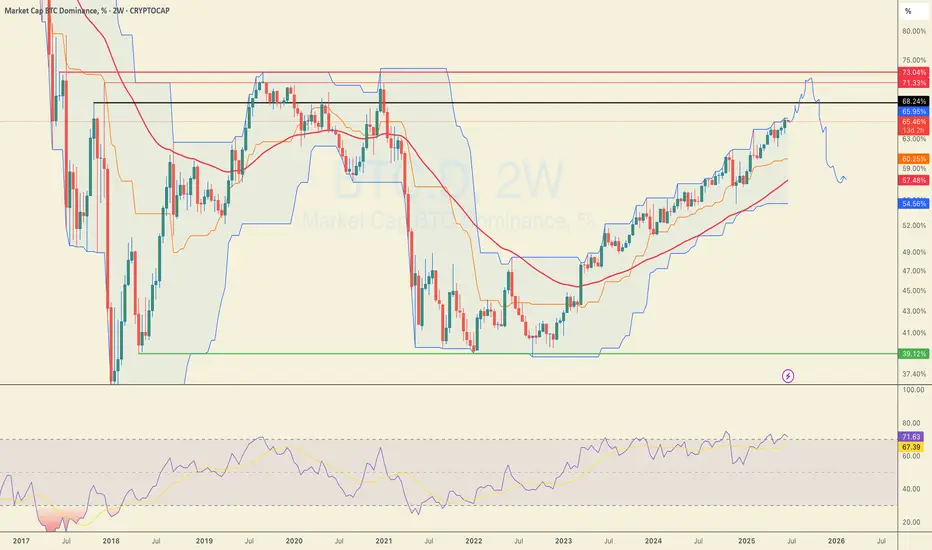
BTC.D - Could it be Wyckoff Distribution DevelopingJust toying with ideas of what may be developing here so dont take the chart as what i think will happen perfectly as shown.
With the strength seen from BTC.D atm, it looks more and more likely it may go for the highs again and into the higher levels above 65%.
I still see this as a very large range from the february high and lows that got put in and the prior high was a deviation of the larger range resulting in the reaction we seen.
We could expect to see a further deviation of the range highs and this wouldn't be uncommon in the development of a wyckoff distribution range.
Im still looking for a HTF reversal bearish from these supply levels and my bias doesnt change right now as we continue to develop this range until proven otherwise.
That being said, we could see some further weakness in altcoins until this tops out and gives us the right confirmations of a trend shift bearish.
1D:

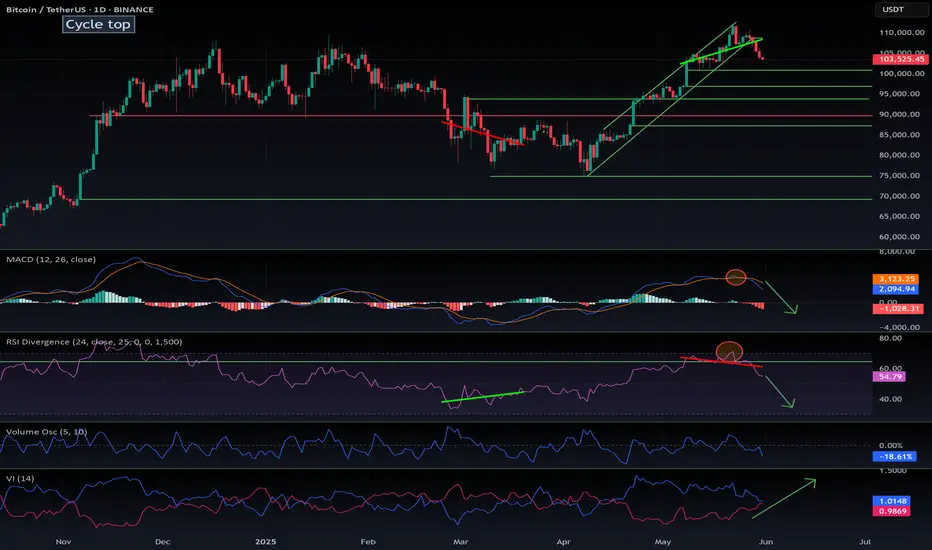
$BTC correction has just started. What is coming next?As I previously stated in my CRYPTOCAP:OTHERS , CRYPTOCAP:BTC.D , and CRYPTOCAP:TOTAL2 analysis — this move was expected. Check out my other ideas for more detailed breakdowns.
So, what’s happening?
Bitcoin maximalists have been buying heavily at the top, right when RSI and MACD were in overbought territory, creating a clear bearish divergence.
Something Saylor and others seem to ignore: you can't defy mathematics — what needs a correction will correct.
CRYPTOCAP:BTC still looks bullish on the weekly timeframe, so we’re not entering a bear market. However, the pump is over, key supports have broken, and altcoins are correcting — some by -25% in a single day.
Purely from a charting perspective, we can identify multiple potential support levels for CRYPTOCAP:BTC :
$101K, $94K, $89K, $87K, with a lower-probability retest down to $75K.
We’re likely entering a 2-week correction, after which CRYPTOCAP:BTC could resume its uptrend — potentially closing June at a new all-time high.
DYOR.
#Bitcoin #BTC #Altcoins #CryptoCrash #TechnicalAnalysis #BTCdominance #TOTAL2 #BearishDivergence #Saylor #RSI #MACD #ATH #DYOR
TradeCityPro | Bitcoin Daily Analysis #116👋 Welcome to TradeCity Pro!
Let’s dive into the analysis of Bitcoin and the key crypto indices. As usual, I’m going to review the futures triggers for the New York session.
✅ Yesterday, a very important event occurred: Israel launched a military attack on Iran, targeting not only military facilities but also residential areas.
⚔️ Leaving aside the fact that war is always a global tragedy, the fact that Israel also hit civilian zones shows that the tensions between these two countries have entered a new phase.
💫 In addition to civilian casualties, key commanders of the Iranian military were assassinated in these strikes.
🏳️ Most countries such as the United States, France, and most of Europe supported Israel in this conflict, while only North Korea and Russia backed Iran.
📊 Given these rising tensions and the cancellation of Sunday’s negotiations between Iran and the U.S., the likelihood of war between Iran and Israel has greatly increased following the resolution signed yesterday.
⭐ This development has caused safe-haven assets like gold to move upward, while risk-on assets like crypto have started to decline. As you can see, Bitcoin has been falling since yesterday.
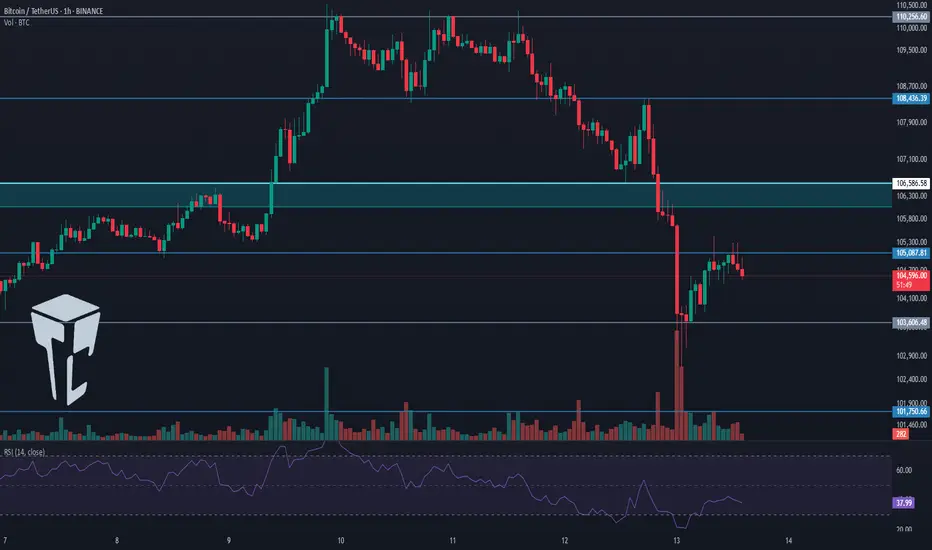
⏳ 1-Hour Timeframe
On the 1-hour chart, as mentioned, after an initial correction to the 108436 zone, Bitcoin continued its decline down to 103606, breaking through the support level we had marked due to the war-related news.
✨ Currently, the price has found support at 103606 and has started a corrective phase. RSI has also exited the Oversold area and is now heading toward the 50 zone.
📉 In my opinion, under the current market conditions, we should wait to see how Iran reacts to Israel's actions. If war breaks out, Bitcoin is likely to drop again.
⚡️ Personally, I’m holding off on opening any positions until we get more clarity on the fundamental developments between Iran and Israel. I'm also not closing any of my longer-term positions that were opened in lower zones like 88k.
🔔 However, if you are looking to open a position, you could enter on a break below 103606. I don’t currently have a trigger for a long position and would prefer to wait for a proper structure to develop.
👑 BTC.D Analysis
Bitcoin dominance moved upward along with the market decline and, after breaking through 64.18, continued its bullish leg up to 64.85.
🧩 It has since begun a corrective phase after hitting that resistance. If this correction continues, the next zone to watch is 64.49.
📅 Total2 Analysis
This index also dropped alongside Bitcoin yesterday, falling from 1.18 down to 1.12 after triggering a short.
🔍 The price has since corrected up to 1.14. If a new bearish leg begins, we can open a short position on a break below 1.12.
📅 USDT.D Analysis
Tether dominance moved upward after triggering 4.68 and reached 4.89.
💥 If 4.79 is broken, the correction could continue. If 4.89 is broken, the next bullish leg in dominance will begin.
❌ Disclaimer ❌
Trading futures is highly risky and dangerous. If you're not an expert, these triggers may not be suitable for you. You should first learn risk and capital management. You can also use the educational content from this channel.
Finally, these triggers reflect my personal opinions on price action, and the market may move completely against this analysis. So, do your own research before opening any position.
TradeCityPro | Bitcoin Daily Analysis #115👋 Welcome to TradeCity Pro!
Let’s dive into the analysis of Bitcoin and the key crypto indices. As usual, I’ll be reviewing the futures triggers for the New York session.
⏳ 1-Hour Timeframe
On the 1-hour chart, as you can see, yesterday the price was rejected from the 110256 level I previously mentioned. Following that, with the activation of the 108617 trigger, Bitcoin experienced a downward leg.
📊 Personally, I didn’t open a short position after the break of that level, but if you did, I suggest taking profits now as the price has reached the marked support zone.
🔍 As for me, I’ll wait to see how the price reacts to this support. If it breaks down, we can open a short position.
📈 However, if the price finds support here, we can once again look for a long position. The trigger for this will be found in the lower timeframes.
👑 BTC.D Analysis
Let’s move to Bitcoin dominance. Yesterday, BTC.D made a pullback to the 64.18 zone and now seems ready for another drop.
✔️ If 63.96 breaks, BTC.D could enter another bearish leg. If instead, the 64.18 ceiling breaks, it could push up toward 64.49 or even 64.67.
📅 Total2 Analysis
Looking at the Total2 index, after reaching 1.24 yesterday, it started to correct and dropped down to 1.18, touching the support with a shadow.
✨ If the 1.2 level breaks to the upside, the price could move back toward 1.24. If 1.18 breaks down, the correction may continue further.
📅 USDT.D Analysis
Now onto USDT.D. After a brief correction up to the 4.68 level, it has resumed its downward movement. If 4.64 breaks, the decline could extend toward 4.56.
💥 If instead, the 4.68 top breaks, it might bounce back up toward 4.72.
❌ Disclaimer ❌
Trading futures is highly risky and dangerous. If you're not an expert, these triggers may not be suitable for you. You should first learn risk and capital management. You can also use the educational content from this channel.
Finally, these triggers reflect my personal opinions on price action, and the market may move completely against this analysis. So, do your own research before opening any position.
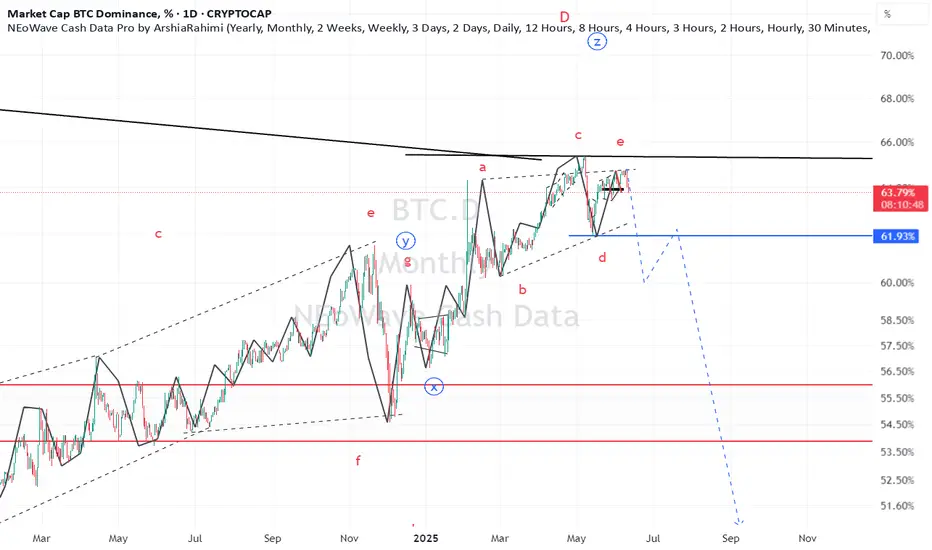
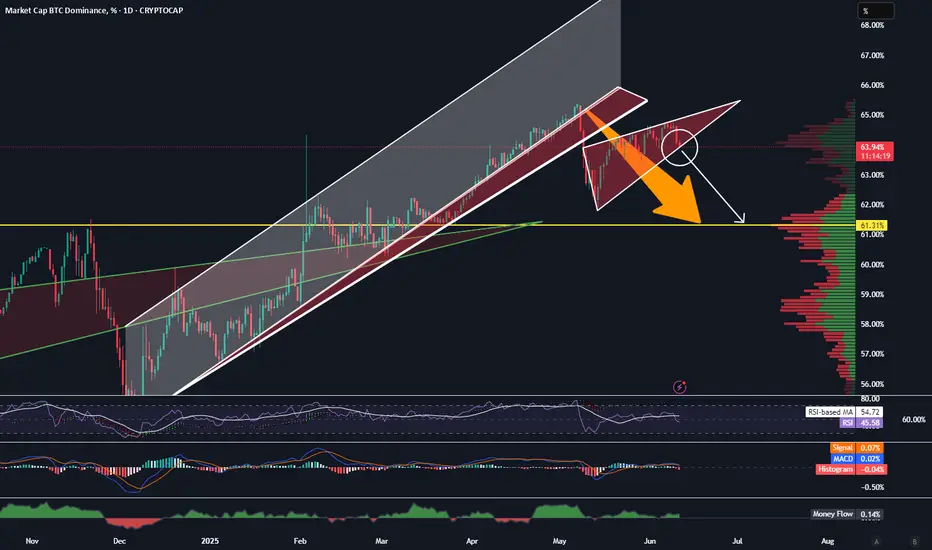
BTC.D(based one NEowave)the Z wave of this branch shown as a triangle and I think its finished but for confirmation breaking the 61.9 is important.
its a green light of Altseason.
Bitcoin Dominance Will Drop To 60% SoonGood Morning Trading Family,
I really don't have much to say on this post. My last post on Ethereum showed us an inverse head and shoulders pattern, which plays out over 85% of the time. This is a clear sign that altcoins may rally within the next week or two. And here, on our Bitcoin dominance chart, you can see that the patterns are clear, BTC dom cannot last at this level much longer before a breakdown to 61% or lower occurs. Be prepared. FOMO will get real.
Best,
Stew
TradeCityPro | Bitcoin Daily Analysis #114👋 Welcome to TradeCity Pro!
Let’s go over Bitcoin analysis and the key crypto indexes. As usual, I’ll break down the futures triggers for the New York session.
⏳ 1-Hour Timeframe
On the one hour timeframe, as you can see, a trading range has formed between the levels of 108617 and 110256. This has happened after a strong upward move with significant buying volume, and now we’re in a market correction phase.
📊 Market volume is decreasing during this corrective phase, which shows the strength of the buyers and supports the ongoing uptrend. RSI has exited the Overbuy zone and is now cooling off, which indicates that the bullish momentum has weakened for now.
📈 For a long position, the 110256 trigger seems very suitable today. If the price forms a higher low above 108617 before breaking this level, the probability of breaking 110256 increases significantly.
💥 If this trigger is activated, it’s crucial that volume rises as well. That would confirm the strength of the trend and increase the chances of the uptrend continuing. The current target for this position is 111747.
🔽 In the correction scenario, if the price stabilizes below 108617, this scenario becomes more likely and a deeper correction could follow.
✨ Personally, I won’t open a short position unless we get confirmation of a trend reversal. But if you want to go short, a break below 108617 is not a bad option and could signal a downward move.
👑 BTC.D Analysis
Bitcoin dominance has continued its downward movement, stabilized below 64.12, and is now heading toward 63.93.
⭐ If the 63.93 low is broken, the bearish move in dominance will likely continue. If it pulls back, a break above 64.12 will confirm that retracement.
📅 Total2 Analysis
Let’s look at Total2. Yesterday, it broke through the 1.2 level and is now moving toward 1.24. A breakout above this level could start the next bullish leg.
🎲 If a correction occurs, the price may drop back to 1.2 or even 1.18.
📅 USDT.D Analysis
Now for Tether dominance. This index is still sitting at the 4.56 support and is currently being held there. If 4.56 breaks, the next bearish leg can form.
🔔 In case of a retracement, USDT dominance might rise to 4.64.
❌ Disclaimer ❌
Trading futures is highly risky and dangerous. If you're not an expert, these triggers may not be suitable for you. You should first learn risk and capital management. You can also use the educational content from this channel.
Finally, these triggers reflect my personal opinions on price action, and the market may move completely against this analysis. So, do your own research before opening any position.