Narrative of growing interest in BTC is nonsenseOver the past two months, Bitcoin’s volatility and volume have diminished significantly, which hardly supports the bullish narrative about the growing interest in Bitcoin. At the same time, active addresses holding Bitcoin dropped from 5 165 158 on 7th November 2022 to only 4 585 372 on 26th December 2022 (based on the information obtained from Glassnode), suggesting that people are holding their coins rather than buying more of them. In addition to that, attempts by several countries like Brazil and Nigeria to move closer toward designating cryptocurrencies as legal tender had no impact on the market whatsoever.
That brings us to one rudimentary question in the highly speculative market (the one we already asked before) “If everyone is holding their Bitcoin and waiting for the price to go up so they can sell, who will push the market higher?”. This question is very troubling, considering that the global economy is poised to dive deeper into recession in 2023, and average investors are set to run out of savings due to growing prices of consumer goods and services (due to high inflation, which is here to stay). In fact, we expect many of these people to be forced to sell their holdings later. Furthermore, with no stimulus check handed to people from the U.S. government, we do not expect Bitcoin to repeat its success between 2020 and 2021 (at least not so soon, if ever).
Contrarily, we expect much more pain for the overall cryptocurrency market and new lows to be formed in Bitcoin within the next month or two. With that said, we will pay close attention to the FED’s narrative and efforts of central banks (globally) to take on their own CBDC (Central bank digital currencies), which may threaten Bitcoin down the road. Accordingly, we stay bearish on the cryptocurrency market and maintain our price targets of 15 000$ and 13 000$.
*See attached articles to view our calls since proposing the idea of a double top in November 2021.*
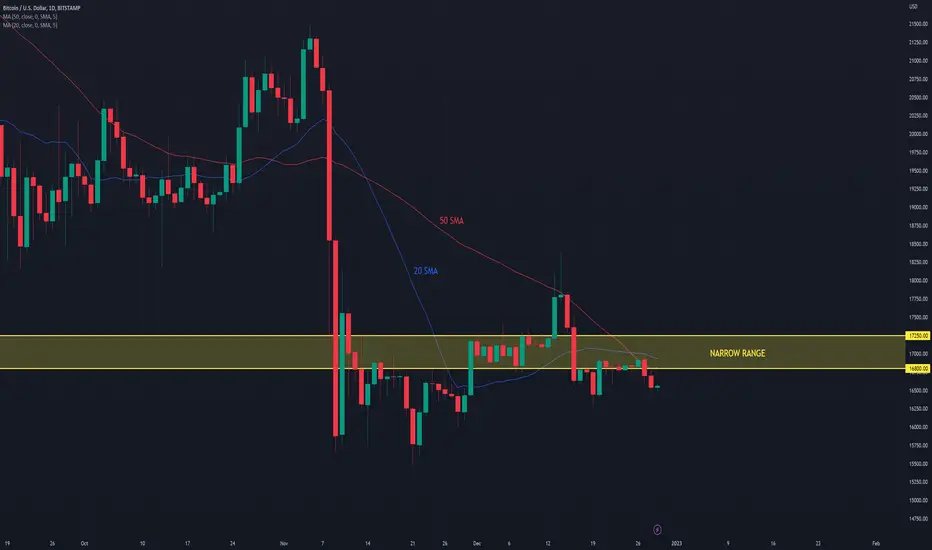
Illustration 1.01
Illustration 1.01 shows the daily chart of BTCUSD and the active setup. Yellow arrows indicate breakouts above and below the narrow range.
Technical analysis
Daily time frame = Slightly bearish
Weekly time frame = Neutral
Illustration 1.02
The picture above illustrates the weekly chart of BTCUSD. The red arrow shows declining volume since early November 2022, which hardly supports the bullish narrative and growing interest in Bitcoin.
Please feel free to express your ideas and thoughts in the comment section.
DISCLAIMER: This analysis is not intended to encourage any buying or selling of any particular securities. Furthermore, it should not be a basis for taking any trade action by an individual investor. Therefore, your own due diligence is highly advised before entering a trade.
BTCEUR

Bearish breakout, increasing volume, and no capitulation yetBitcoin dropped below the lower bound of the narrow range, bolstering the bearish odds. Simultaneously, volume started to pick up, hinting at increasing selling pressure. In addition to that, the price dropped below 20-day SMA and 50-day SMA; ideally, we would like to see a crossover between these two moving averages, which would further confirm the downtrend. As for our stance, we remain bearish and maintain our price targets at 15 000$ and 13 000$. Our views are based on a combination of technical and fundamental factors. We expect the persistence of tight monetary policy to weigh on the stock market, which is highly correlated with cryptocurrencies. As a result, more stock market weakness will negatively affect Bitcoin and drag it lower over time.
This thesis is also supported by the market sentiment, which does not show signs of capitulation. Contrarily, too many market participants still try to catch the bottom and leverage up in this so-called “lifetime” opportunity. However, we think these investors are making their moves prematurely and will likely get washed out in the next wave of selling, enforcing even stronger selling pressure down the road. Furthermore, as if it was not enough, cryptocurrency-related institutions continue to experience issues, opening the question of what company will fall victim to the bear market next. Because of that, we voice a caution to the market participants and dismiss an overly bullish narrative in the cryptocurrency market.
Illustration 1.01
Illustration 1.01 displays the daily chart of BTCUSD. Yellow arrows indicate breakouts above and below the narrow range.
Technical analysis
Daily time frame = Slightly bearish
Weekly time frame = Neutral
Please feel free to express your ideas and thoughts in the comment section.
DISCLAIMER: This analysis is not intended to encourage any buying or selling of any particular securities. Furthermore, it should not be a basis for taking any trade action by an individual investor. Therefore, your own due diligence is highly advised before entering a trade.
BTCEUR 'D' - One Level of Support left Before 30% Cliff EdgeHey guys - There's a few things going on here:
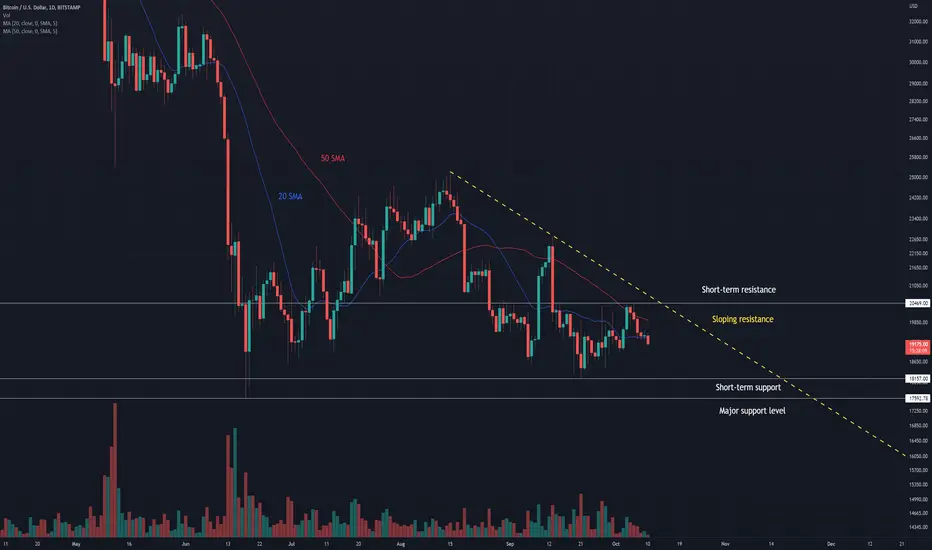
We've got a strong Sell signal from Crypto Tipster v2, combined with a descending trend line which the price has touched quite a few times historically and rebounded on the downside each time so far.
This combined with several layers of resistance above and only one (albeit quite strong) level of support on the underside could mean the potential for a further fall in Bitcoin price.
Seems unlikely, or at least unwanted - but the reality is if this level of support gets broken, there's not to stop the price free-falling 30% or more to around the $10,000 mark. Let's all keep watch on this one!
What do you guys think?

Bitcoin bottom look like is closerBitcoin is creating falling wedge pattern maybe these movements will happend.
I waiting btc to reach 17500 again and short it until reach 13500 in this scenario i belive 13500 can be bottom for bitcoin.
From 13500 i will long for next 6.
I wish you all the best.

BTCUSDT - Wyckoff Method Bottom FinderHi Traders, Investors and Speculators 📈📉
Ev here. Been trading crypto since 2017 and later got into stocks. I have 3 board exams on financial markets and studied economics from a top tier university for a year. Daytime job - Math Teacher. 👩🏫
A quick look at BTCUSDT from a macro perspective. It seems likely that Bitcoin needs to find a lower bottom where the demand zone is strong enough to stabilize the price. Currently, the volatility in the market may seem like it's bullish, but if you zoom out you can clearly see lower highs which is a benchmark for a bearish cycle. The price action is currently trading in the distribution phase of the Wyckoff Method market cycles, and we still need to establish a clear bottom followed by a period of sideways/range trading.
This was an earlier proposed bottom for BTC by using the Wyckoff Method:
Although my timelines were off, we can clearly see that the price action has not yet entered the final phase of the cycle and is still in a downtrend.
Remember, there are lots of other great opportunities in the markets during December that could make for a better trade setup as opposed to BTC.
Interested in stock markets? Check out this idea on SPX where I cover Apple Inc. , MSFT and AMZN :
_______________________
📢Follow us here on TradingView for daily updates and trade ideas on crypto , stocks and commodities 💎Hit like & Follow 👍
We thank you for your support !
CryptoCheck


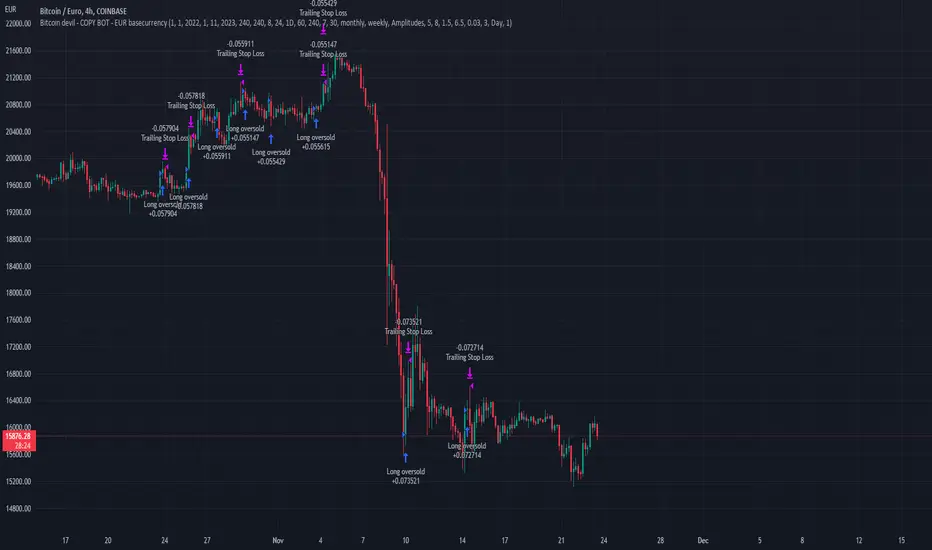
Bitcoin devil - COPY BOT / EUR base currency / BTC/EUR=== Time window ===
01 / 01 /2022 - 23 /11/2022
=== Example settings ===
Initial capital = 5000 EUR
Stop loss = 5%
Trailing percentage = average amplitude of weekly price movement
Arm Trailing = standard deviation of amplitude
sell based on strategy = Disabled
DCA = Disabled
Cool down = 1 Day
=== Base currency ===
EUR
=== Disclaimer ===
All strategies and templates presented by Bitcoin devil are created and optimized to aim at maximum profits. However, always preform your own research and risk assessment. Our backtest results are only meant to give an indication about the performance of the strategy. Past performance does not guarantee future results. Use our products at your own risk. Bitcoin devil is not a financial advisor and not responsible for any losses. Before purchasing any of our products or services please inform yourself with the Terms and Conditions on our website.
BTC short setupPlease 1st of all click the boost 🚀 button if you want me to post more ideas and follow me to support my work! It's absolutely free of charge.
Crypto bears having the upper hand and there are many reasons why you shouldn't be bullish yet. For example this...
...or this (check also the other ideas from this series)...
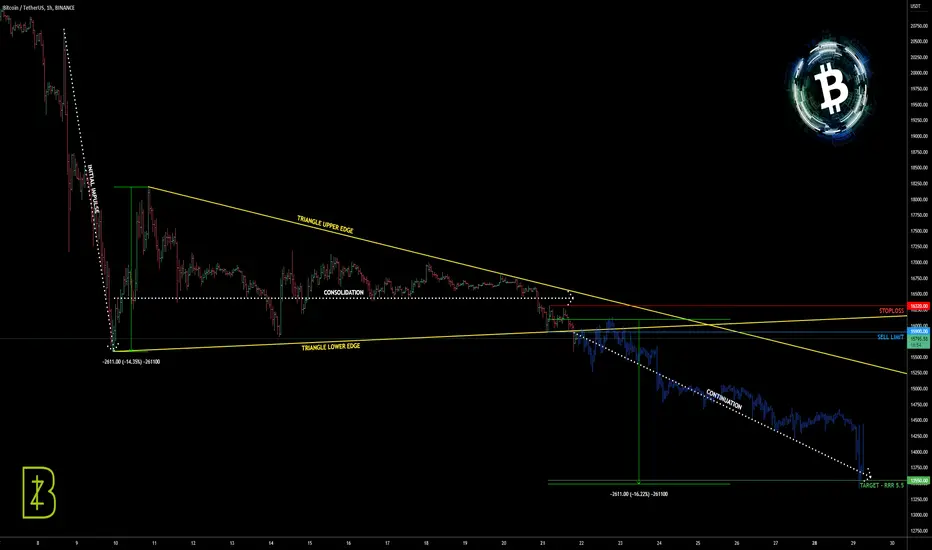
But now back to this current idea. After the brutal sell-off (initial impulse; FTX bankruptcy) ₿itcoin recently consolidated in form of triangle. Now price seems to breaking out this triangle📐 and I think there is chance for run to 13550 and even lower. Setting SELL LIMIT order to previous range low to catch🎣 the pullback (backtest of the triangle lower edge).
ENTRY : local low @ 15900
STOPLOSS (SL) : local high @ 16320
TARGET (TP) : height of the triangle projected from midpoint of the local range (SELL LIMIT - STOPLOSS) @ 13550
REWARD RISK RATIO (RRR) : 5.5
INVALIDATION : when SL level hit
Check my other stuff in related ideas.
Please boost🚀, comment🗣️, follow me✒️, enjoy📺!
⚠️Disclaimer: I'm not financial advisor. This is not a financial advice. Do your own due dilingence.
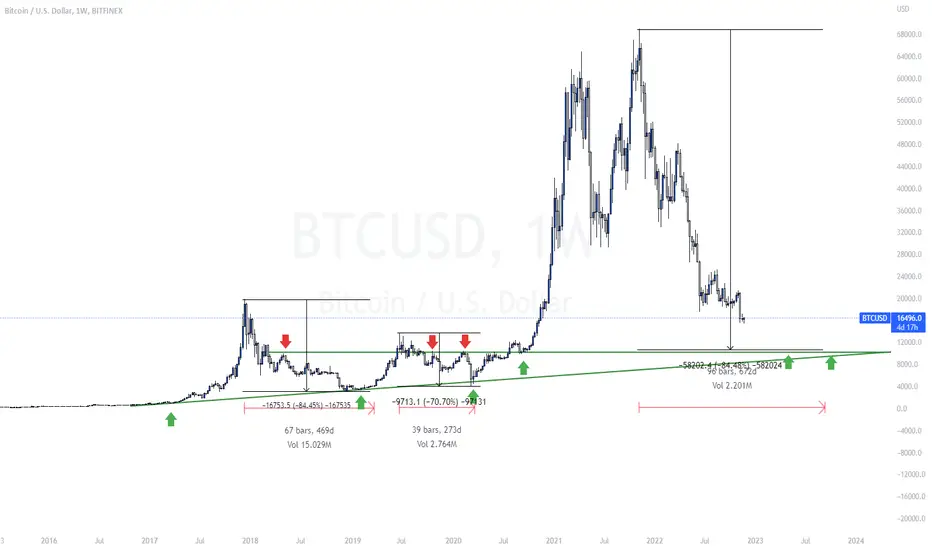
BTC - Brief historical analysisBrief historical analysis
Since 2018, bitcoin has declined three times.
The first time the drop was 84% and lasted 470 days
The second time the fall was 71% and lasted 273 days
At the moment, the fall is 76% and lasts 378 days, if the fall is 84%, as in the first fall, then the price will reach 10500.
I think it's pretty obvious that Bitcoin is correlated with the Nasdaq Index and so it's worth mentioning what's in store for us in the stock market and what's in store for Bitcoin.
So, the Federal Reserve System (FRS), acting as the central bank of the United States, raised the rate by 75 basis points - from 3-3.25% to 3.75-4%, which is the highest level since January 2008. It is expected that following the meeting on December 13-14, rates will be increased by 50 basis points. Inflation in the US is 7.7%. The goal is to raise rates to bring inflation down to 2%. To what level the Fed will raise the rate is not known.
In addition, the ECB raised all three key interest rates by 75 bp in October. The base interest rate on loans was increased to 2%, the rate on deposits - up to 1.5%, the rate on margin loans - up to 2.25%. Experts expect the ECB to raise the loan rate to at least 2% from 1, 5% in December.
It is a well-known fact that an increase in the rate will lead to a recession and already in the 1.2 quarter of 2023 the consequence will be a decrease in company income, an increase in unemployment, there is already a sharp drop in demand for mortgages, car loans, and these are the main drivers of the economy and another global crisis is not ruled out.
The Fed and ECB may start cutting rates at some point next year, but only if a combination of factors materializes, including rising unemployment, lower inflation and some kind of breakdown in the financial markets, and only after the Fed and ECB cut rates, after a certain period of time, when it will be seen that there will be a long accumulation of positions in bitcoin, it will be possible to say that a bull market is beginning. It is not worth waiting for the beginning of the bull market for the cue ball until mid-2023.
As an investment, of course, an excellent entry point at a strong weekly support level is 10500, and before that it is better to trade in channels with confirmation of entry points and wait for the market to turn.
BTC: 5 bearish reasons (3/5)*log scale*
Hi all! Why do I think the crypto bear market is not over yet? Keep reading...
This is serial of 5 BTCUSD ideas (with 5 bearish agruments) released one after another one at a time after reaching following criterions: This idea needs to get at least 30 likes (just click the 🚀 button) and 20 comments (mine included, just say "thanks" whatever) in order to "unlock" the next idea which I will publish (also here in comments) once the criteria are met and as soon as I can.
2nd post of the series met the criteria, so now let's move on!
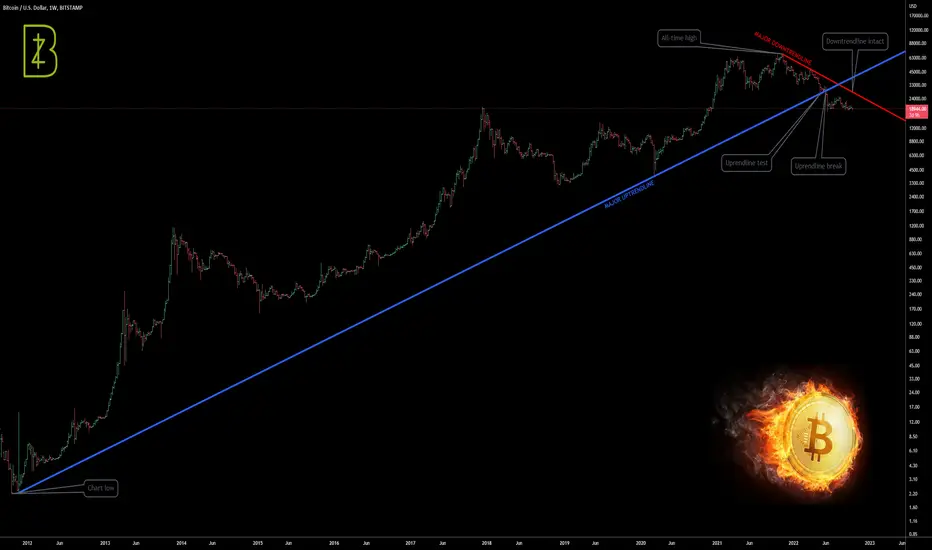
REASON #3: Trendlines
This is weekly chart of all available BTC data on BITSTAMP, which I think is the longest BTCUSD history here on TV. If I'm wrong, please let me know.
This major uptrendline drawn from the low on logarithimic chart has been broken while the major downtrendline (starting from ATH) still remains intact (zoom in to see it better), so we should assume downtrend as long as the downtrendline holds. It's just that simple, don't overcomplicate things. If drawn correctly the trendlines are one of the most powerfull tools of Technical Analysis. Forget lagging moving averages.
What do you think? Boost and comment in order to "unlock" the next (4/5) BTC bearish reason! Cheers!
Check my other stuff in related ideas.
Please boost🚀, comment🗣️, follow me✒️, enjoy📺!
⚠️Disclaimer: I'm not financial advisor. This is not a financial advice. Do your own due dilingence.
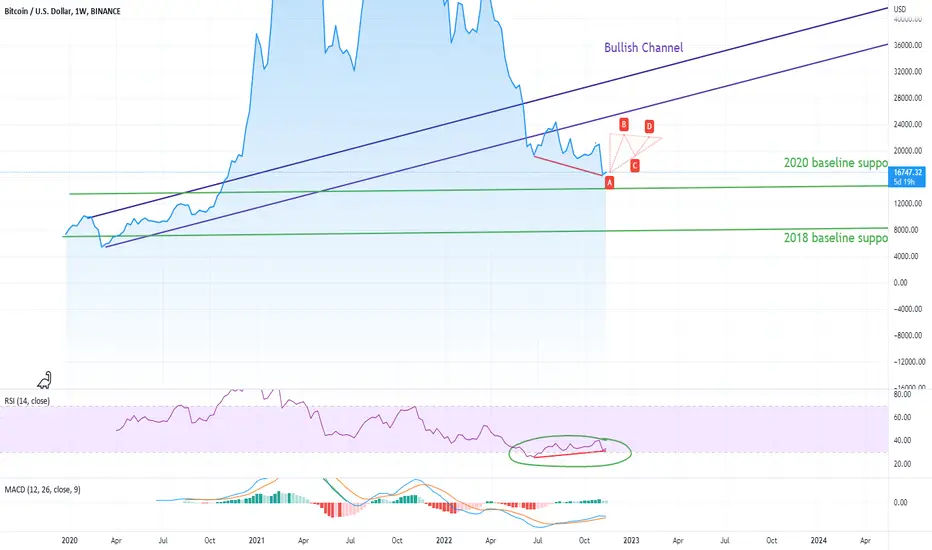
Bitcoin and rest of the market in accumulationHi guys lots of mixed signals going around the market at the moment ,which generally indicates big investors wanting to buy in at a cheap price
as it shows we have already hit the bear market bottom and through some TA and FA we can make a call that our position is long
-RSI has a hit a strong oversold region and is also indicating a strong bullish divergence in the 4 monthly
-Market cap has hit the top of the 2018 market and therefore the bottom cap for the 2022 of 850bil
-Overall volume is indicative of Huge amounts of oversells leaving bears liable for long positions within 4-8 month positions
overall expect all short positions in the next 6 months to get absolutely lit up current volume depth is growing
alt market will be prime for yearly long positions entrys right now with most coins being able to 4-8x within the next bull market.
Bitcoin - The market is poised to go SouthTwo days ago, we projected the downward sloping channel on the daily chart of BTCUSD. Since then, the price broke to the upside and retraced back to the channel, increasing the upper bound's significance (and again validating the pattern). Meanwhile, the market sentiment started to turn bearish, with many market participants giving up on hopes of the FED's pivot. As we also do not believe the FED will backtrack on its monetary policy in 2022, we think the mood is set to turn very grim in the month of September.
Because of that, we will pay close attention to the FED's decision on the 21st September 2022. We expect the FED to raise interest rates from 50bps to 75bps, which will negatively affect the economy. As a result, we think the risk-on appetite will deteriorate and lead to high selling pressure. However, we will update our thoughts on that before the meeting.
In terms of other fundamental factors, we see mounting evidence that the world has entered a global recession, with many real economies starting to feel it. Moreover, with central banks around the globe pursuing the destruction of demand, we think the evidence over the coming months will be even more apparent.
Meanwhile, technical factors also point to the downside across various sectors; and across daily, weekly, and monthly time frames. That bolsters our bearish conviction and makes us stick to our price targets at 17 500 USD and 15 000 USD. However, we think the cyclical low might lie far below our price targets. Again, though, we will reassess our thoughts as the trend unravels.
Illustration 1.01
Illustration 1.01 shows the most recent technical developments on the daily chart of BTCUSDT. Yellow arrows indicate two bearish breakouts below prior support levels, a bearish crossover between 20-day SMA and 50-day SMA, and a bullish breakout above the channel followed by the retracement. Additionally, the green arrow indicates increasing volume, which is ideal for confirming our bearish thesis. Now, we will pay close attention to the price action; ideally, we would like to see it take out its recent low at 19 510 USD.
Technical analysis - daily time frame
RSI, MACD, Stochastic, DM+, and DM- are all bearish. Overall, the daily time frame is bearish.
Illustration 1.02
Illustration 1.02 shows the daily chart of BTCUSD. Additionally, several bearish developments are indicated by yellow arrows. Declining and increasing volume is shown by red and green arrows. We would like to see a breakout below the immediate support to confirm our bearish thesis.
Technical analysis - weekly time frame
RSI, MACD, Stochastic, DM+, and DM- are all bearish. Overall, the weekly time frame is bearish.
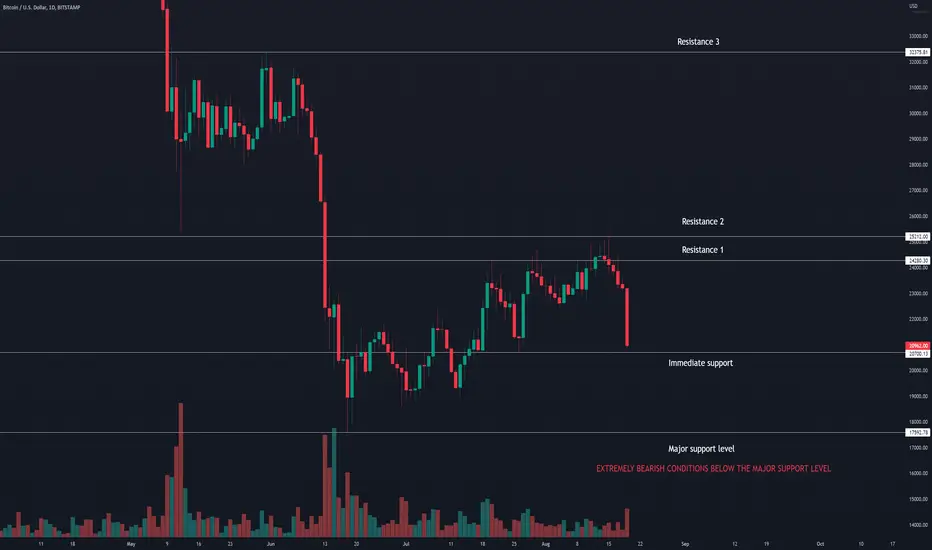
Illustration 1.03
The chart above shows simple support and resistance levels for BTCUSD; for this pair, the low needed to be taken out is 19 526 USD.
Please feel free to express your ideas and thoughts in the comment section.
DISCLAIMER: This analysis is not intended to encourage any buying or selling of any particular securities. Furthermore, it should not be a basis for taking any trade action by an individual investor. Therefore, your own due diligence is highly advised before entering a trade.

Bitcoin - No longer bullish, top in for the rally During the last week, we gave market participants an ultimate warning about the impending reversal in the market. Soon after we argued the top of the bear market rally might be in, Bitcoin fell more than 15%.
A change in our short-term view is mainly influenced by technical factors, which point to the return of intense selling pressure. Indeed, we believe the current selloff will soon escalate into panic mode in the cryptocurrency sector. As a result, we expect highly elevated volatility and Bitcoin to drop to a new low.
Our medium-term and long-term views remain unchanged as we expect bearish fundamental factors to stay persistent throughout 2022 and 2023. Additionally, we believe that the recession will bring risk-off sentiment, wreaking chaos in the stock market as well as the cryptocurrency market.
Because of these reasons, and the ones described in our previous ideas, we stick to our price targets at 17 500 USD and 15 000 USD.
Illustration 1.01
The picture above shows two bearish breakouts below prior support levels. Additionally, a build-up in volume accompanying a price drop is indicated on the bottom; this development is the ideal picture we wanted to see in order to confirm our bearish thesis.
Technical analysis - daily time frame
RSI is very bearish. MACD and Stochastic are bearish. DM+ and DM- performed bearish crossover. Overall, the daily time frame is very bearish.
Illustration 1.02
Illustration 1.02 shows another bearish breakout below the sloping support, further bolstering the bearish case for BTCUSD.
Technical analysis - weekly time frame
RSI, MACD, Stochastic, DM+, and DM- are all bearish. Overall, the weekly time frame is bearish.
Illustration 1.03
Above is the setup we introduced recently.
Please feel free to express your ideas and thoughts in the comment section.
DISCLAIMER: This analysis is not intended to encourage any buying or selling of any particular securities. Furthermore, it should not be a basis for taking any trade action by an individual investor. Therefore, your own due diligence is highly advised before entering a trade.
Bitcoin - BTCUSD is headed to new lows!Over the weekend, Bitcoin's deceitful price action left many bulls hoping for a bounce on a Monday. Indeed, many analysts rushed to forecast another bottom and continuation of the rally, basing their calls merely on little gains during Saturday and Sunday. However, right after the futures market opened, Bitcoin and other cryptocurrencies quickly erased their early gains.
At this point, Bitcoin erased approximately half of its recent rally. It is currently down about 17% from its peak on 15th August 2022 (when we argued that the top of the bear market rally was in). Today, we maintain the same notion and are extremely bearish in the short term. Indeed, several technical developments support our opinion and point to the impending acceleration of the selloff.
As for the medium-term and long-term outlook, fundamental factors like higher interest rates, quantitative tightening, and the global economy slowing down do not allow us to change our bearish view.
Now, we will pay close attention to the support level at 20 700 USD. If it is broken to the downside, that will further bolster the bearish case for BTCUSD. Additionally, we will watch a volume level; ideally, we would like to see more build-up in it, accompanying further price drop.
In accordance with our outlook, we maintain price targets for BTCUSD at 17 500 USD and 15 000 USD.
Illustration 1.01
Illustration 1.01 shows our assessment of particular price levels and how bearish they are. Yellow arrows indicate developments we used as confirmations for our thesis. The green arrow shows an ideal picture of volume and what we would like to see occur again.
Technical analysis - daily time frame
RSI is very bearish. MACD and Stochastic are bearish. DM+ and DM- is bearish too. Overall, the daily time frame is very bearish.
Illustration 1.02
Illustration 1.01 shows another bearish breakout that helped us to assess BTCUSD.
Technical analysis - weekly time frame
RSI, MACD, Stochastic, DM+, and DM- are all bearish. Overall, the weekly time frame is bearish.
Please feel free to express your ideas and thoughts in the comment section.
DISCLAIMER: This analysis is not intended to encourage any buying or selling of any particular securities. Furthermore, it should not be a basis for taking any trade action by an individual investor. Therefore, your own due diligence is highly advised before entering a trade.

BITCOIN - Similar To December 2018 ?Hi Traders, Investors and Speculators 📈📉
Ev here. Been trading crypto since 2017 and later got into stocks. I have 3 board exams on financial markets and studied economics from a top tier university for a year. Daytime job - Math Teacher. 👩🏫
This is not the longest that BTCUSDT has been trading underneath the Moving Average. During December 2019 until the next year, BTC spent 36 WEEKS underneath the Moving Averages. Noteworthy that this was the 50d MA (due to the lack of data, there was no 100d or 200d). Currently, we're trading underneath the 200d MA. However, this can still signify that range trading for a period of time may be the most likely scenario. We still see high volume on the chart and the RSI shows sideways to slightly lower is the most probable for the foreseeable future. USUALLY (not always) there is a Xmas rally, or a December rally. It should be interesting to see if we find our reversal during the month of December, or if we continue to decline and start another bullish cycle during Q1 next year in 2023.
I'm labeling this BTC post as short even though I don't believe shorting it is a good idea right now, simply because it seems more likely for the price to go slightly lower than higher (judging by the RSI). There will be the occasional, unpredictable wick back up towards the MA but the price will continue to trade underneath until a clear bottom is established.
Incase you're interested in XRPUSDT, check out this idea 👀
Have a great weekend🥂
_______________________
📢Follow us here on TradingView for daily updates and trade ideas on crypto , stocks and commodities 💎Hit like & Follow 👍
We thank you for your support !
CryptoCheck

UPDATE -BTCUSDT 1 Week
This is the update of my previous post, I'm waiting for it to come back with Bullish Cypher at 19.700 level:
Not a financial advice.

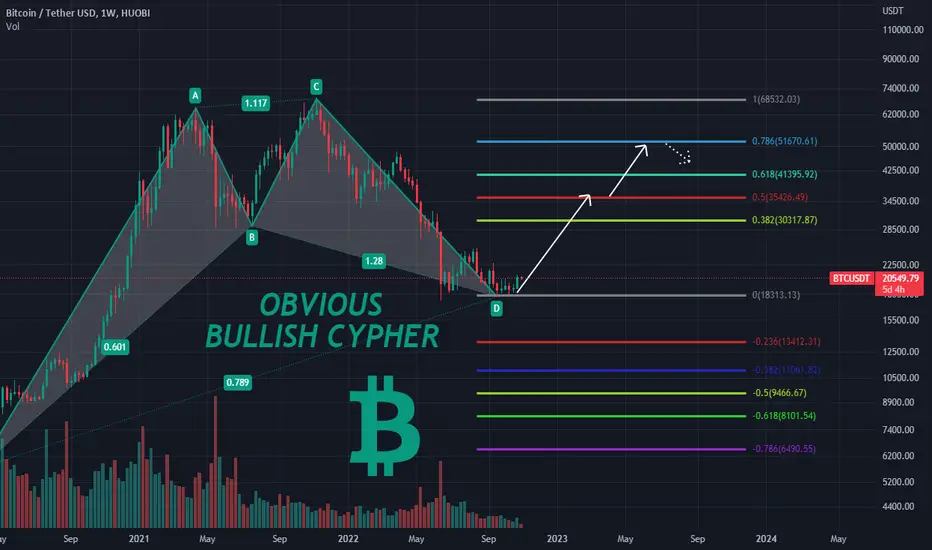
OBVIOUS BULLISH CYPHER - DON'T MISSOBVIOUS BULLISH CYPHER - DON'T MISS
I think price will go up to 0.786 but no further. Main pump will come 2 years after, with halving.
Not a financial advice, do your own research.
Fractal, Weekly-2H Chart Almost Same !This is a fractal work. Expecting price going for 19800 ish.
Not a financial advice.

Bullish thesis for BTCThe last couple of months seems to have invalidated my previous idea, I'm inclining more towards this one.
BTCUSD will make a new low,
BTCEUR will not and probably mark the bottom.
Be safe.

BTC: 5 bearish reasons (2/5)Hi all! Why do I think the crypto bear market is not over yet? Keep reading...
This is serial of 5 BTCUSD ideas (with 5 bearish agruments) released one after another one at a time after reaching following criterions: This idea needs to get at least 30 likes (just click the 🚀 button) and 20 comments (mine included, just say "thanks" whatever) in order to "unlock" the next idea which I will publish (also here in comments) once the criteria are met and as soon as I can.
1st post of the series met the criteria, so now let's move on!
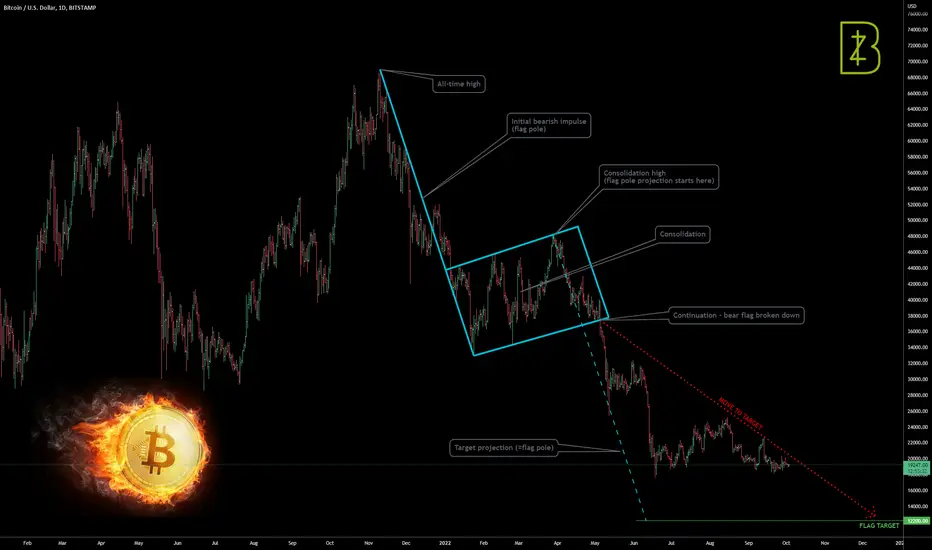
REASON #2: Bear Flag
So Bitcoin reached the all-time high @ 69K, dumped hard to 33K (flag pole), bounced as high as 48K and then dropped back down to 37K (consolidation). All that price action formed Bear Flag pattern (which is continuation formation) with target @ 12200. Clear break down out of the flag triggered the pattern. Now we are far away from the breakout point but on the other hand we are still quite far away from the pattern target. I mean from 20K to 10K it's still -50%, which is the same as from 40K to 20K. Anyway ... what do you think? Boost and comment in order to "unlock" the next (3/5) BTC bearish reason! Cheers!
Check my other stuff in related ideas.
Please boost🚀, comment🗣️, follow me✒️, enjoy📺!
⚠️Disclaimer: I'm not financial advisor. This is not a financial advice. Do your own due dilingence.
BTC: 5 bearish reasons (1/5)Hi all! Why do I think the crypto bear market is not over yet? Keep reading...
This is serial of 5 BTCUSD ideas (with 5 bearish agruments) released one after another one at a time after reaching following criterions: This idea needs to get at least 30 likes (just click the 🚀 button) and 20 comments (mine included, just say "thanks" whatever) in order to "unlock" the next idea which I will publish (here in comments) once the criterions are met and as soon as I can.
So let's get started!
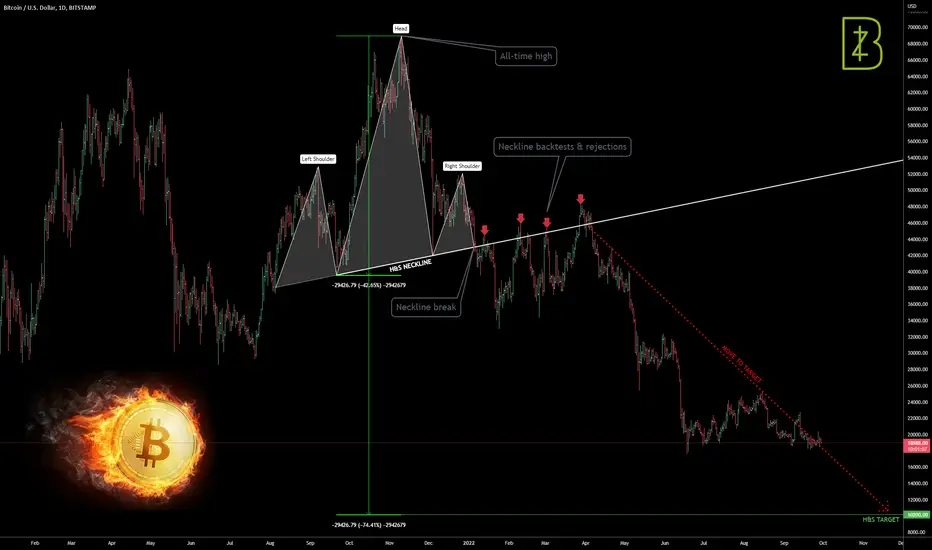
REASON #1: Head and Shoulders
You probably saw this already elsewhere but...the devil is in the details (i.e. target can differ), also it's still absolutely legit. So Bitcoin reached the all-time high @ 69K, dumped hard to 42K, bounced and then dropped back down to 43K. All that price action formed Head and Shoulders pattern (which is reversal formation) with target @ 10200. Break of the neckline and several backtests (red arrows) with rejections just added to the pattern validity. Now we are far away from the breaking point (neckline) but on the other hand we are still quite far away from the pattern target. I mean from 20K to 10K it's still -50%, which is the same as from 40K to 20K. Anyway ... let me know in the comments what do you think. Boost and comment in order to "unlock" the next (2/5) BTC bearish reason! Cheers!
Check my other stuff in related ideas.
Please boost🚀, comment🗣️, follow me✒️, enjoy📺!
⚠️Disclaimer: I'm not financial advisor. This is not a financial advice. Do your own due dilingence.
Bitcoin - Low volume foreshadows upcoming liquidity issues The price of Bitcoin stayed flat over the weekend. Additionally, nothing significant has occurred in the cryptocurrency market; therefore, we have no reason to change our bearish views on BTCUSD. This week, we will continue to pay close attention to volume levels hovering around monthly lows and reflecting a little interest in Bitcoin among new investors, making it impossible to reverse the primary trend from bearish to bullish.
Despite that, we continue to see an increase in false calls for the market bottom. That confirms no capitulation has occurred, and indeed, retail investors continue to buy dips, feeding wild rallies predestined to fall later. We expect this behavior to persist throughout the second stage of the bear market, increasing overall volatility.
Additionally, we expect the same from the FED pursuing another rate hike in November 2022. Accordingly, we think this will worsen economic conditions and lead to another selling frenzy. Thus, we remain committed to our price targets and expect them to be hit by the year's end. After that, we expect the market to start slowly progressing into the third stage of the bear market, characterized by the distress selling and abandonment of hopes and dreams among those who once fed the bubble.
Our price targets are 17 500 USD and 15 000 USD.
Illustration 1.01
Illustration 1.01 displays the daily chart of BTCUSD. The red arrow shows declining volume, hinting at liquidity issues in the system. To confirm our bearish thesis, we would like to see a pick-up in volume accompanying a decline in the price.
Technical analysis - daily time frame
RSI, MACD, and Stochastic are all bearish. DM+ and DM- are neutral. Overall, the daily time frame is slightly bearish; however, the trend is still weak.
Illustration 1.02
Illustration 1.02 shows the daily chart of BTCUSD. The yellow arrow points to the exhaustion we presented a few days ago. Interestingly, the price halted its rise slightly above the 50-day SMA.
Technical analysis - weekly time frame
RSI, MACD, Stochastic, DM+, and DM- are all bearish. Overall, the weekly time frame is bearish.
Please feel free to express your ideas and thoughts in the comment section.
DISCLAIMER: This analysis is not intended to encourage any buying or selling of any particular securities. Furthermore, it should not be a basis for taking any trade action by an individual investor. Therefore, your own due diligence is highly advised before entering a trade.
Spot Bull & Bear phases thanks to the USDT & USDC Dominance 🎯By using Technical Analysis on the USDT.D + USDC.D chart, compared to the Bitcoin chart, it becomes easy to spot Bull and Bear phases, let's have a look :
What we can see :
- Thanks to this parallel channel we can see that every time the USDT/C dominance reaches the top of the channel, Bitcoin starts a new Bull movement. And every time the USDT/C dominance chart reaches the bottom of the channel, Bitcoin starts a new Bear movement.
- As you can see, sometimes it did not reach the top or the bottom of the channel, BUT the Tenkan and the Kijun can give you the directions!
What we can expect :
- Next bull movement for Bitcoin is gonna happen once USDT/C dominance loses the Tenkan + Kijun and breaks the median line ! On the other hand Bitcoin must regain and close above its Tenkan.
- Always remember that Technical Analysis has its limits and the macroeconomic events must prevail over all analyzes, for any asset class! Ask Putin 🥲
Good luck traders, may the crypto be with you 🍀
FEEL FREE TO LEAVE A LIKE AND FOLLOW ⭐ H₿ CAPITAL ⭐
