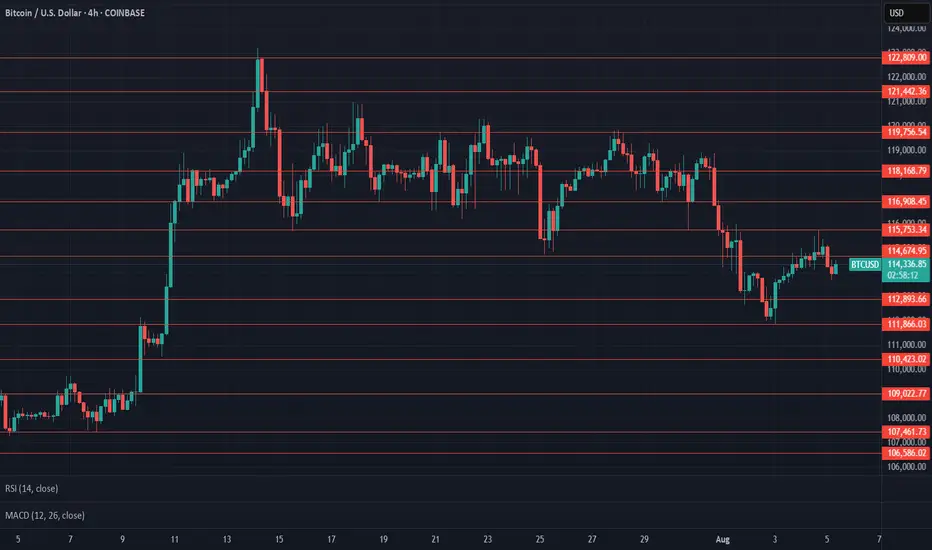
$BTC Update & ResistancesCRYPTOCAP:BTC resisted at $115,753, struggling below $114,674 support followed by Bearish engulfing on 4h, last weekly closed with bearish engulfing, RSI on 1D dropping, Weak volume, $111,866 key support from here, current support at $112,893 untested, $119,756 key resistance to break for ATH test at $123K, Next possible resistances will be $127,161, $129,594, $134,033, $140,499-$141,080, & $145,448.
Btcforcast
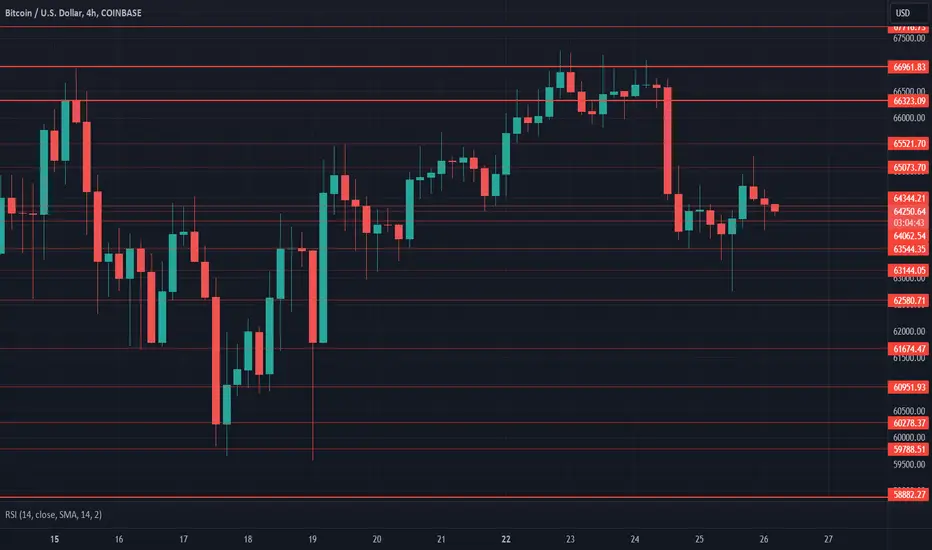
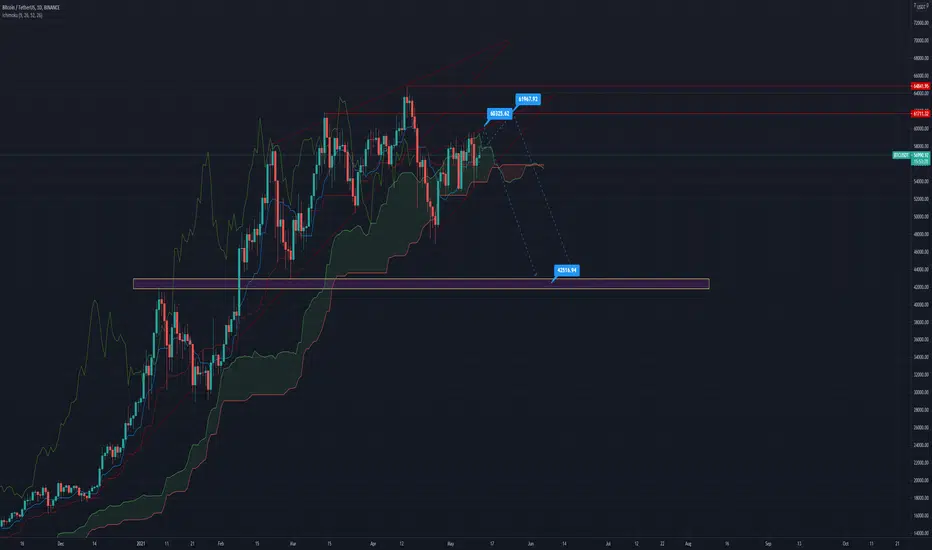
$BTC Daily UpdateCRYPTOCAP:BTC CRYPTOCAP:BTC $66,961 resisted strong failing to hold $66,323 support as expected, currently testing given support area $64,344. RSI on 1D and 4H looks fine, needs push here, last 1D closed good but current 1D weak on volume, $62,580 lowest support from here, expect resistance around $65,521. Watch given S/R
$BTC Daily UpdateCRYPTOCAP:BTC #BTC Good swing following up to bullish engulfing on 4H from yesterday, put a wick at $28,298, $27,994 holding strong yet. Last daily closed with bullish engulfing, Needs volume on current 1D to follow thru, current support at $27,478. Resistance ranging $27,994-$28,298.

$BTC Daily UpdateCRYPTOCAP:BTC #BTC $26,333 being tested as expected😎, struggle at $26,333 like i said yesterday, Previous 1D closed with bullish pin, RSI on 4H and 1D looking neutral, must regain $26,650 to reattempt at $27,478.
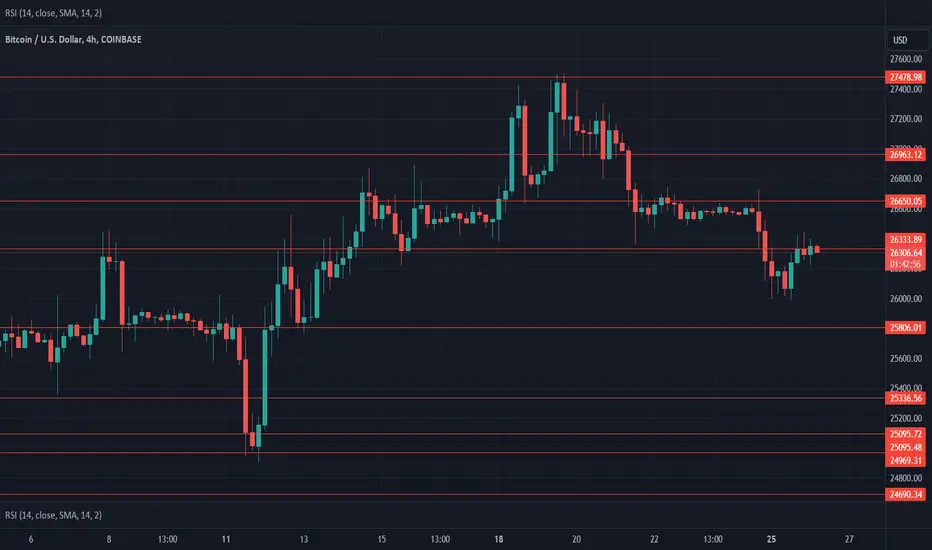
$BTC Daily UpdateCRYPTOCAP:BTC testing $26,333, Previous 4h closed bearish with resistance holding good, bullish engulfing on 1D previous close, gaining $26,650 support will allow to test for $27,478. Watch given S/R

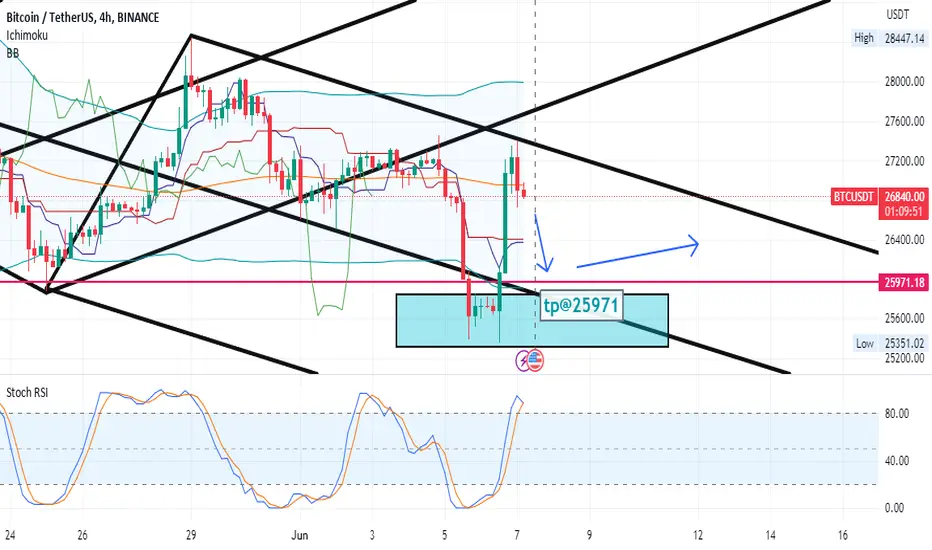
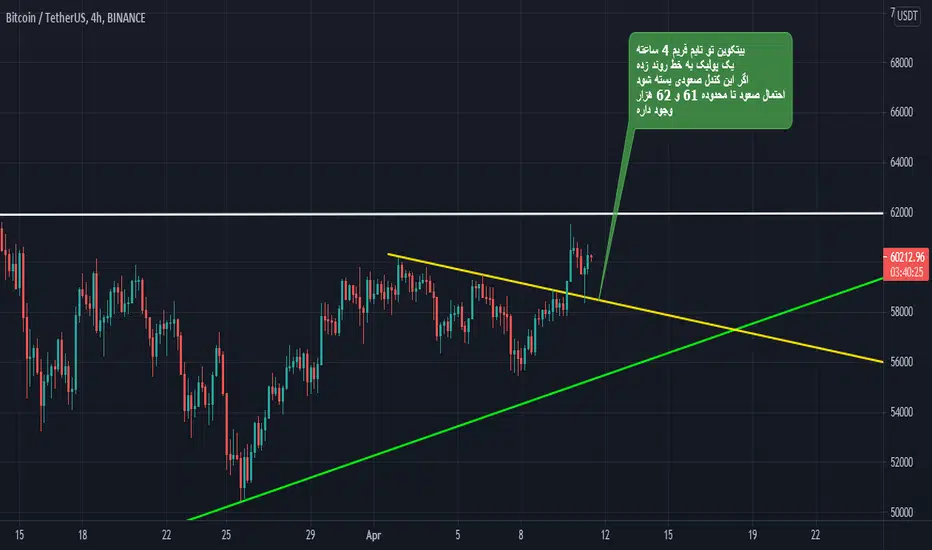
Going down to 25971$I think that based on the current price and the Andrews Forks, it is possible for the price to fall to $25,971 within the four-hour period. Additionally, based on the occurrence of the second red candle, the fall can be predicted up to that point. Therefore, your profit limit can be around $25,971. Sounds good!
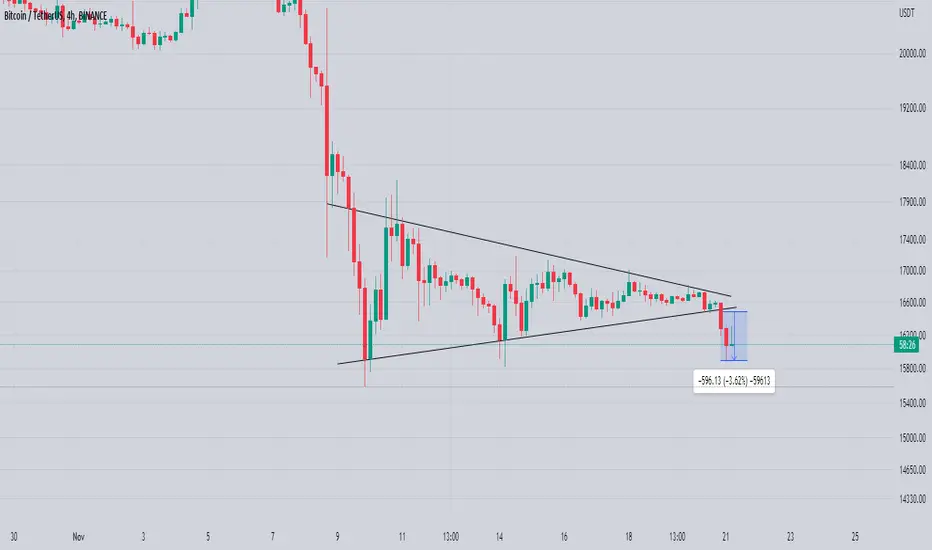
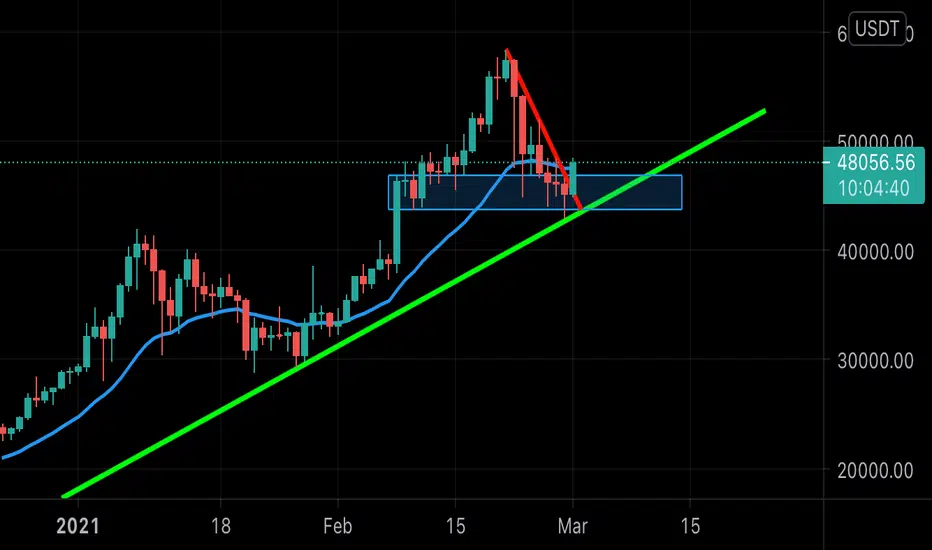
BTCUSDTBearish Pennant Breaks to The Downside As WE Predicted
4% Profit So Far Still Expecting Move Towards 15k
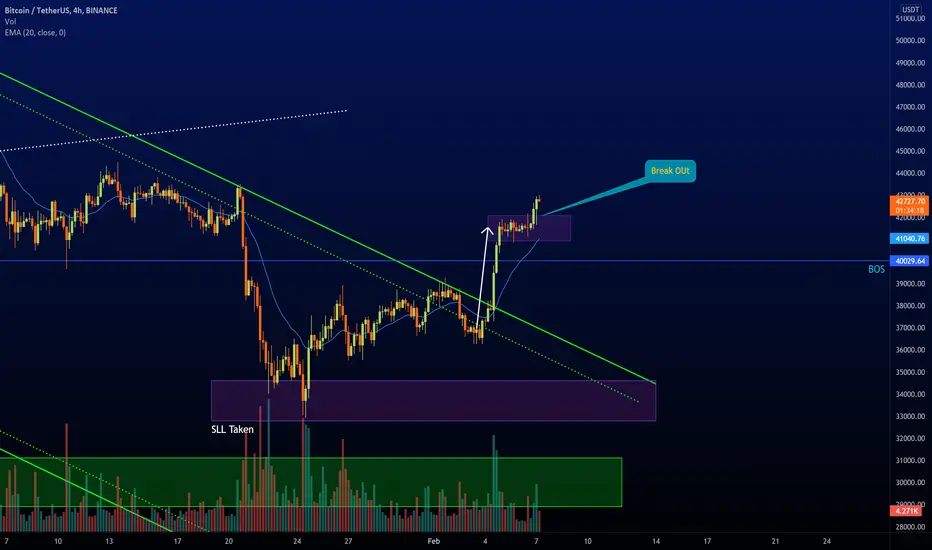
BTCUSDTBreakout Done AS WE Predicted Few Days Ago
Now if You want perfect entry you should needs to wait for retest of broken support
after retest btc can continue further to the downside
always wait for retest to enter in market now a days market behavior has changed alot so trade carefully and follow the rules if you want to be succesful trader

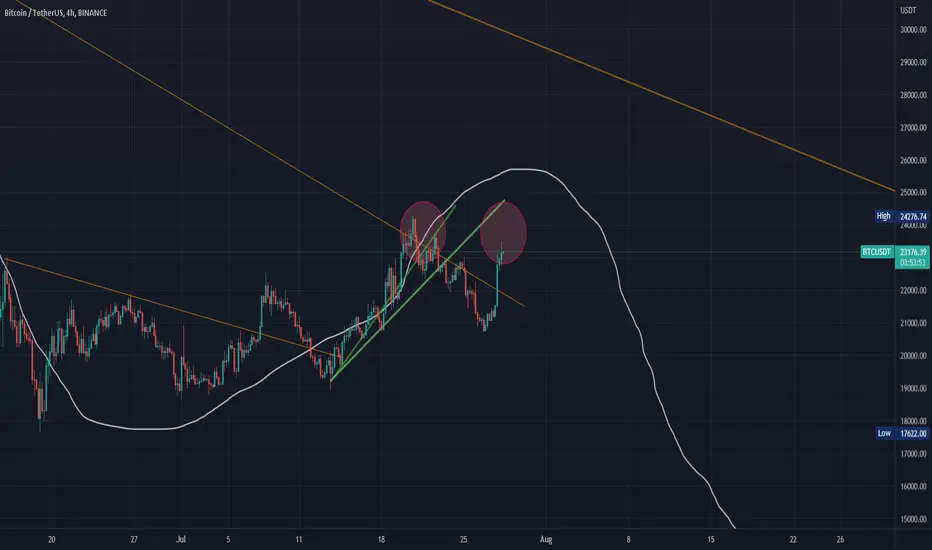
BTCUSDT Be careful, As I said , in the BTCUSDT chart analysis on July 23, the price can rise up to the 24300 range and start falling to around the price of 19k by forming a double-Top.
It will be in that price range that the chart should be updated to see if it is possible to reach the prices of 26k or 30k or not.
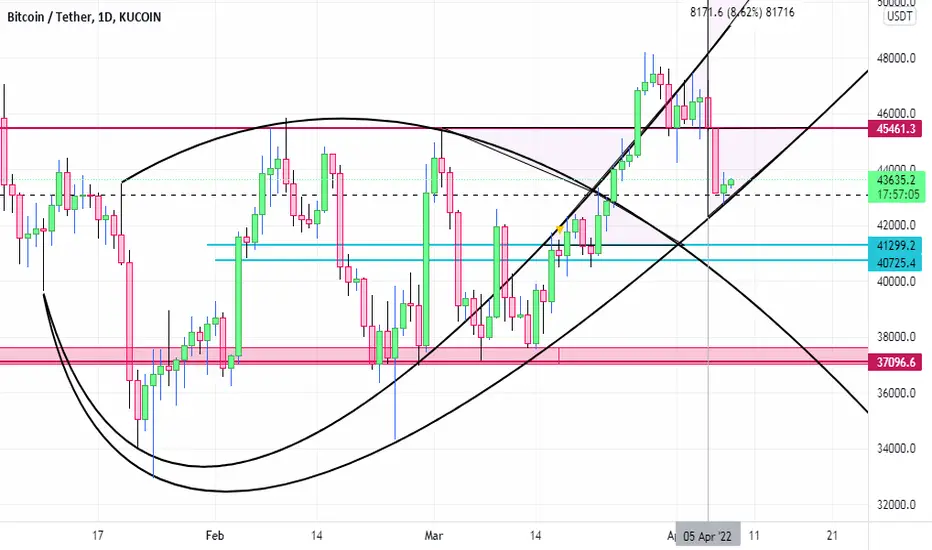
Btc in different looks2Hello friends...
today i prepare some of my bitcoin charts to show you in different looks.
you should always look at chart in different ways.
please ask your questions in comments.
BTC CONFIRMED BULLISH FlAG BREAKOUT.📊 #BTCUSDT (BITCOIN)
💹 Time Frame : 4H (Update)
➖➖➖➖➖➖➖➖
🟡BITCOIN breaks the Bull flag pattern in the upward direction and also was able to close the Daily candle above EMA 20. This is a good sign for the market. The next major resistance is (43500$ - 44500$) area. The local support is
(41000$ - 42000$) area. Let's wait for the US market to open
and see if BTC is able to hold above the 42000$ area then we see more upward movement. This analysis will be updated
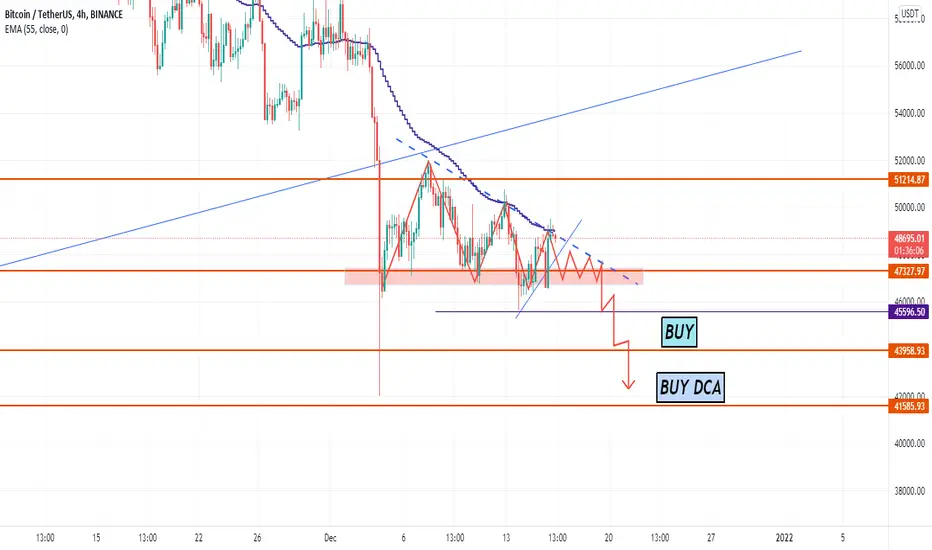
BTC UPDATE 4H CHART12 786 92 AM AS AD AR AP ......
BTC iIS MAKING DECENDING triangle buyers are becoming weaker as seller are becoming strong against SUPPORT
w8 for breakout with a build up AND BUY ON LOWER LEVELS
I DON'T RECOMMEND SHORTING
SO DCA FOR BETTER RISK AND REWARD
(INSHA-ALLAH)
THANKS.
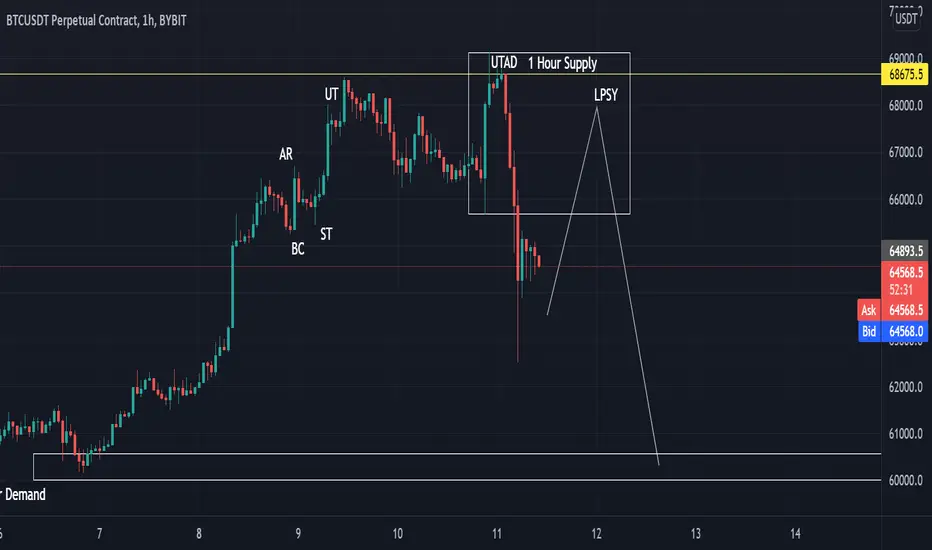
A HUGE CORRECTION IN BTC ?There might be a huge correction in BTC
- 1/4 Hours Analysis based on Supply Demand & Wyckoff, Price Imbalance, Structure
- 1 Hour Distribution Wyckoff Formed
- UTAD had played out
- Wait for LPSY to form ( retest and confrmation)
- Short at LPSY (scale down to 1-5 mins timeframes for better risk rewards entry)
- Take Profit at 1/4 Hours Demand (could partial or conservatively, take all, there are many imbalance and supply demand have not mitigate, signs show price moving too quick)
- Whale might want to dip in lower price
-BTC consilidate in a long period and pump up quickly lately, sign shows Whale manipulation is high, and they might want to push price lower and dip in future
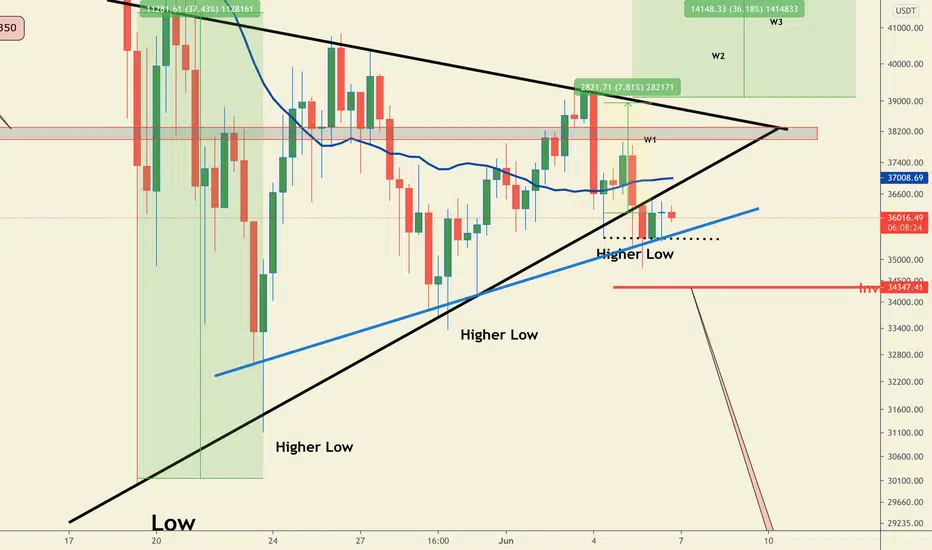
#BTC is at crucial point. This is where you sell BTC.Welcome to this quick update.
To be honest things aren’t looking good atm. Observe the chart carefully.
We did broke down below the triangle but only in lower time frames. It can end up being a WICK in a daily candle close which matters the most.
Keep in mind it’s really important for BTC to maintain the 34k level. If you’re holding btc better to keep an SL around 34300 level. Previously we bounced from the 34800 level. It must hold if it doesn’t this chart will get invalidated and we can see some lower price targets. Keeping in mind the current fear in the market We can get surprised too. Let’s wait for some action on Monday.
Break and close above the 43k level could trigger a momentum for another bullish rally. Too soon to say anything though.
SO IN A NUTSHELL : Close below 34k level bearish
Close above 43k level Bullish
Do hit the like button and share your views on the comment section.
Stay safe.
#PEACE
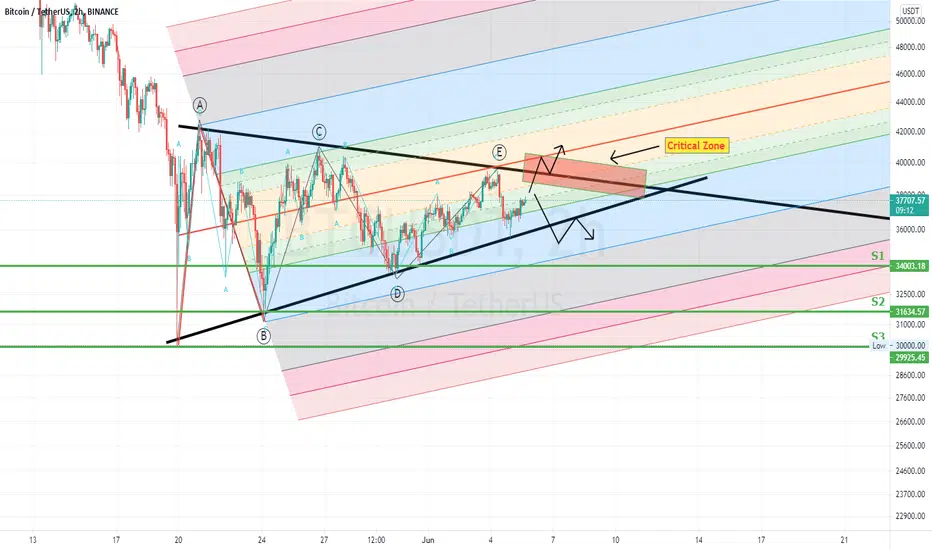
Critical time for Bitcoin aheadBitcoin has completed 5 wave pattern and now it is at a very critical stage.
Luckily after point E, lower part of the triangle manged to hold selling pressure and bounced back up.
Now on the chart it is very critical for Bitcoin to break above the upper part of the triangle which will be decided the marked critical zone.
If bitcoin manage to break and stay above that critical zone, it will continue in an upward trend.
However if fails to break or hold upper part of the triangle then Bears will be in control and Bitcoin might potentially fall back to 29K level.
Next couple of days are critical for Bitcoin.
If you like my analysis then do drop a LIKE and a COMMENT. Also do SHARE it with your friends.
Also don't forget to smash that FOLLOW button to get daily analysis of multiple crypto currencies and sometime ASX stocks.
Note - These are my personal notes and in no way a financial advice. Do your own research and Trade wisely
#btcusdt #dailyHi guys..its the latest analyze chart of #BTCUSDT in daily time frame(folowers Requested analysis) .if you are interested any crypto that you want analyze with me and any questions please do not hesitate and comment below the chart!
if u like it press like-comment and folow me.thx
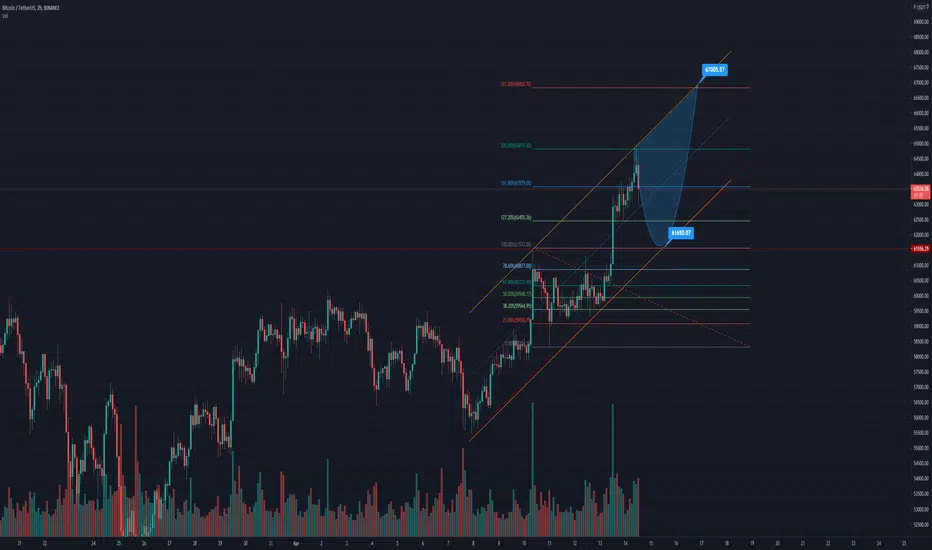
BTC/USD : Low TF overview BITSTAMP:BTCUSD
Hello everyone 😃
BTC is forming a triangle into a rising wedge.
There is a bigger rising wedge also.
📍 You can reach my last idea about BTC's movement on Related Ideas at the end of caption !
Majority for movement is still bullish, How ever funding is high and most of positions are being short..
On my personal view;
I will wait for a confirmation after current FIBBO time-zone.
I'm still looking for minor dip at 14th May around 40K !!
Possible directions for BTC on next 4 days is :
- Reaching major rising wedge's higher line and then may reversal movement happen
- Reaching 66K level on FIBBO extension and then may reversal movement happen
- Being rejected below current rising wedge and retest historical bearish trendline and then we may see the continuation of downtrend movement
I'm still predicting on my last exclusive BTC's analysis, How ever these are all for mid-term.
📌 It could be better to see a minor dip before real top around ~200K by the end of 2021...
By the way, As we are into bull market, Every short idea is risky !
But I'm talking about important scenarios like :
1️⃣ Multiple bearish divergence on Total market cap
2️⃣ Major pivot points based on FIBBO time-zone
3️⃣ Market is extremely overheated
4️⃣ Reaching 100% level on FIBBO extension
5️⃣ Reaching the final fifth upward wave of Elliot impulse wave
6️⃣ BTC's market is in the greedy stage.
And many more factors that can confirm our last analysis for mid-term correction for BTC !
🔴 Mentioned directions on this chart are not valid, I just want to make it more clear for scenarios...
Attention: this isn't financial advice we are just trying to help people on their own vision.
Have a good day!
@Helical_Trades

#BTCUSDT #2h #bitcoinHi guys..its the latest analyze chart of #BTCUSDT in #2H time frame(folowers Requested analysis) .if you are interested any crypto that you want analyze with me and any questions please do not hesitate and comment below the chart!
if u like it press like-comment and folow me.thx
BTC 4H BUYAlso set some Buy orders near the Trendline
Remember no more than 5% of the deposit in one trade
SL: next sell signal
BTCUSDTA great support for bitcoin. It’s time to buy...
43,000-46,000 is a support zone. 49,000 would be the next target.

BITCOIN Bull Pressure Incoming,Short Squeeze next($60K New TA)Like And Subscribe(Thanks for the support).
It is no co-incidence that we are seeing serious battle going on between buyers and sellers, on what direction Bitcoin price should take from here next. This is not new after a strong sharp upward move from 20k range to 40k range, we see the buyers white trend line support being constantly attacked by the sellers (bears) and fearlessly defended by the Buyers(bulls).
But looking closely we see that even though the sellers are fighting hard, price doesn't seems to move any farther down but instead we watch as Bitcoin Buyers strength keep growing , bulls are holding tightly to the Bullish continuation pattern about breaking out called the Bullish Pennant(this is a trading range or consolidation pattern.)
At this point it feels fearful as price keeps going back and forth but as long as the buyers trendline is respected, expect to see an explosive measured move to the upside as a result of equal measured target of the pennant flag pole.
What is a pennant and how do you trade it?
A bullish pennant simply represents a continuation pattern that forms to mark a short term pause in the movement of a price halfway through a strong uptrend, there by giving you a trader the opportunity to Buy and join the trend. It is a continuation pattern because over 85% of the time the trend will continue on it way up, the same direction before the pause occurred.
This is what this pause looks like on the Weekly chart
This means the pause is temporary and that the sharp climb in price would resume after that brief period of consolidation, when bulls gather enough energy to take the price higher again.
Bullish pennants resemble a triangular flag as the price moves sideways, making gradually lower highs and higher lows. the major characteristics is the flag pole, this is represented by the move before the pause occurred.
How do you trade a bullish Pennant?
like I stated earlier that for a Bullish pennant to form, price will first need to make a strong sharp movement to the upside. This first strong price upward movement is called a flag pole and its size is important when you are calculating where to place the profit target for your buy trade position.
Here are my simple easy methods for trading a Bullish Pennant.
Please read my previous post if you are interested on the 3 strategy for trading a range.
The current support at 34560 all the way to 33600 area is clearly a buy zone that the bulls are likely to defend strongly, If the sellers succeed to break it and make their way below to 32k , then it will be tough crack and bye bye to bulls, but if instead the white trendline hold up and we get a bounce above 39k, that will be a bye bye bears time as next will be short Squeeze.
ones the current bull white trendline holds we will see an equal measured move same as the height of the flag pole to the upside, this happens to be exactly the $60k range move
