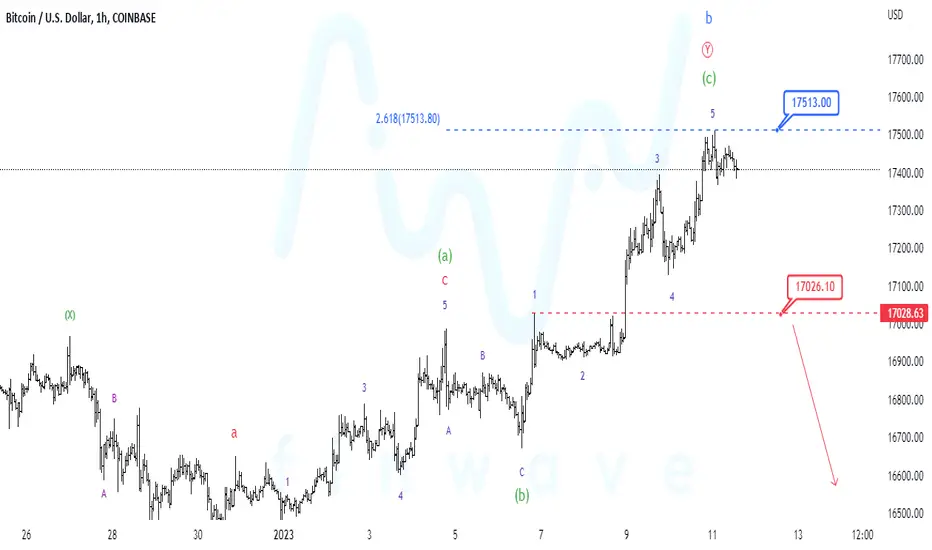
Financial Wave. BTCOur BTC priority scenario again led to the previously stated $17,513 targets. There is every reason to believe that the upward wave b is over. The next move in Bitcoin is a down wave c that could take Bitcoin prices below $15,000. We’ll not make hasty conclusions, but wait until the $17028 level is broken. In this case, it will be possible to consider that the fall in BTC has begun, and we’ll be able to determine short-term goals.
Btcforecast
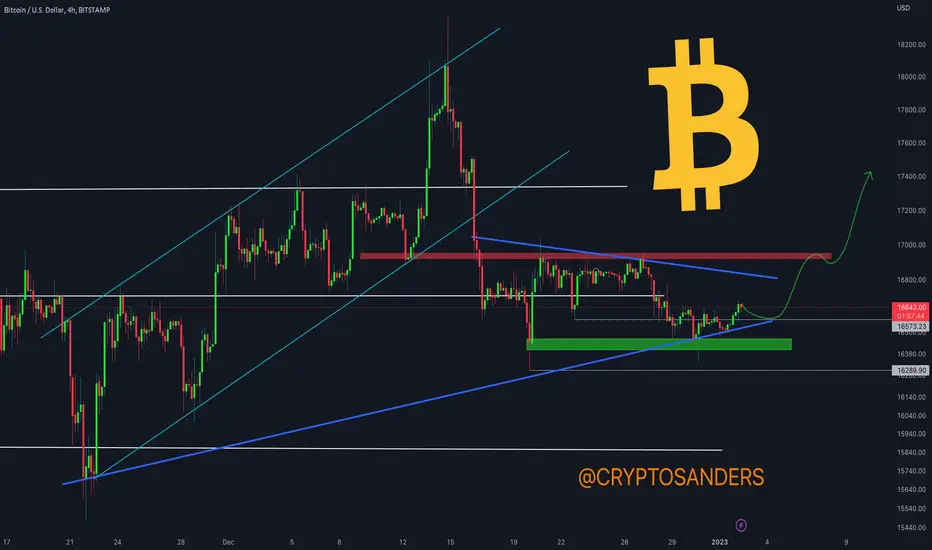
BTC/USDT 4HOUR UPDATEHello and welcome to this BTC /USDT chart update by Crypto Sanders.
I have tried to bring the best possible result in this chart.
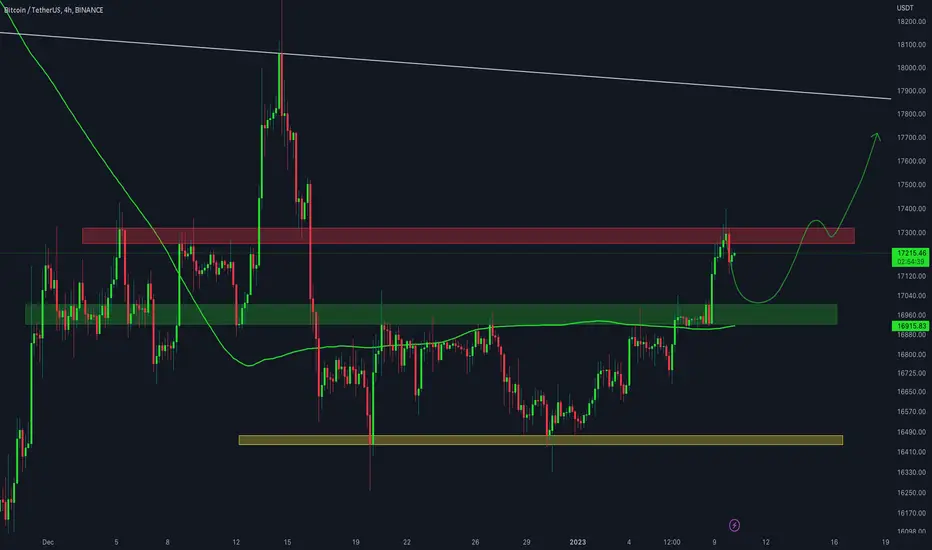
Chart Analysis:-BTC attempted to break the horizontal red resistance and was able to trade above it. Now it is trading above it again.
Here we need a successful retest above the horizontal red resistance to confirm another bullish move.
If it continues to decline from here, it will do some correction towards the horizontal support from where we can expect a bounce back.
This is not a piece of financial advice.
Hit the like button if you like it and share your chart in the comment section.
Thank you

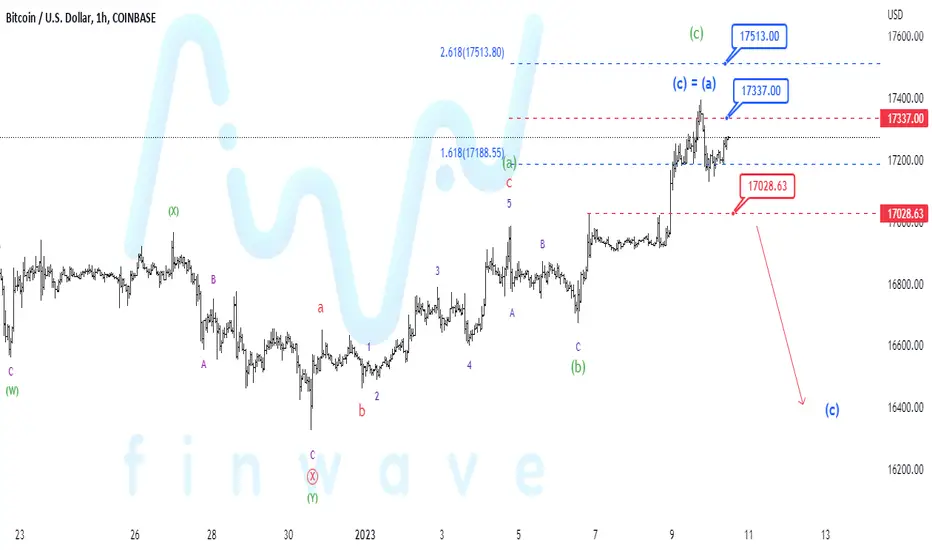
Financial Wave. BTCOur priority scenario in BTC is the completion of wave (c). The uptrend is over or almost over. $17513 is the next possible reversal target. If the price of Bitcoin falls below $17028, we can consider that the downward wave (c) has begun, and we can determine short-term targets in BTC.
BTC/USDT 4HOUR UPDATEHello and welcome to this BTC /USDT chart update by Crypto Sanders.
I have tried to bring the best possible result in this chart.
Chart Analysis:-BTC attempted to break the horizontal resistance but couldn't able to give a close above it. Now it is again trading below it.
Here we've to wait for a successful breakout above the horizontal resistance to confirm a further bullish move.
If it continues to reject from here, it will take some correction toward the horizontal support from where we could expect a bounce back.
This is not a piece of financial advice.
Hit the like button if you like it and share your chart in the comment section.
Thank you
📉BTC 4H analysis: S01E01📈BINANCE:BTCUSDT
COINBASE:BTCUSD
Bitcoin analytical series starts today!!!
Hello traders, First take a look at my previous analysis.
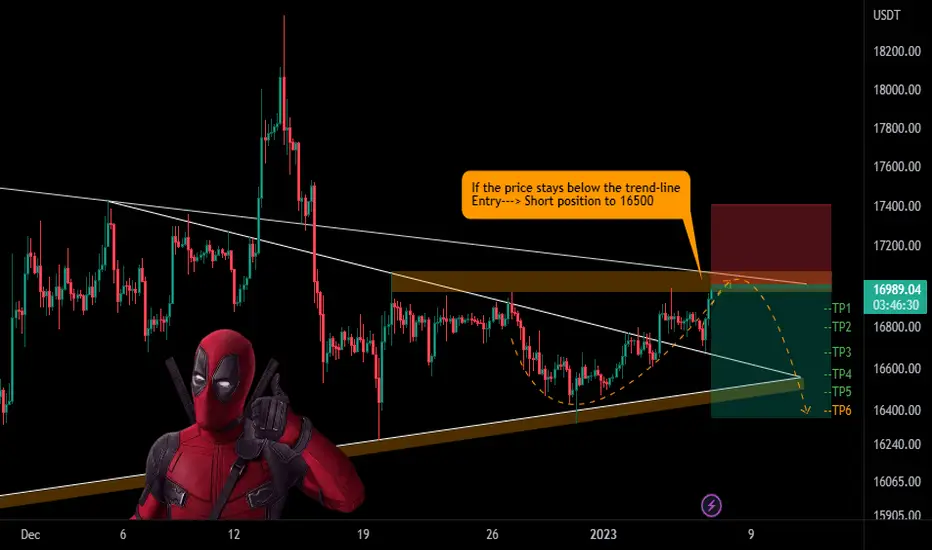
💥From now, until the price is inside the yellow area, you can open short position in two steps.
The optimum stop-loss is above the determined level.
TP1-2-3-4-5-6 are on the chart
BTC Daily TA Neutral BullishBTCUSD daily guidance is neutral with a bullish bias. Recommended ratio: 53% BTC, 47% Cash.
* The December US Employment Situation was released this morning , the Unemployment Rate is back down to 3.5% from 3.7% in November, while 223k Nonfarm Jobs were added (compared to 263k in November) and the Labor Force Participation Rate ticked up to 62.3% from 62.1% in November. These numbers hardly reflect an economy affected by higher central bank interest rates and will likely spur conversation regarding whether or not to go back to a 75bps rate hike (as opposed to 50bps) come February 1st. The Fed Minutes released yesterday reaffirmed that the Fed is committed to bringing down inflation, they don't see rates cuts in 2023, and that Russia and China both are still major factors of supply chain disruptions which will continue to reverberate through global markets until some resolution is found. In the report, notable changes are significant rises to consumer credit and decreases to commercial real estate construction and investing. December Global Manufacturing PMI released on 01/03 showed an accelerated decrease to 48.6 from 48.8 in November, influenced primarily by lower output from USA, China, Japan and Europe, and is now at a 30-month low. Among the countries which saw an expansion of output production, Russia and India were in the top 5 (BRICS). The latest GDPNow US Q4 GDP estimate (01/05) is 3.8% , down from 3.9% on 01/03.
Cryptos, US Equities, US Equity Futures, 1-M and 2-M US Treasurys, Energy, Metals, Agriculture (Mixed), EURUSD, GBPUSD, JPYUSD, CNYUSD, NI225 and N100 are up. DXY, US Treasurys, VIX and HSI are down.
Key Upcoming Dates: Next GDPNow US Q4 GDP estimate 01/10; US December CPI at 830am EST 01/12; UofM Preliminary Consumer Sentiment Index at 10am 01/13. *
Price is currently trending up at ~$16800 as it continues to test the 50MA for the tenth consecutive session. Volume remains Moderate (moderate) and is on track to favor buyers in five out of the past six sessions; Price continues to trade within the second largest supply/demand zone. Parabolic SAR flips bullish at $17600, this margin is mildly bullish at the moment. RSI continues to trend sideways at 50 for the third consecutive session as it aims to retest the upper trendline of the descending channel from January 2021 at 57 as resistance. Stochastic remains bullish and is currently trending up at 97 as it approaches max top. MACD remains bullish for a fifth consecutive session and is currently trending up at -63; the next resistance is at 312 while the next support (minor) is at -232. ADX continues to trend down at 16 and is beginning to form a soft trough as Price continues to trade in range with a short term uptrend, this is bearish at the moment.
If Price is able to break above the 50MA at $16800 and establish short-term support there, the next resistance is the local-high at ~$18600 as resistance before potentially testing $19417 resistance . However, if Price breaks down here, it will likely retest the uptrend line from March 2017 at $15800 as support . Mental Stop Loss: (one close below) $16300.

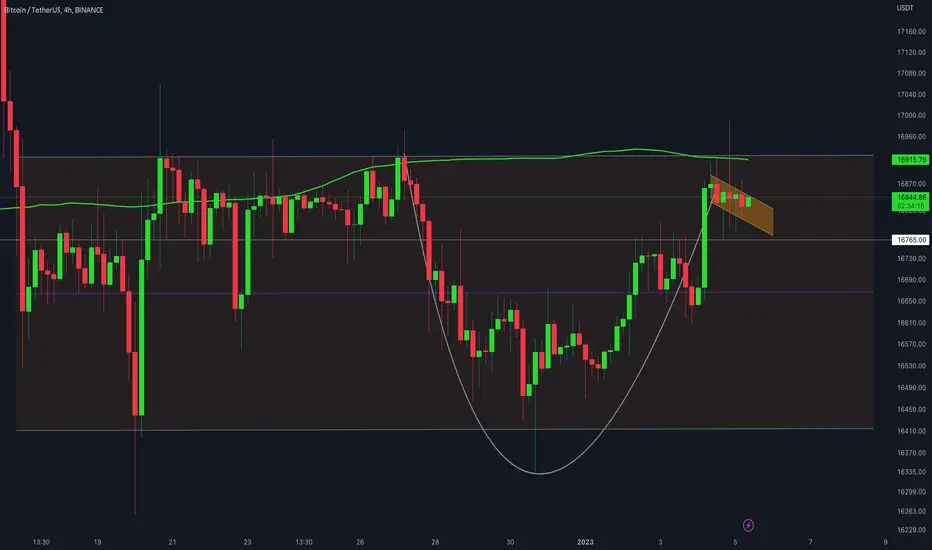
BTC/USDT 4HOUR UPDATEHello and welcome to this BTC /USDT chart update by Crypto Sanders.
I have tried to bring the best possible result in this chart.
Chart Analysis:- BTC bounced from the local support after a successful retest but got rejected after hunting stops above horizontal resistance and MA 200.
It has also formed a cup and handle pattern, which is technically a bullish pattern. Currently, the price is consolidating in a shape of a handle.
A solid breakout of the horizontal resistance would be a bullish continuation sign in it, and the invalidation of the handle is a breakdown of the local support with a retest below it.
This is not a piece of financial advice.
Hit the like button if you like it and share your chart in the comment section.
Thank you
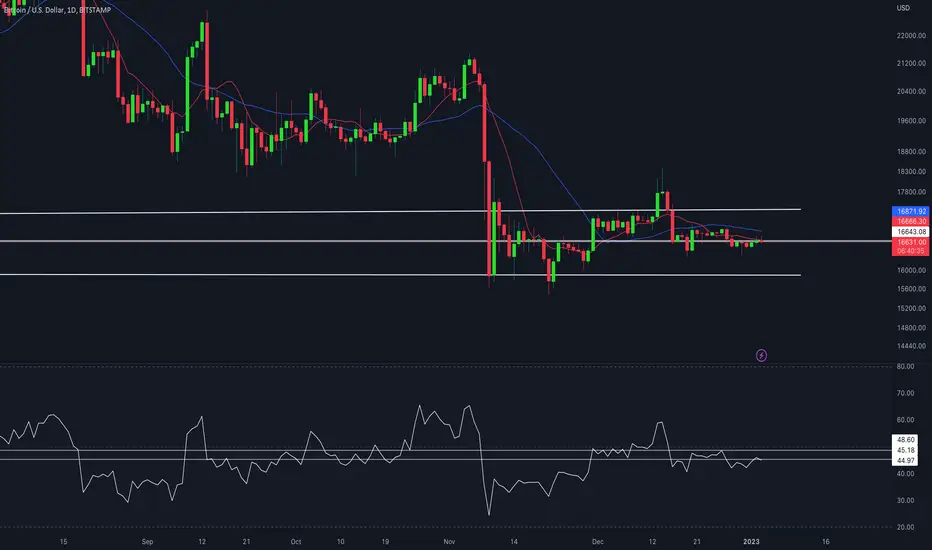
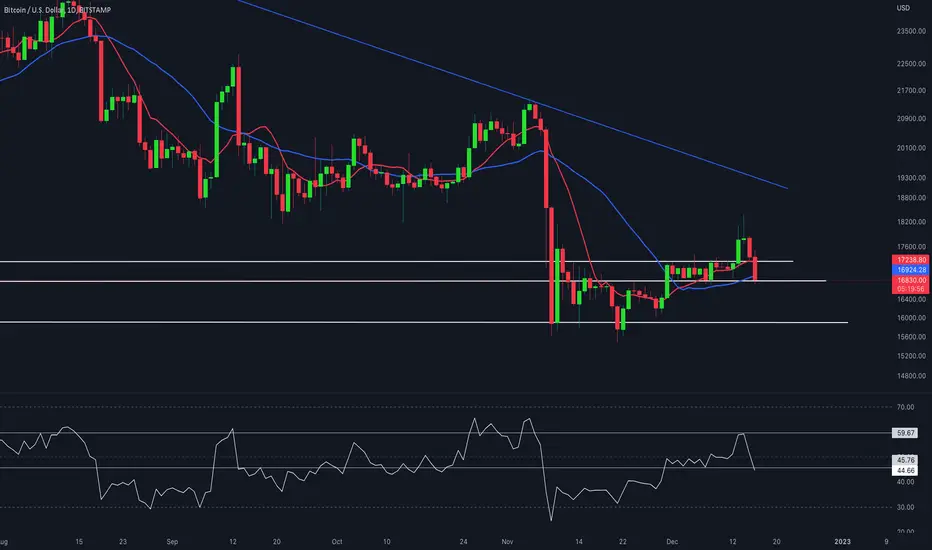
BTC/USD 1DAY UPDATE BY CRYPTO SANDERSHello, welcome to this BTC /USD 1DAY chart update by CRYPTOSANDERS.
I have tried to bring the best possible outcome to this chart.
CHART ANALYSIS:- Bitcoin (BTC) edged closer to the $17,000 level on Tuesday, as traders turned their attention to Wednesday’s FOMC minutes report.
BTC/USD hit a high of $16,760.45 earlier in today’s session, which comes less than 24 hours after trading at a low of $16,666.92.
Today’s activity saw bitcoin near a breakout of a long-term resistance level of $16,800, as market volatility remains high following the New Year’s celebration.
As can be seen from the chart, Tuesday’s move comes as the 14-day relative strength index (RSI) approached a resistance level of its own.
Currently, the index is tracking at 47.18, which is marginally below its point of resistance at the 48.00 mark.
This ceiling seems to be the main hurdle stopping price from extending gains and moving above the $17,000 zone.
This is not a piece of financial advice.
Hit the like button if you like it and share your charts in the comments section.
Thank you
BTC/USDT 4HOUR UPDATEHello, welcome to this BTC /USDT chart update by CRYPTO SANDERS.
I have tried to bring the best possible outcome to this chart.
CHART ANALYSIS:-BitcoinBitcoin continues the sideways movement. The market is loading for a big impulsive move. The trading range major support is the $15,000-$15,500 area and major resistance is the $17,800-$18,500 area. Plan your trades accordingly.
This is not a piece of financial advice.
Hit the like button if you like it and share your charts in the comments section.
Thank you

BTC/USDT 4HOUR UPDATEHello, welcome to this BTC /USDT chart update by CRYPTO SANDERS.
I have tried to bring the best possible outcome to this chart.
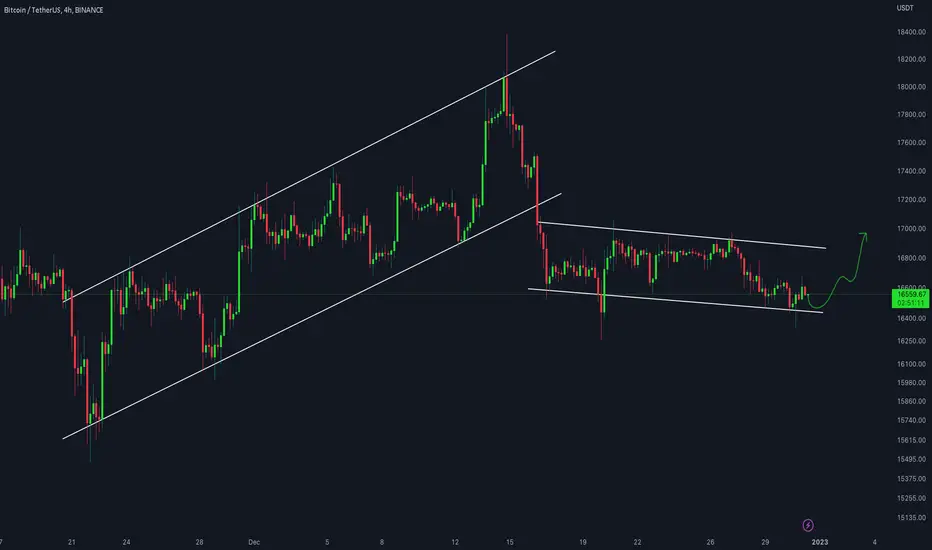
CHART ANALYSIS:-Bitcoin respecting the channel trendlines. Still, there is no movement in the market. Bitcoin CME trading is closed till 3rd January so we may not see much movement in the market. Some volatility is expected in the second week of January.
This is not a piece of financial advice.
Hit the like button if you like it and share your charts in the comments section.
Thank you
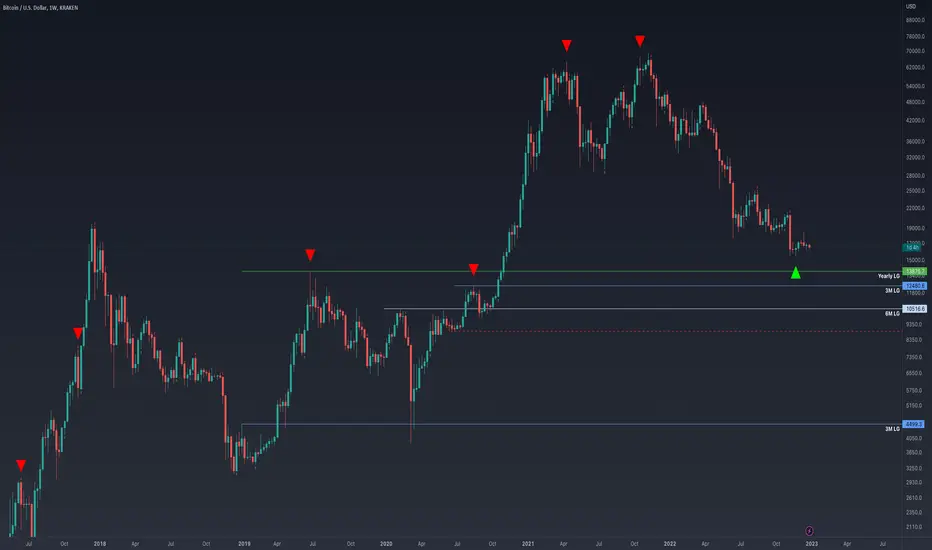
BTC HTF levels for 2023BTC HTF levels for 2023 and beyond. Gonna be a rough year imo but I wanna see a sweep of red to really go all in on crypto.
BTC/USDT 4HOUR UPDATEHello, welcome to this BTC /USDT chart update by CRYPTO SANDERS.
I have tried to bring the best possible outcome to this chart.
CHART ANALYSIS:-Bitcoin bounced from the trendline support. The channel is working fine and the trading range continues. There is no volume in the market. The market is giving time to enjoy the new year's eve party. Let's see what the new year brings for crypto.
This is not a piece of financial advice.
Hit the like button if you like it and share your charts in the comments section.
Thank you
BTC/USDT 4HOUR UPDATEHello, welcome to this BTC /USDT chart update by CRYPTOSANDERS.
I have tried to bring the best possible outcome to this chart.
CHART ANALYSIS:-BTC is holding above the ascending trendline support on 8h TF. RSI is in the oversold region and also holding above the trendline support.
The volume is low here and for the confirmation of bullish momentum back in the market, bulls need a solid breakout of the horizontal resistance, where MA100 and 50% retracement level are also acting as resistance.
A sustained breakdown of the ascending trendline support would confirm a downward move toward the horizontal support from where we could expect a bounce back in the market.
This is not a piece of financial advice.
Hit the like button if you like it and share your charts in the comments section.
Thank you

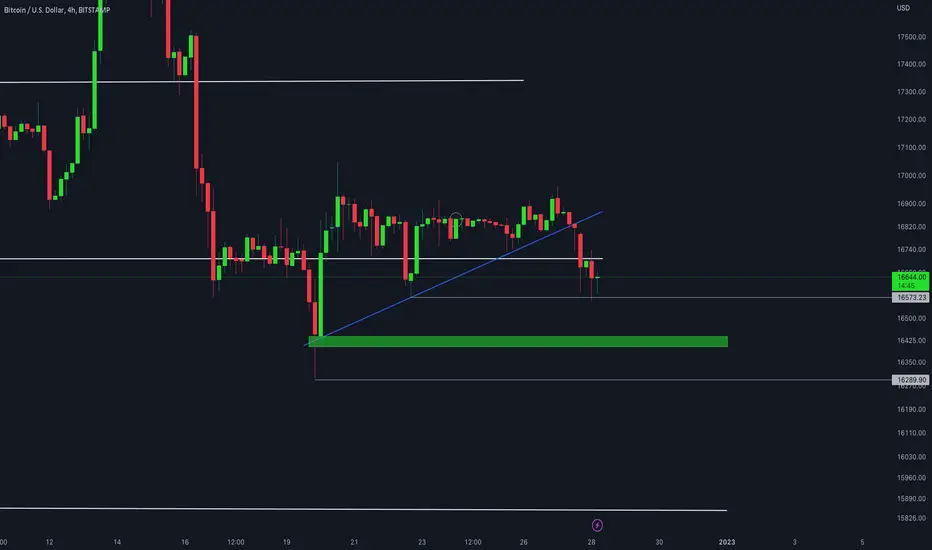
BTC/USDT 2HOUR UPDATEHello, welcome to this BTC /USDT chart update by CRYPTOSANDERS.
I have tried to bring the best possible outcome to this chart.
CHART ANALYSIS:-
BTC took a sharp correction after the breakdown of the ascending triangle. Now it has cleared stops below the previous low and bouncing from the horizontal support.
A bounce is expected from here, but a strong confirmation of bullish momentum in the market is a solid close above $17K. If it breakdown the current horizontal support, we will see a further downward move in the market.
This is not a piece of financial advice.
Hit the like button if you like it and share your charts in the comments section.
Thank you
BTC/USDT 4HOUR UPDATEHello, welcome to this BTC /USDT chart update by CRYPTOSANDERS.
I have tried to bring the best possible outcome to this chart.
CHART ANALYSIS:- BTC effectively breakdown the ascending triangle following the downward move. As of now, it is holding over the marked low of $16,559.
If bulls won't show strength here, then the downward move will continue toward the horizontal support or the lower marked strong low support.
For the bullish confirmation, bulls need to break out the horizontal resistance around $16,940 with a retest above it to confirm a decent bullish rally in the market.
This is not a piece of financial advice.
Hit the like button if you like it and share your charts in the comments section.
Thank you
last final dump or what?😐we have two strong supports at 13.7k and 12k
and...
ONE verry verry strong resistance at 18.5k
I see no point at the level of 15-16k to hold the price of bitcoin, for now personally I'm still bearish and waiting for 13.7k price.
we'll see what happens next, just have to wait.

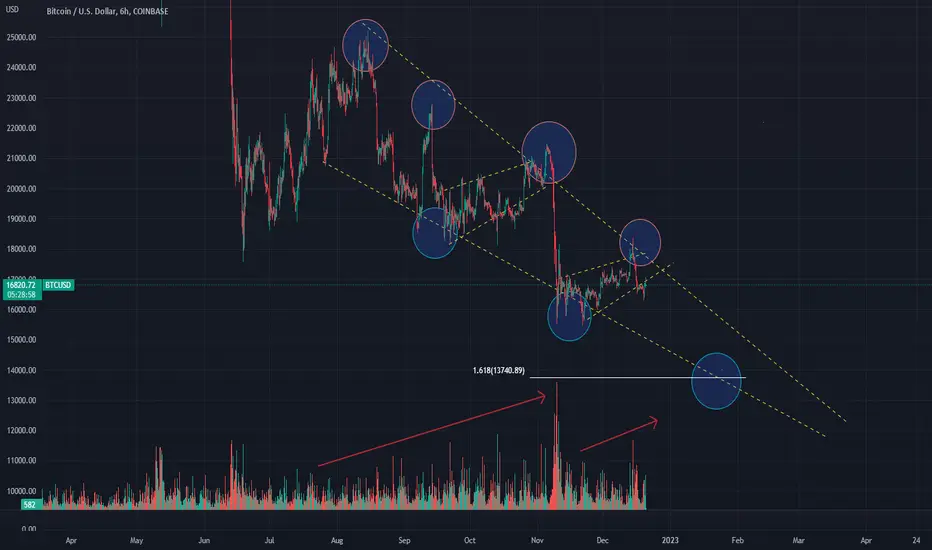
BTC Macro Wedge BiopsyMacro descending wedge made up of a series of micro rising wedges, which account the bleed-offs we continue to see in the price action. Next stop if we distribute from our current channel is in the vicinity of 13.7K (1.618% Fibonacci retracement), which I am expecting. This may (or may not) come before a FOMO bull trap reaching into 17.5-18K area with full mitigation around at the 21K supply block. This sort of markup would be freakish, however, as abnormal demand would suddenly have to surge in a market saturated with FUD. The descending macro wedge's apex occurs sometime in March 2023 in the 10K range and is a bullish reversal pattern obviously. Could this confluence be the area of long-awaited reversal? Or simply more consolidation? Or a fake-break to the south? Or the creation of a mighty springtime countertrend? We'll find out soon enough!
**If you have strong hands, patience, and like big wins, be sure to SUBSCRIBE to this channel. Here's why: I track all USD-paired cryptocurrencies on all the major CEXs and seek out the most lucrative swing trades. All my charts are clean and easy-to-follow with exceptional win rates ranging consistently between 80-85%. My TA is based off a combination of Wyckoff/ VSA , EWT & Fibonacci. Stop getting smashed and start winning in crypto. My charts will teach you how.
*Not a financial advisor. Trade at your own risk.
BTC/USDT 1DAY UPDATE BY CRYPTO SANDERSHello, welcome to this BTC/USDT 1DAY chart update by CRYPTOSANDERS.
I have tried to bring the best possible outcome to this chart.
CHART ANALYSIS:-Bitcoin (BTC) moved closer to the $17,000 level on Tuesday, as traders reacted to the latest Bank of Japan policy decision.
BTC/USD surged to a peak of $16,837.65 earlier in today’s session, less than 24 hours after hitting a low of $16,398.14.
Today’s move saw the token climb above a key resistance level of $16,700, with prices rising to a four-day high in the process.
Looking at the chart, the surge took place as the 14-day relative strength index (RSI) broke out of a ceiling at the 46.00 level.
As of writing, the index is currently tracking at the 46.61 mark, which is its strongest point since last Thursday.
Should the index continue this upward trend, we will likely see BTC move above the $17,000 level in the coming days.
This is not a piece of financial advice.
Hit the like button if you like it and share your charts in the comments section.
Thank you

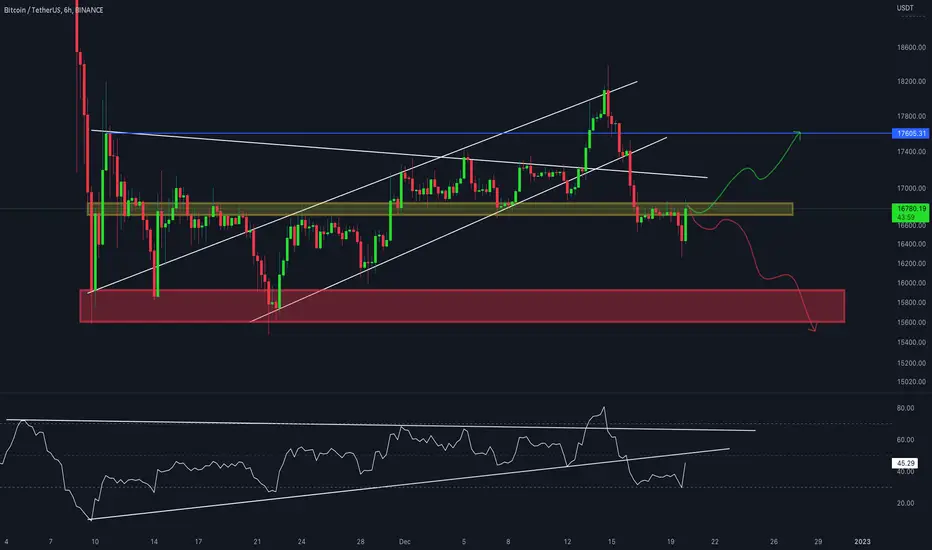
#BTC/USDT 6Hr UPDATE BY CRYPTO SANDERS Hello, welcome to this BTC /USDT 6Hr chart update by CRYPTOSANDERS.
I have tried to bring the best possible outcome to this chart.
CHART ANALYSIS:- BTC bounced back with a decent stable volume after clearing stops below the order block. Now it is facing mid-range resistance.
A reclaim over the mid-range with a retest above it would confirm a decent bullish rally in the market.
If it rejects from here, a downward move is expected toward the horizontal support of $16K, and from where we could expect an upward direction in the market.
Bitcoin is again testing the resistance area. Let’s wait to see if BTC is able to break the resistance area. There is no clear direction and we may see more sideways movement. The market needs big positive news to break the resistance levels.
This is not a piece of financial advice.
Hit the like button if you like it and share your charts in the comments section.
Thank you
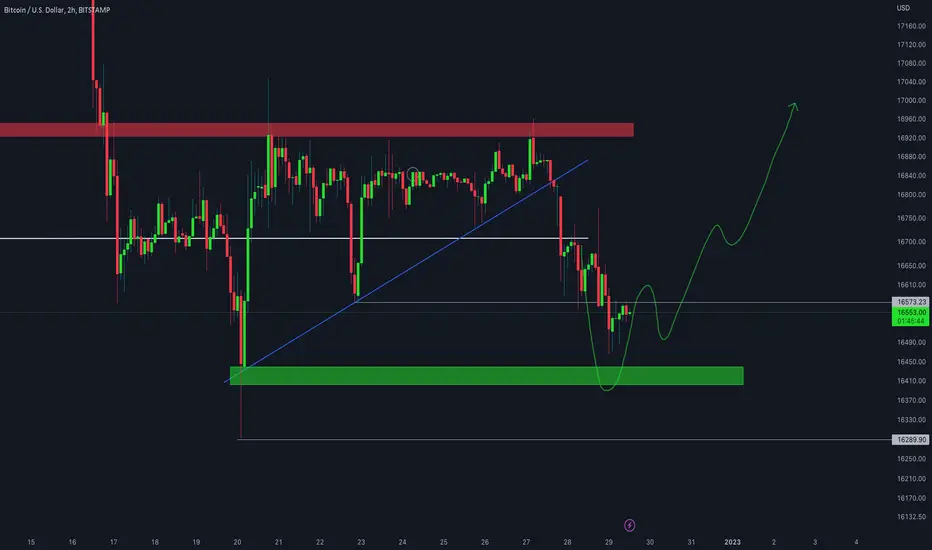
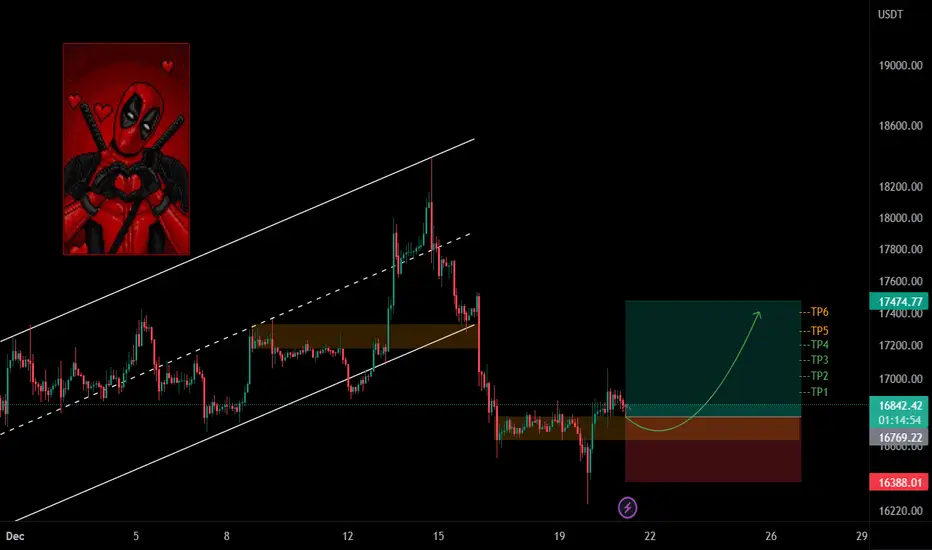
📉✌BTC 2H Long Position✌📈BINANCE:BTCUSDT
COINBASE:BTCUSD
Hello traders
💥From now, until the price is inside the yellow area, you can open a long position in two steps.
The optimum stop-loss is below the determined level.
TP1-2-3-4-5-6 are on the chart
Please share ideas and leave a comment,
let me know what's your idea.
CrazyS✌
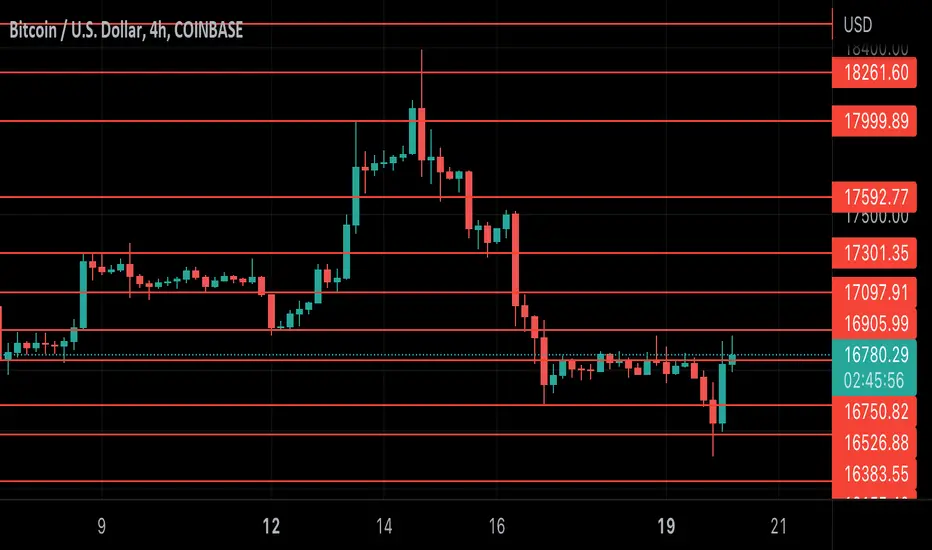
$BTC Daily Update$BTC #BTC Dipped below $16,526 support and jumped right back with bullish engulfing on last 4H close, $16,905 continues to resist as expected while current 4H struggling to follow up the bullish engulfing. If closed above $16,750 possible bullish engulfing could be expected on 1D
Unique Update Of BitcoinHello, welcome to this BTC /USD 1DAY chart update by CRYPTOSANDERS.
I have tried to bring the best possible outcome to this chart.
CHART ANALYSIS:-Bitcoin (BTC) fell below $17,000 in today’s session, as markets continued to react to last month’s retail sales data.
As retail sales in the United States disappointed, BTC/USD slipped to an intraday low of $16,997.54 earlier in the day.
This comes less than a day after prices were nearing a breakout of $18,000, hitting a peak of $17,725.88 in the process.
Looking at the chart, bearish pressure intensified following a breakout of a floor at $17,200, with the price now trading at $17,023.22.
This slight reversal comes as the 14-day relative strength index (RSI) moved close to a support point of 45.00.
The index is currently tracking at the 47.05 level, and should price strength hit the aforementioned floor, BTC could land at $16,800.
This is not a piece of financial advice.
Hit the like button if you like it and share your charts in the comments section.
Thank you
💥Bitcoin 4H Simple Outlook💥BINANCE:BTCUSDT
COINBASE:BTCUSD
First take a look at my previous analysis.
💥Channel break pattern💥
red TP -----> Long position
Green TP ----> Short position
The optimum stop-loss for both positions is on the chart
Please share ideas and leave a comment,
let me know what's your idea.
CrazyS✌
