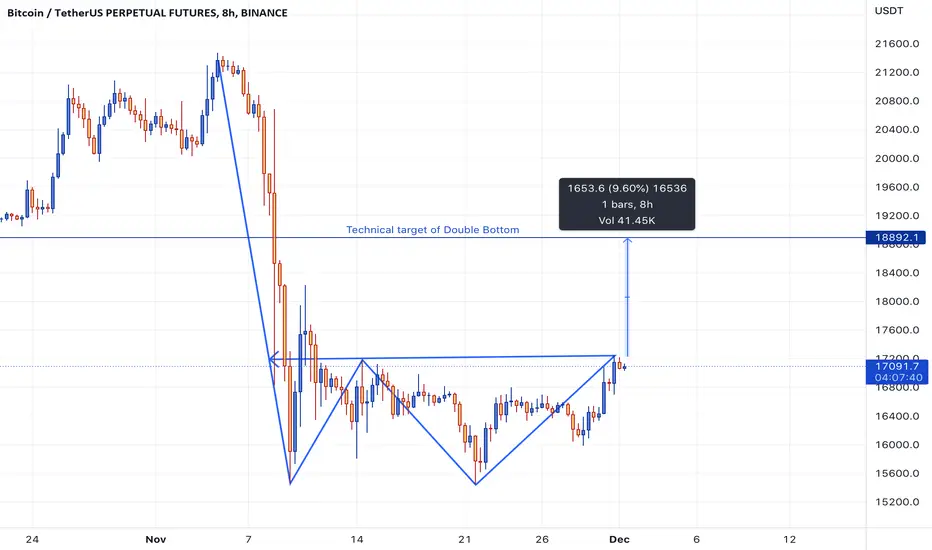
BTC bullish with double bottomWe have a double bottom pattern on 8-hour chart which is a bullish pattern, Technical target of this pattern is $18,892. Let's see if this plays out.
Btcforecast
BTC/USDT 2HOUR UPDATEHello, welcome to this BTC /USDT 1DAY chart update by CRYPTOSANDERS.
I have tried to bring the best possible outcome to this chart.
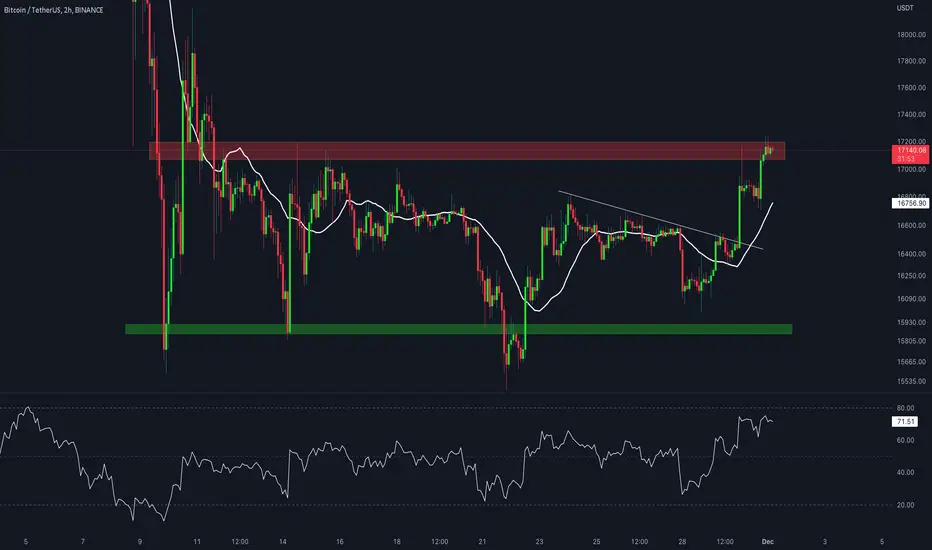
CHART ANALYSIS:-BTC bounced with a good volume after doing a breakout of the descending trendline and POC level.
The bulls are showing strength and attempting to break horizontal resistance. An effective breakout above it will affirm a push toward $18,200.
In case of rejection, a retest of the POC level or of the marked descending trendline could be a potential situation.
This is not a piece of financial advice.
Hit the like button if you like it and share your charts in the comments section.
Thank you
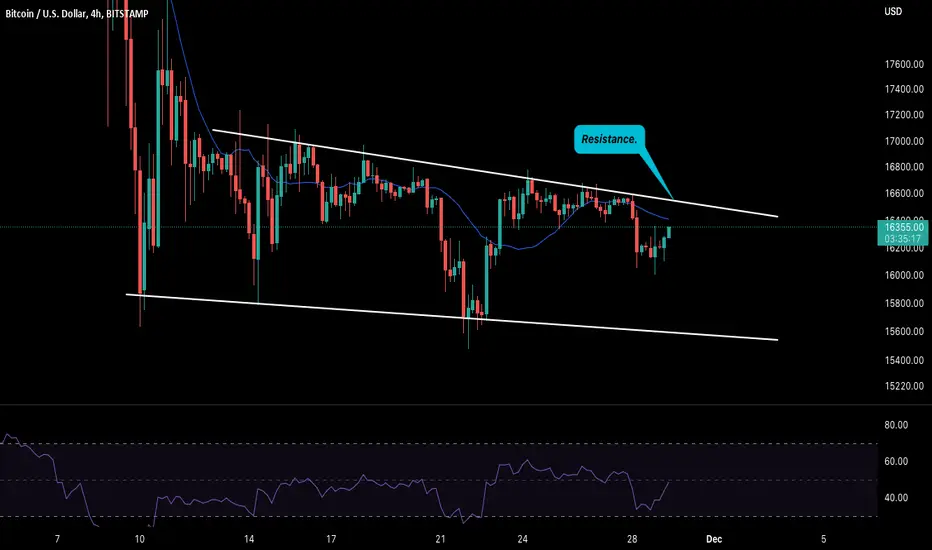
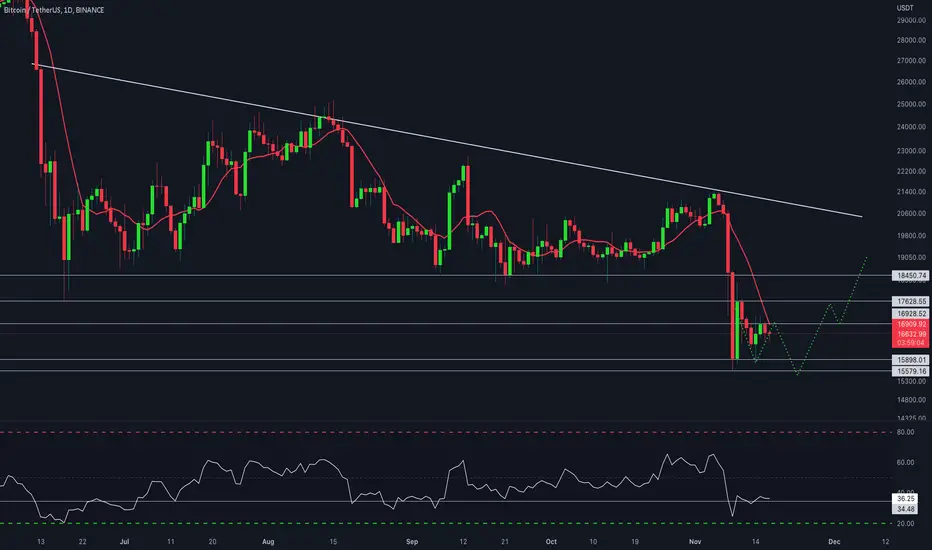
BITCOIN: STILL UNDER THE RESISTANCE.Hello traders, welcome to the new week BTC update in 4 hours timeframe.
After a 4 days sideway move around $16.5k, BTC finally moved downward with the lowest drop at $16k. The current price is trending at $16.3k but is still in danger because the resistance is at $16.5k. I am not pretty sure if BTC can break this resistance level but if it does, It could be a game changer for the market. For now, as it is under the trendline and close to the resistance, it is hard to take any long calls.
Let's see how it will end up by the end of the day. Until then trade safely.
Is this the Future for Bitcoin? $200,000, $800,000 & $2,100,000Just for fun, assuming bullmarkets and bearmarkets behave similar for the next 10 years.
I bet we will see Bitcoin at $1,000,000 By 2028-2030

Unique Update Of BitcoinHello, welcome to this BTC /USDT 1DAY chart update by CRYPTOSANDERS.
I have tried to bring the best possible outcome to this chart.
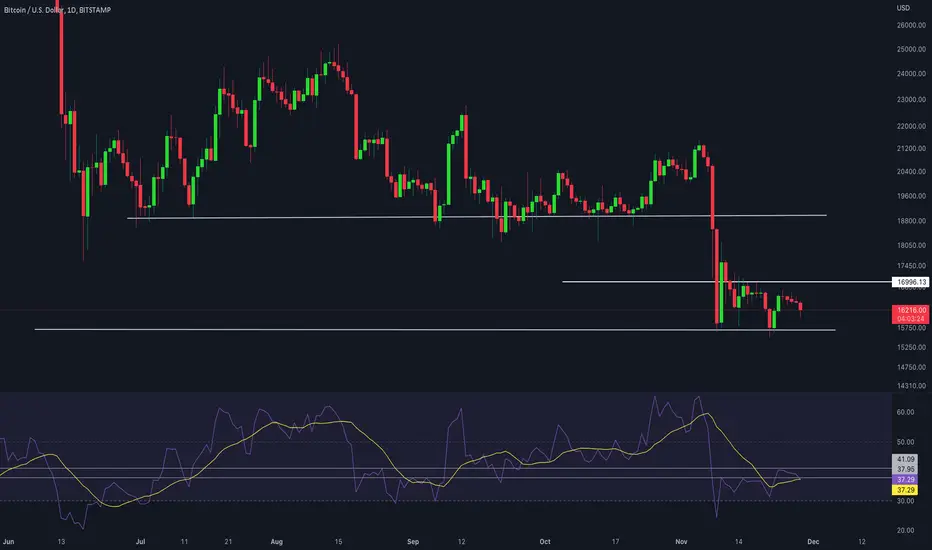
CHART ANALYSIS:-Bitcoin (BTC) fell for a fifth straight session on Monday, as the token moved closer to a breakout below $16,000.
BTC/USD slipped to an intraday low of $16,086.36 to start the week, which comes less than 24 hours after hitting a peak of $16,594.41.
As a result of today’s drop, bitcoin moved to its lowest point since last Tuesday, November 22, when the price was at a low of $15,613.
Looking at the chart, Monday’s sell-off intensified once a breakout on the relative strength index (RSI) occurred.
The index, which is currently tracking at 36.89, moved below a recent support point of 38.00 and looks to be heading for a lower floor at 35.50.
Should price strength reach its perceived destination, This will likely lead to BTC falling below $16,000.
This is not a piece of financial advice.
Hit the like button if you like it and share your charts in the comments section.
Thank you
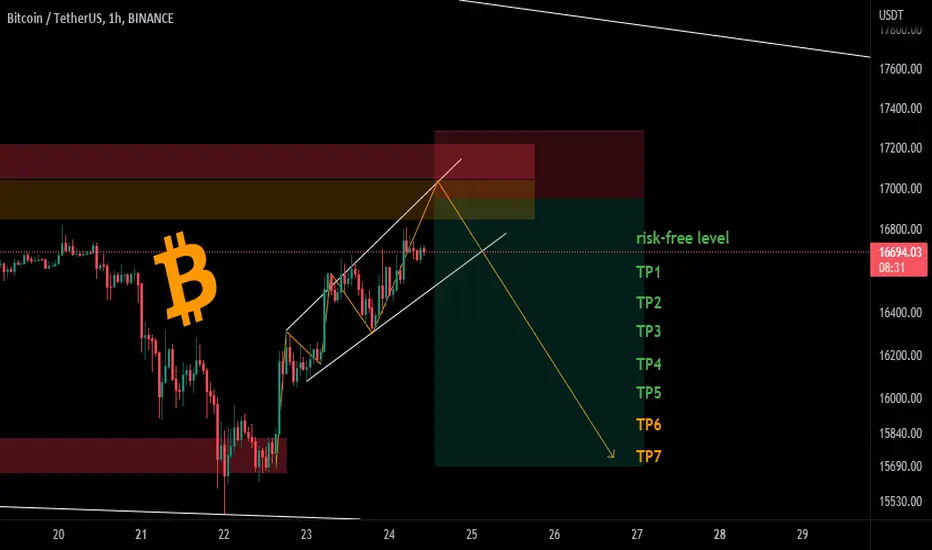
📉✌BTC 1H Long Position✌📈BINANCE:BTCUSDT
COINBASE:BTCUSD
Hi traders, first take a look at my previous analysis and positions.
💥Three Drive pattern💥
between now and the yellow area, you can open a short position in two steps.
If the price falls and reaches the risk-free level, you can risk-free the position.
TP1-2-3-4-5-6-7 are on the chart.
The optimum stop-loss is above the determined area.
Please share ideas and leave a comment,
let me know what's your idea.
CrazyS✌
LONG TERM BTCJust a few interesting things i have found, Also the bottom of the channel has recently been violated.

BTC/USDT 1DAY UPDATE BY CRYPTOSANDERSHello, welcome to this BTC /USDT 1DAY chart update by CRYPTOSANDERS.
I have tried to bring the best possible outcome to this chart.
Show some support, hit the like button, and follow and comment in the comment section. this motivates me to bring this kind of chart analysis on a regular basis.
CHART ANALYSIS:-Bitcoin (BTC) mostly consolidated on Thursday, following news that the U.S. Federal Reserve could be set to move away from its aggressive rate hike policy.
Wednesday’s FOMC minutes showed that “A substantial majority of participants judged that a slowing in the pace of increase would likely soon be appropriate.”
The news comes as inflation in the United States begins to slow down, following several back-to-back rate hikes.
Following a move to an intraday high of $16,771.48 on Wednesday, BTC/USD is trading at $16,544.58 as of writing.
Looking at the chart, this comes as the 14-day relative strength index (RSI) failed to break out of a ceiling at 40.35.
Currently, the index is trading at the 39.90 level, with momentum now moving towards a downtrend, and in particular to a floor of 38.00.
This is not a piece of financial advice.
Hit the like button if you like it and share your charts in the comments section.
Thank you

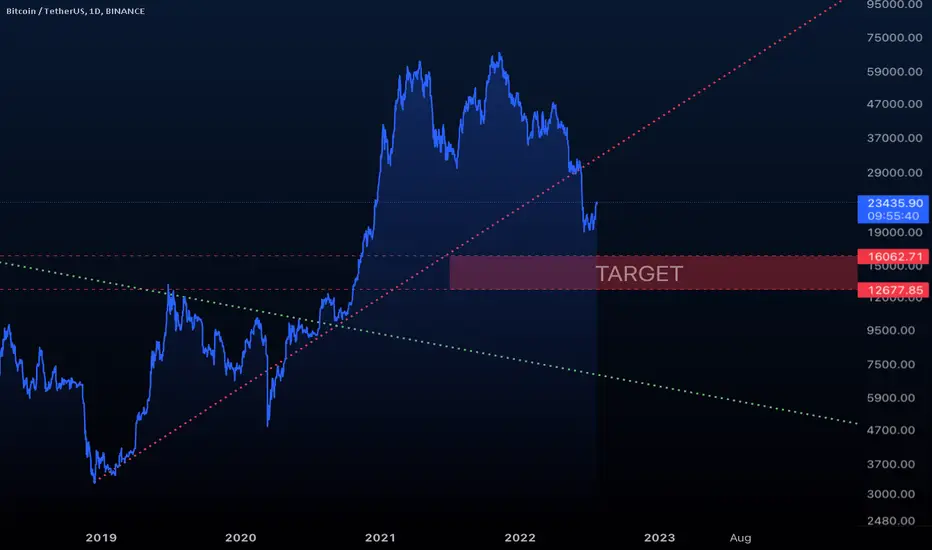
BTCUSDT - The father of the Targets is marked The main target for BTCUSD is marked above.
Until then I would not long any crypto assets for long term.
In short term , possibly it will start before the end of this weekend, the price of BTC will drop significantly.
Not financial advise, my view of the the market.
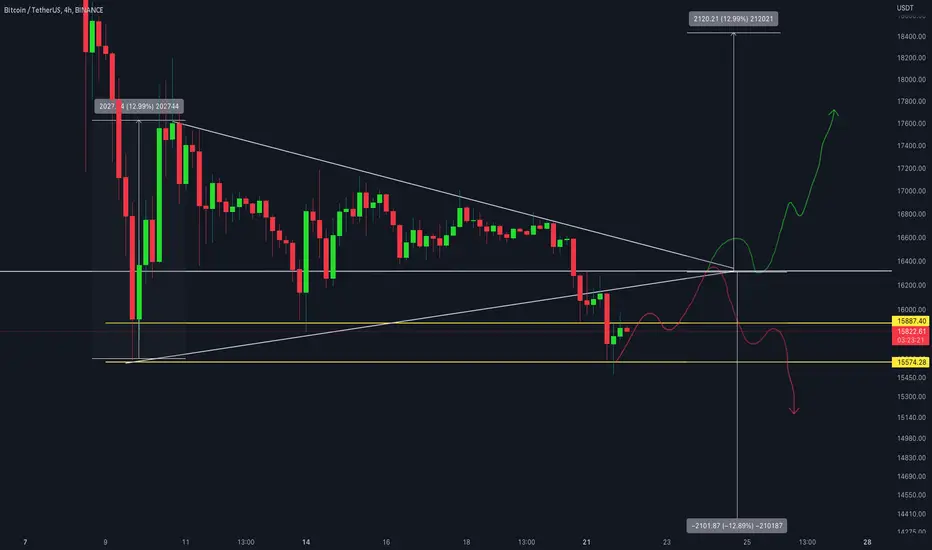
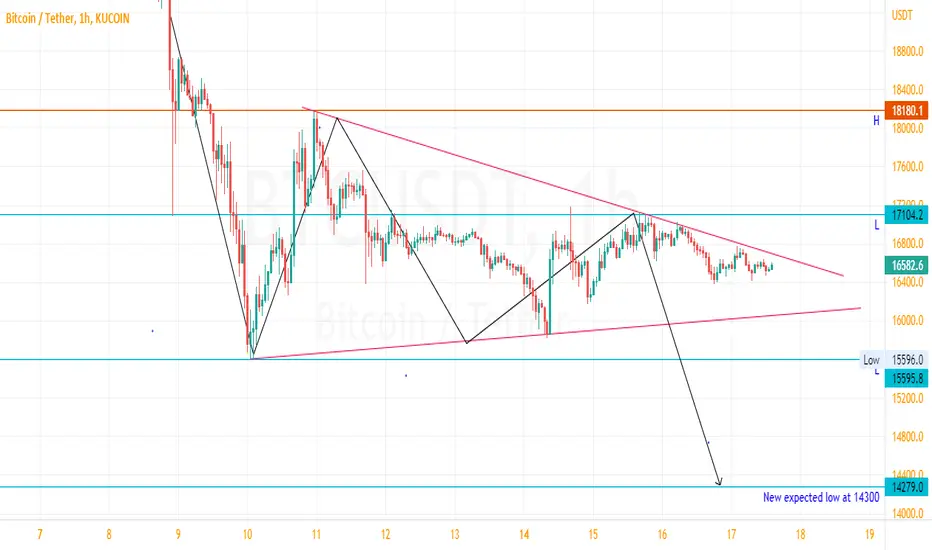
BTC/USDT 4HOUR UPDATEHello, welcome to this BTC/USDT 4Hr chart update by CRYPTOSANDERS.
I have tried to bring the best possible outcome to this chart.
Show some support, hit the like button, and follow and comment in the comment section. this motivates me to bring this kind of chart analysis on a regular basis.
CHART ANALYSIS:- The two critical levels here are $18.5K and $14.3K. As demonstrated by the red and green hues, a break from any side followed by a small pullback can define the trend’s direction.
Technically, this pattern is frequently interpreted as a continuation. As a result, because the trend is downward, technical analysts anticipate the negative trend will continue. However, present volatility is driven more by the news. Therefore, it is preferable to pay close attention to the given horizontal levels.
This is not a piece of financial advice.
Hit the like button if you like it and share your charts in the comments section.
Thank you
BTC/USDT 1DAY UPDATE BY CRYPTOSANDERSHello, welcome to this BTC /USDT 1DAY chart update by CRYPTOSANDERS.
I have tried to bring the best possible outcome to this chart.
Show some support, hit the like button, and follow and comment in the comment section. this motivates me to bring this kind of chart analysis on a regular basis.
CHART ANALYSIS:-Bitcoin (BTC) slipped below $16,000 to start the week, as volatility in cryptocurrency markets continued to rise.
Following a high of $16,590.42 on Sunday, BTC/USD dropped to an intraday low of $15,943.14 earlier today.
The move pushed the world’s largest cryptocurrency to its lowest point since November 14, when prices fell below a key support point of $16,200.
Looking at the chart, BTC continued to trade below this point of support in today’s session, with the 14-day relative strength index (RSI) also hovering near a floor of its own.
The index is currently tracking at the 32.79 level, which is marginally below a key support point of 33.00.
Should this decline continue, we will likely see bitcoin bears attempt to take the token toward a lower floor of $15,600.
This is not a piece of financial advice.
Hit the like button if you like it and share your charts in the comments section.
Thank you

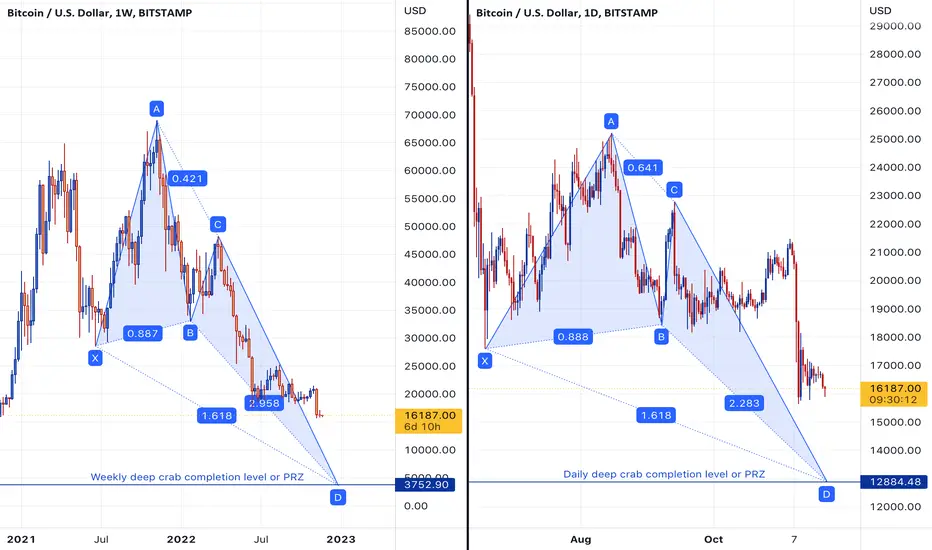
Bullish deep crab harmonic on btcBTC is developing bullish deep crab harmonic on a daily chart which will complete at $12,884 which is its PRZ(Potential Reversal Zone). Price will bounce back from this level to the upside.
On a weekly chart we have another bullish deep crab harmonic developing which will complete at $3,752. Remember this is a weekly chart so it can take months to complete but looks less likely that we will see BTC price to see bottom of 2018 but considering world's financial crisis ANYTHING can happen to crypto because crypto is MOST volatile of all financial markets in the world.
We will see good days next year summers In sha Allah.
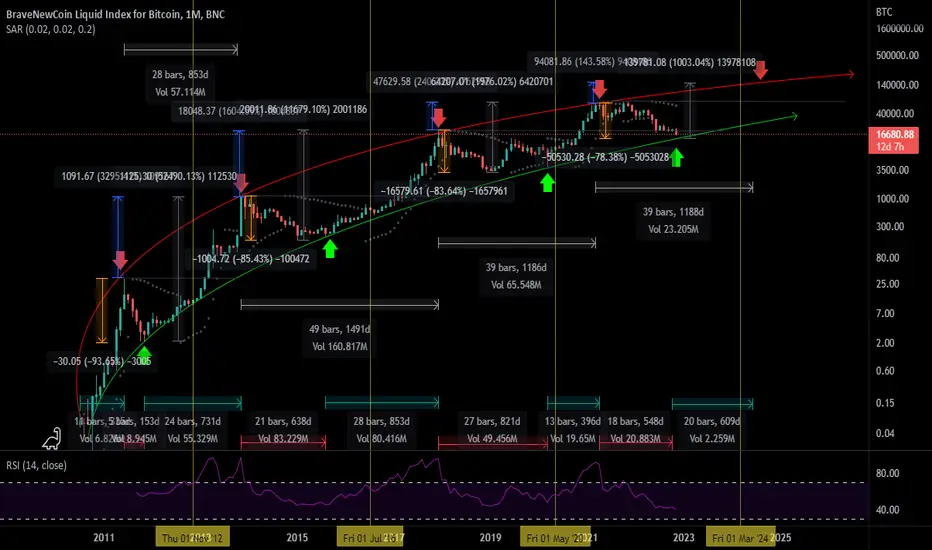
BITCOIN - Bear Market about to endAs with every bearish cycle, panic is reigning in the crypto world right now. And for this very reason it seems appropriate to make this analysis that, hopefully, will shed a ray of sunlight on the fearful ones. Since there is a lot to work with, I will divide the analysis into 3 parts (please note that this is macrocyclical trend analysis but fundamental analysis has not been considered).
The material in this publication has no regard to the specific investment objectives, financial situation or particular needs of any viewer. This publication is presented solely for informational and entertainment purposes and is not to be construed as a recommendation, solicitation or an offer to buy or sell / long or short any securities, commodities, cryptocurrencies or any related financial instruments. Nor should any of its content be taken as investment advice. Trading and investing is extremely high risk and can result in the loss of all of your capital. Any opinions expressed in this publication are subject to change without notice.
1) Cycle Duration: Bearish cycle & Bullish cycle
2) Bear cycle bottom & Current bear market correction
3) Bull cycle top & Next bull cycle gains
1) Cycle Duration
Bearish cycle : If we measure the duration of the previous bearish cycles, we can see that the 1st cycle lasted around 150 days, the 2nd cycle lasted around 640 days, and the 3rd one lasted near 820 days. If we average them we can estimate a duration of 550 days for the current bearish cycle. As a result, we can infer a high degree of probability that we'll touch the bottom within the 4th quarter of 2022.
Bullish cycle : If we measure the number of days between the maximums of each cycle, we obtain an average of 1180 days. With this result we can infer that the next cycle top will be around June 2024. On the other hand, measuring the duration of the bullish cycle of each macro cycle, we obtain an average of 600 days per cycle. Which allows us to forecast that the next bullrun will be between the 4th quarter of 2022 and the end of 2023 1st semester.
2) Bear cycle bottom & Current bear market correction
Bear cycle bottom : The first bitcoin correction was about 93%, the 2nd one was near 85%, and the 3rd one was arround 83%. On average, bitcoin corrections have been reducing by 5 points per cycle, so we can infer that the current correction can reach approximately 73%. The price bottom we obtain with these calculations is roughly $14,000
3) Bull cycle top & Next bull cycle gains
Bull cycle top : As in all markets, as the market capitalization of an asset increases, the amount of money that needs to be injected to produce a significant price movement also increases. Therefore, in percentage terms, we can expect the profit level of the next bullrun to be lower than the previous one. In total terms, the 1st bullrun saw a rise of around 52,000%, the 2nd bullrun rise was close to 12,000%, while the 3rd rise was close to 2,000%. With this movement patterns it's fair to assume that the gains porcentage will be lower, so we infer gains of up to 1,000% for the next bullrun. The price top we obtain with these calculations is roughly $150,000
I hope you enjoy this review and found it useful. Or, at least, that this helps to give that little push needed for trend reversal.
Cheers!
#BTC/USDT 1DAY UPDATE BY CRYPTO SANDERS Hello, welcome to this BTC USDT 1DAY chart update by CRYPTOSANDERS.
I have tried to bring the best possible outcome to this chart.
Show some support, hit the like button, and follow and comment in the comment section. this motivates me to bring this kind of chart analysis on a regular basis.
CHART ANALYSIS:-Bitcoin (BTC) fell for a second straight day, as markets continued to react to the latest U.S. retail sales report.
Following the better-than-expected increase in consumer spending, BTC/USD slipped to a low of $16,430.11 earlier in today’s session.
The drop comes a day after the token was at a high of $16,726.44, but it now seems to be heading for a recent price floor.
Looking at the chart, this support point appears to be at the $16,200 level, which has been the last line of defense prior to the token moving below $16,000 in recent days.
A positive for long-term bulls is that the 10-day (red) moving average looks as though it has somewhat exhausted its downward momentum, with a shift in sentiment potentially in the cards.
Should an upcoming floor of 34.00 on the relative strength index (RSI) hold firm, then we could see BTC bulls begin to buy this current dip.
This is not a piece of financial advice.
Hit the like button if you like it and share your charts in the comments section.
Thank you
BTC Short BTC has loosened its momentum and leading toward another low. See chart for more detail. I assure you that BTC will make another low in the coming days so be careful with your longs.
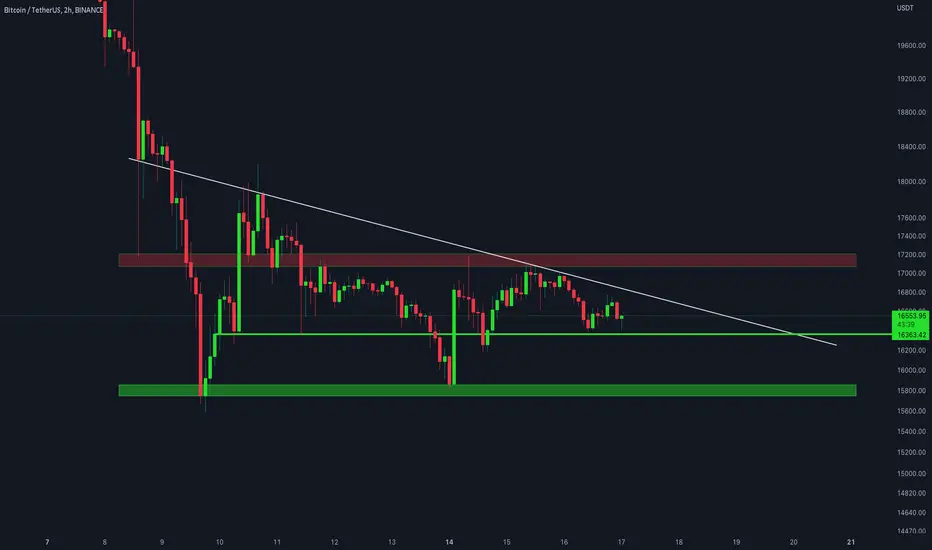
BTC/USDT 4HOUR UPDATEHello, welcome to this BTC USDT 4Hr chart update by CRYPTOSANDERS.
I have tried to bring the best possible outcome to this chart.
Show some support, hit the like button, and follow and comment in the comment section. this motivates me to bring this kind of chart analysis on a regular basis.
CHART ANALYSIS:-BTC got rejected from the horizontal resistance. There is uncertainty on the lookout and the volume is extremely less.
The short-term range of BTC is from $15.6K to $17.1K. A strong breakout above $17.1K would confirm a push toward the bearish order block around $18.5K, which is the fundamental level for bulls to break for the mid-term bullish affirmation.
A sustained breakdown of $15.6K support would confirm one more leg down in the market toward the $14K to $12K zone, and that could be the end of the corrective waves.
This is not a piece of financial advice.
Hit the like button if you like it and share your charts in the comments section.
Thank you
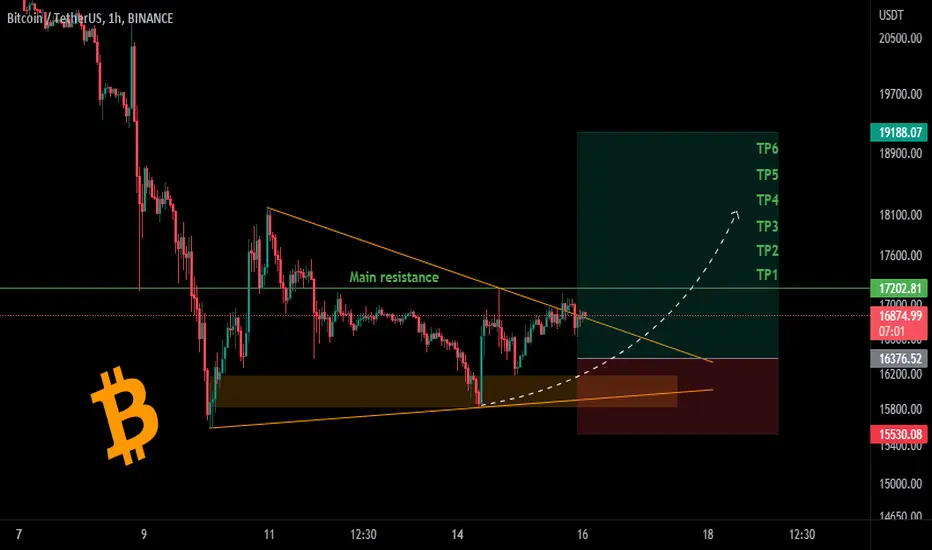
📉✌BTC 1H Long Position✌📈BINANCE:BTCUSDT
COINBASE:BTCUSD
Hello, first look at my previous analysis (linked below).
between now and the yellow area below, you can open long position in two steps.
If the price reaches the TP1, you can risk-free the position.
TP1-2-3-4-5-6 are on the chart.
The optimum stop-loss is on the chart.
Please share ideas and leave a comment,
let me know what you think.
CrazyS✌
#BTC/USDT 4HOUR UPDATE !!Hello, welcome to this BTC USDT 4Hr chart update by CRYPTOSANDERS.
I have tried to bring the best possible outcome to this chart.
Show some support, hit the like button, and follow and comment in the comment section. this motivates me to bring this kind of chart analysis on a regular basis.
CHART ANALYSIS:-Bitcoin bounced from the hourly support. BTC needs to break the $18,000-$18,500 area to get some momentum. We may see some sideways move from $16,000-$18,000 for the next few days.
This is not a piece of financial advice.
Hit the like button if you like it and share your charts in the comments section.
Thank you
Bitcoin today - (SP500 and Dollar charts as well)Wishes for a nice week everyone.
FTX has made bad headlines and serious damage to crypto but hey: we have seen and surviced this one too many times before!
For the time being:
early Monday pump not too likely to continue.
Watch the video for my TA and key levels for BTC, SP500 and Dolalr index.
One Love,
The FXPROFESSOR

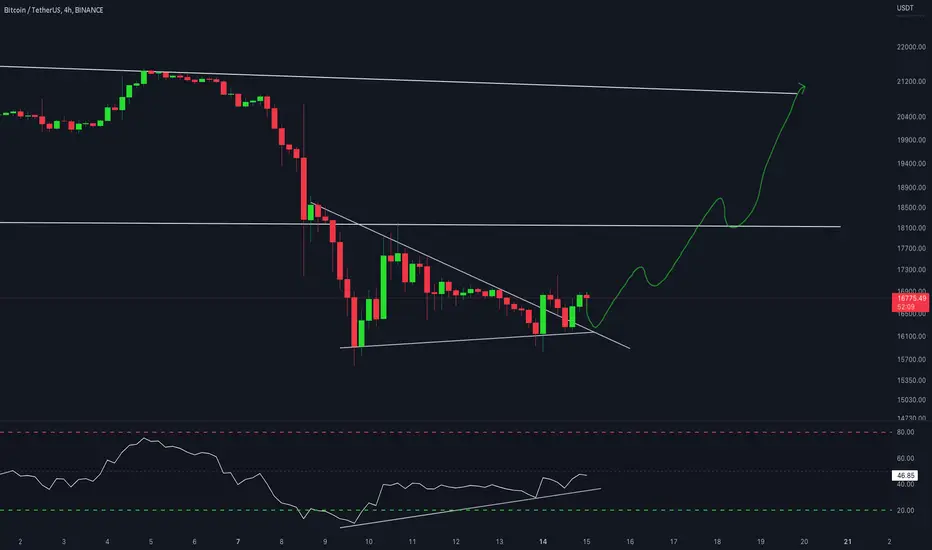
btcusdtin daily tf forming falling wedge chart pattern with rsi divergance
incase of upsife breakout expecting move towards 27 to 28k
this is not financial advice do your own research before taking any action

BTC/USDT 1DAY UPDATE BY CRYPTOSANDERSHello, welcome to this BTC USDT 1DAY chart update by CRYPTOSANDERS.
I have tried to bring the best possible outcome to this chart.
Show some support, hit the like button, and follow and comment in the comment section. this motivates me to bring this kind of chart analysis on a regular basis.
CHART ANALYSIS:-The $18K level had been supporting the price for several months. However, Bitcoin was recently rejected and experienced a massive shakeout, plunging beneath it following massive bearish momentum.
The market has likely entered a new consolidation range as the price dropped significantly. Nevertheless, during this phase, the price might retest the $18K level and the broken trendline in the form of a pullback and then continue the bearish trend toward the $11.600 level.
This is not a piece of financial advice.
Hit the like button if you like it and share your charts in the comments section.
Thank you

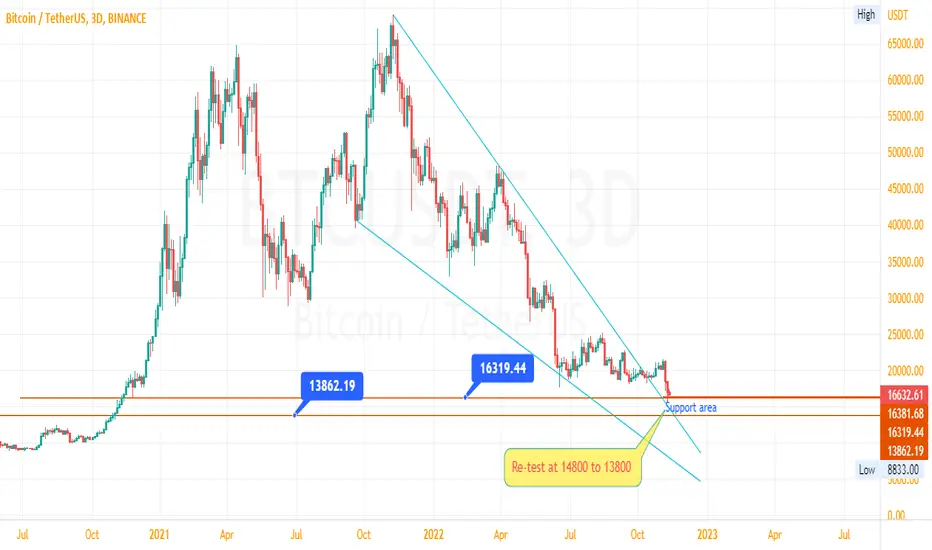
BTC Forecast BTC broke the falling wedge in a 3D time frame earlier and now it is testing the upper line of the falling wedge. Currently, we have a strong support area at 16300 and if BTC breaks this support then we can expect a price at 14800 - 13800 in the coming days/weeks
Strong Sell Signal for Bitcoin. Road to 14k.I analyze daily and weekly timeframe. Here are the list why bitcoin will go down:
1. 100 SMA and 25 SMA is my indicator for reversal. It the recent rally, the 100 SMA and 25 SMA failed to cross for bullish reversal.
2. Support lines are drawn in my chart. It currently breaks the support line in 17.5k-18k area.
It is headed for the next support of 14k. If you zoom out the chart and look for weekly chart. You can see a support at 14k in June 2019.
3. -DI is above the ADX and the slope of ADX is high. I also based the strength of the trend based on the slope of the ADX.
I look for 14k if there is possible big rally or bounce. I will take profit if the -DI goes below the ADX and wait for further reversal signal.
