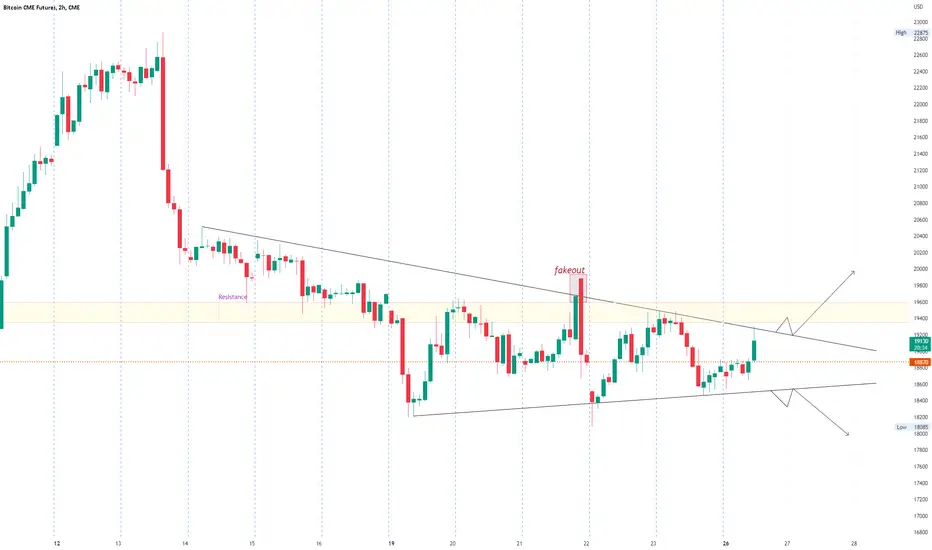
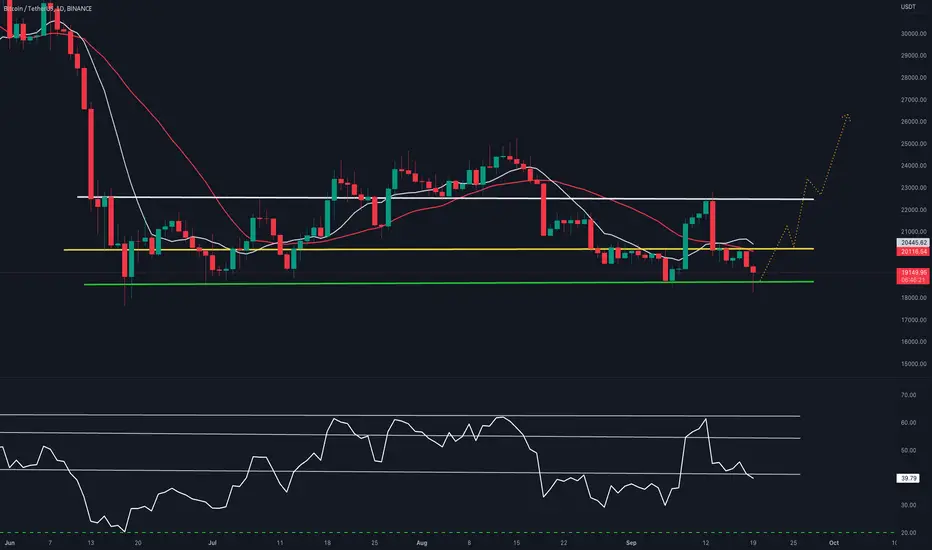
BTC Market Analysis 09/2022BTC moving in a symmetrical triangle. There is a tug of war between bulls and bears. Complete indecision in the market. Weekly close is near high volatility can be seen.
In order to decide for orderbooks we have to keep an eye on a successful breakout with a good volume or a retest, which will confirm the next move of BTC. Currently its swinging between the weekly close and high.
Currently the DXY is moving to higher highs which has a complete reverse effect on BTC movement, so we have to keep a look on DXY too because Bitcoin moves completely in opposite direction to DXY & we all know whats happening with US $.
Best of luck!
Btcforecast
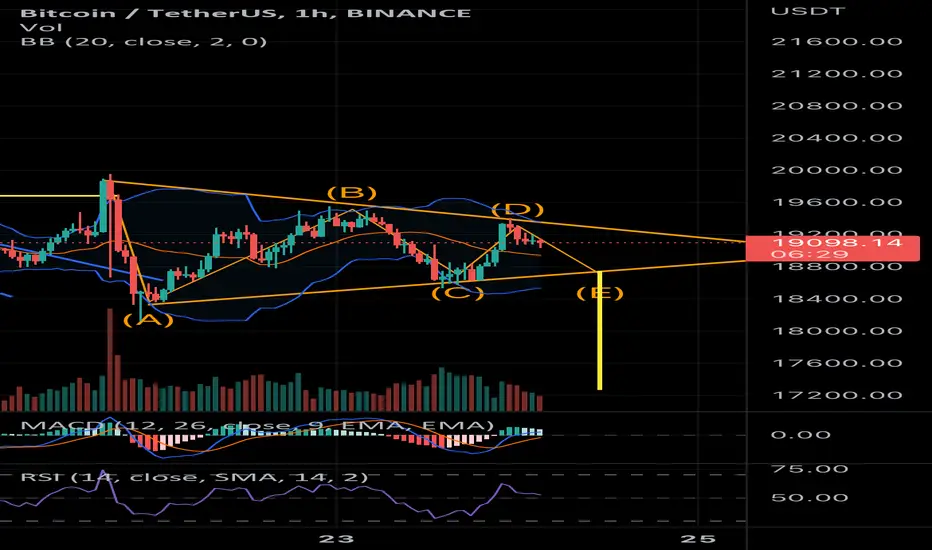
Symmetrical Triangle 1hr TimeframeBearish Bias Scenario
Short term 1 hour time frame
We need mad volume to determine
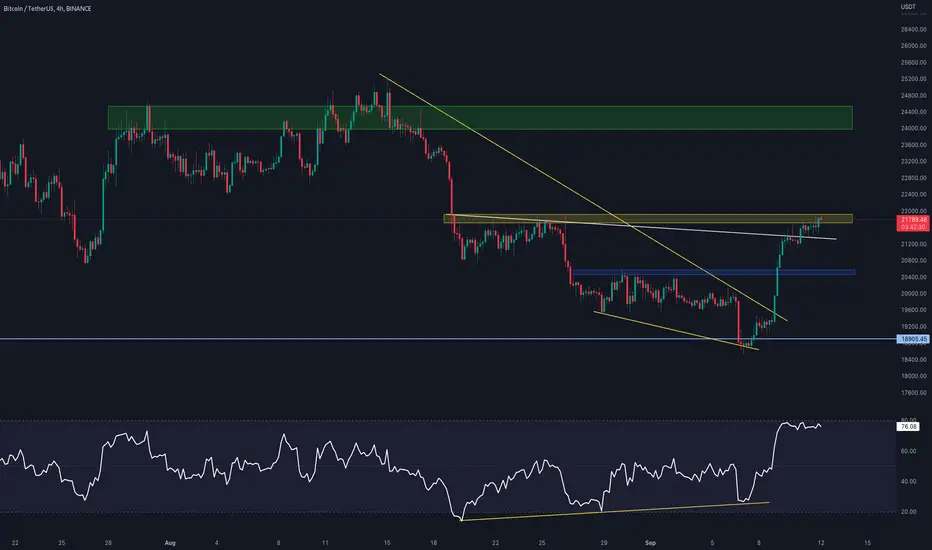
BTC/USDT 4HOUR UPDATEHello dear traders, we here new so we ask you to support our ideas with your LIKE and COMMENT, also be free to ask any question in the comments, and we will try to answer for all, thank you, guys.
BITCOIN UPDATE: -The price has been fluctuating in a tight range between $18K and $20K in the last few days, preparing for the next crucial move.
A double bottom pattern has been formed at the $18K level recently, which could push the price towards $20K once more. In the event of a bullish breakout, both $22,500 and $24K would be key resistance levels to watch in this timeframe.
The RSI indicator is also in a state of equilibrium, as recently, it has been oscillating around 50. The bulls and bears are currently struggling to take control, and the market could break out in either direction.
However, considering the higher timeframe bearish trend, a breakdown below $18K is still the more probable scenario.
Sorry for my English it is not my native language.
Hit the like button if you like it and share your charts in the comments section.
Thank you
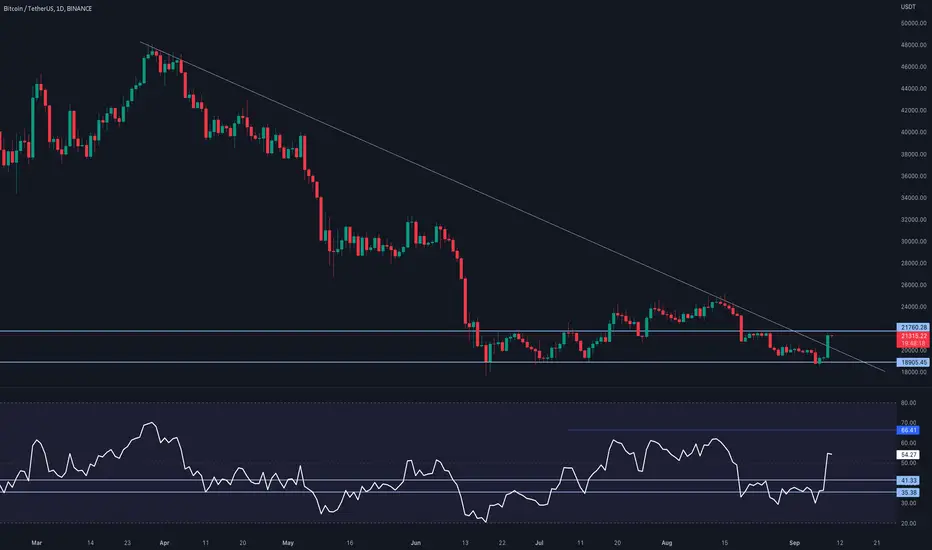
BTC/USDT 1DAY UPDATE BY CRYPTOSANDERSHello dear traders, we here new so we ask you to support our ideas with your LIKE and COMMENT, also be free to ask any question in the comments, and we will try to answer for all, thank you, guys.
BITCOIN UPDATE: - Daily chart, the price failed to break the significant bearish trendline last week. The 50-day and 100-day moving average lines located near the $22K level also played their part in pushing the price to the downside.
Currently, the market is testing the $18K support area for the third time. However, considering the overwhelming bearish momentum, a break below this significant level is likely.
In this case, Bitcoin would record a new lower low in the current bear market, and the price could drop towards the $15K area and potentially further downward in the short-term. The crash would also further prolong the duration of the bear market and bring it close to a full year.
Sorry for my English it is not my native language.
Hit the like button if you like it and share your charts in the comments section.
Thank you
BTC/USDT 1DAY UPDATE BY CRYPTOSANDERSHello dear traders, we here new so we ask you to support our ideas with your LIKE and COMMENT, also be free to ask any question in the comments, and we will try to answer for all, thank you, guys.
BITCOIN UPDATE: -Bitcoin (BTC) fell to a four-month low to start the week, as bearish sentiment remains high in crypto markets.
BTC/USD slipped to an intraday low of $18,390.32 earlier in the day, following a floor breakout at $18,645.
The drop saw bitcoin hit its weakest point since June 18, the last time this support level was also broken. Many believe the decline comes ahead of this week’s U.S. Federal Open Market Committee meeting, where interest rates are expected to be hiked.
Looking at the chart, Monday’s sell-off comes as the 14-day relative strength index (RSI) fell below a floor of its own at 41.30.
As of writing, the token is trading below 38.00 and is currently in oversold territory, which could be a positive for those anticipating an eventual turnaround.
Sorry for my English it is not my native language.
Hit the like button if you like it and share your charts in the comments section.
Thank you
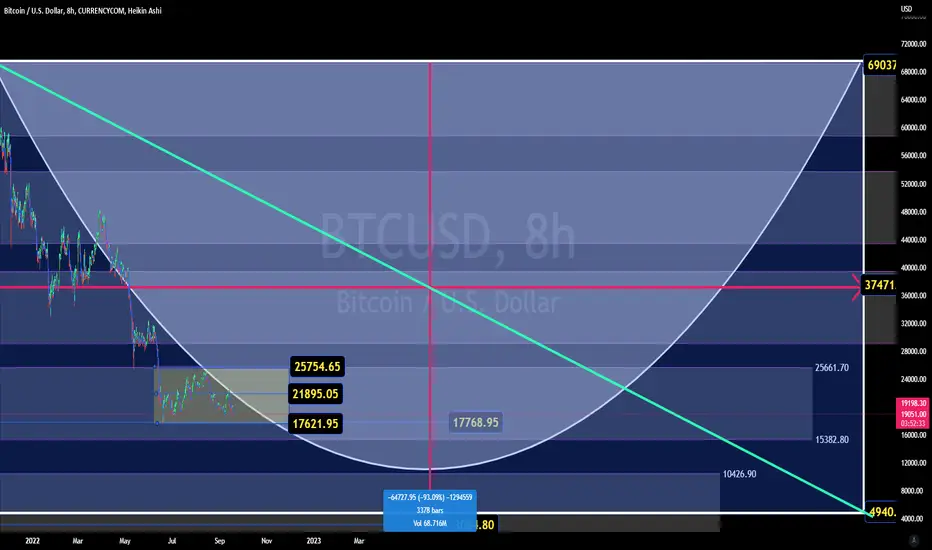
BTC Range focus and drop accumulation setup within the cup drop. Set it for a drop correction of 93 percent could drop down to 84 percent before a reversal just setting worst case scenario if we fail to hold 17k drop to 12-13k and w alot of panic could cause a drop to the lower range.
BTC dropped heavily during CPI news. We'll take short if a pullbBTC dropped heavily during CPI news. We'll take short if a pullback to 22 000 - 22 300 happens

BTC/USDT 4HOUR UPDATEHello dear traders, we here new so we ask you to support our ideas with your LIKE and COMMENT, also be free to ask any question in the comments, and we will try to answer for all, thank you, guys.
BITCOIN UPDATE: - 4-hour timeframe, the price broke above the $22.7K resistance level a few days ago but failed to hold above it and dropped back below fairly quickly.
The massive drop has paused at the $19.5K support level for now. However, the market structure looks bullish at the moment, and a $21.7K seems probable.
In this case, the $17.6K area could be tested once again to determine whether Bitcoin would make a new lower low or not.
This is not a piece of financial advice. All investment made by me is at my own risk and I am held responsible for my own profit and losses. So, do your own research before investing in this trade.
Sorry for my English it is not my native language.
Hit the like button if you like it and share your charts in the comments section.
Thank you

#BTC/USDT 1DAY UPDATE !!Hello dear traders, we here new so we ask you to support our ideas with your LIKE and COMMENT, also be free to ask any question in the comments, and we will try to answer for all, thank you, guys.
BITCOIN UPDATE: -bitcoin (BTC) was trading lower in today’s session, as markets continued to react to the latest U.S. inflation report.
Following a peak of $22,673.82 on Tuesday, BTC/USD dropped to an intraday low of $19,497.67 earlier today.
Markets had expected August’s consumer price index (CPI) to come in at 8.1%, down from 8.5% the month prior.
However, with the CPI coming in at 8.3%, traders’ confidence faded, leading to a bloodbath across the crypto market.
Looking at the chart, this sell-off took place following a false breakout of the $22,600 resistance point, with prices now hovering around a key support point.
As of writing, BTC/USD is trading at $20,164.21, which is marginally below a floor of $20,600.
Should bearish sentiment remain throughout the day, we could potentially see traders target a lower support level of $19,300.
This is not a piece of financial advice. All investment made by me is at my own risk and I am held responsible for my own profit and losses. So, do your own research before investing in this trade.
Sorry for my English it is not my native language.
Hit the like button if you like it and share your charts in the comments section.
Thank you

#BTC/USDT 1HOUR UPDATE !!Hello dear traders, we here new so we ask you to support our ideas with your LIKE and COMMENT, also be free to ask any question in the comments, and we will try to answer for all, thank you, guys.
BITCOIN UPDATE: -As we are seeing in btc that btc got dumped suddenly by forming a Bart pattern and we are now seeing RSI bullish in btc so from here we expect that btc should be pumped what do you think do tell in the comment section
This is not a piece of financial advice. All investment made by me is at my own risk and I am held responsible for my own profit and losses. So, do your own research before investing in this trade.
Sorry for my English it is not my native language.
Hit the like button if you like it and share your charts in the comments section.
Thank you

BTC making 2 bullish shark harmonicsLeft Chart : We a have a bullish shark harmonic in process of developing which will complete at $17,870 level, Invalidation or stop-loss for this will be $17,032. If this level breaks down then we will possibly stop at $13k-$15k levels although I still feel we won't go down that further but anything can happen in crypto.
Right Chart : Bullish shark harmonic identified on a daily chart which is in play at the moment, Invalidation point is $17,994 and near to that another 🦈 will complete.
So we have 2 confluences for bullish price action and I know most people would find it funny but in these dark times we do need something positive. Lets see what unfolds in coming weeks.

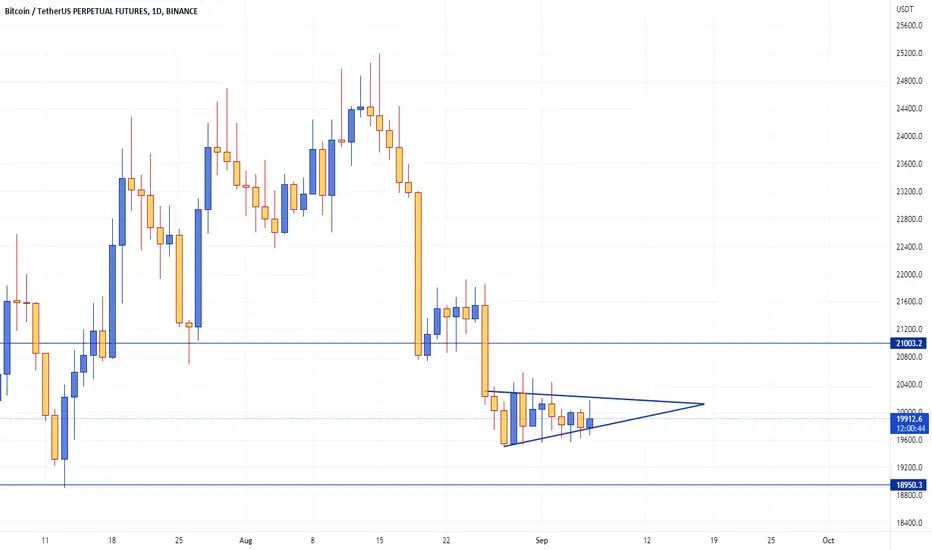
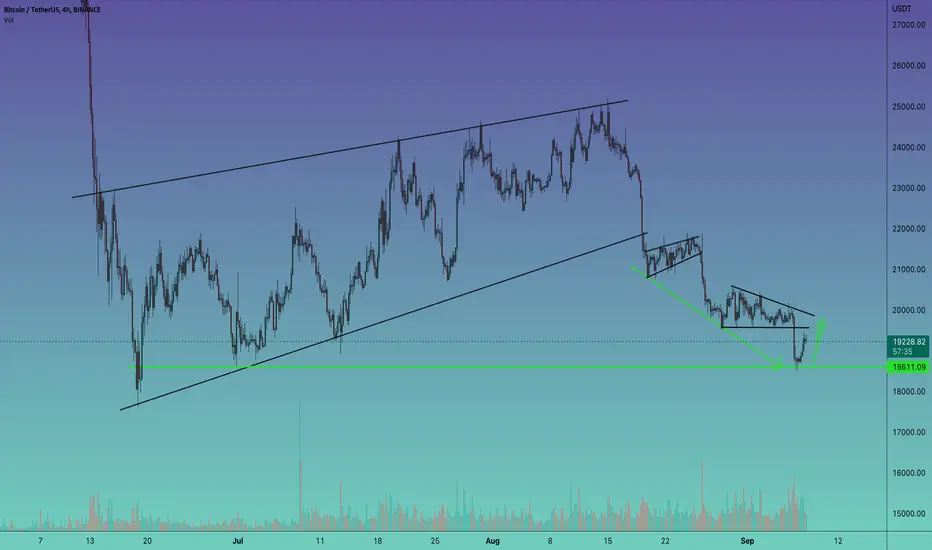
Bitcoin moving in symmetrical triangleBitcoin is moving inside a symmetrical triangle on a daily chart. Break down target is $18,950 and breakout target is $21,003
Price has been ranging between $19650 to $20400 for over 11 days now. This is considered as a boring market. People are mostly longing from support and shorting from resistance.
We will soon see a move on either side because we have some events lined up in coming weeks
Sept 13: CPI data
Sept 15: ETH merge
Sept 21: FOMC rate hike decision
September is considered as one of the worse month in crypto, But we know BTC goes opposite of the herd mentality
Most of the people are of the opinion that we will see $13K, You can't just out-rightly say this. You have to go from level to level. Firstly we need to break down from $19500 level to see $17K which is a strong level to break. It would be catastrophe for crypto if we go below this level, Like I said bottom is in already and we will consolidate for 2-3 months maximum before moving to the next cycle.
Stay patient because you have survived this bear market so you will reap rewards of bull market.
BTC/USDT 1DAY UPDATE !!Hello dear traders, we here new so we ask you to support our ideas with your LIKE and COMMENT, also be free to ask any question in the comments, and we will try to answer for all, thank you, guys.
BITCOIN UPDATE: -Bitcoin (BTC) rose for a sixth straight session to start the week, as sentiment in cryptocurrency markets remained mostly bullish.
BTC/USD rose to a high of $22,244.38 earlier in today’s session, less than 24 hours after trading at a low of $21,493.03.
Today’s rally sees the token now up by over 12% in the last seven days, with some expecting further surges this week.
Looking at the chart, the recent bullish momentum has led to price strength moving towards the overbought territory.
As of writing, the 14-day relative strength index (RSI) is currently tracking at 59.67, and this comes following a recent breakout of the 55.40 resistance point.
In addition to this, the 10-day (red) moving average is now on the cusp of a cross with its 25-day (blue) counterpart, which could signal further surges in price.
This is not a piece of financial advice. All investment made by me is at my own risk and I am held responsible for my own profit and losses. So, do your own research before investing in this trade.
Sorry for my English it is not my native language.
Hit the like button if you like it and share your charts in the comments section.
Thank you
Bull Market Coming Soon? 🚨💸 BTCUSD analysishey there!
basically bitcoin now is in a very important area that will be responsible for the move over the next few month.
if the price breaks through the blue trend-line it will target the white trend-line (area 28000-30000).
if it failed to break we will be targeting 12000-140000.

BTC: Nothing changed, I am still bullish I have drawn this chart long time ago and I decided to publish after long time without publishing my own work!
Anyway, I am still bullish on BTC
The classical upside channel is still valid so long as 17400-17300 territories remain unbroken !
BTC/USDT 4HOUR UPDATE !!Hello dear traders, we here new so we ask you to support our ideas with your LIKE and COMMENT, also be free to ask any question in the comments, and we will try to answer for all, thank you, guys.
BITCOIN UPDATE: - BITCOIN 4-hour chart, The price has broken above both the bearish trendline and the $20,500 level after rebounding from the $18K area.
Currently, the cryptocurrency is testing the $22K resistance level, and a bullish breakout from this level would pave the way toward $24K. However, the trend seems over-extended. This suggests a bearish pullback toward the $20,500 level – which has now turned into support.
Additionally, the RSI indicator, which had been signaling a massive bullish divergence before the reversal, is now demonstrating a clear overbought signal with values above 70%. This further boosts the probability of a short-term pullback.
This is not a piece of financial advice. All investment made by me is at my own risk and I am held responsible for my own profit and losses. So, do your own research before investing in this trade.
Sorry for my English it is not my native language.
Hit the like button if you like it and share your charts in the comments section.
Thank you
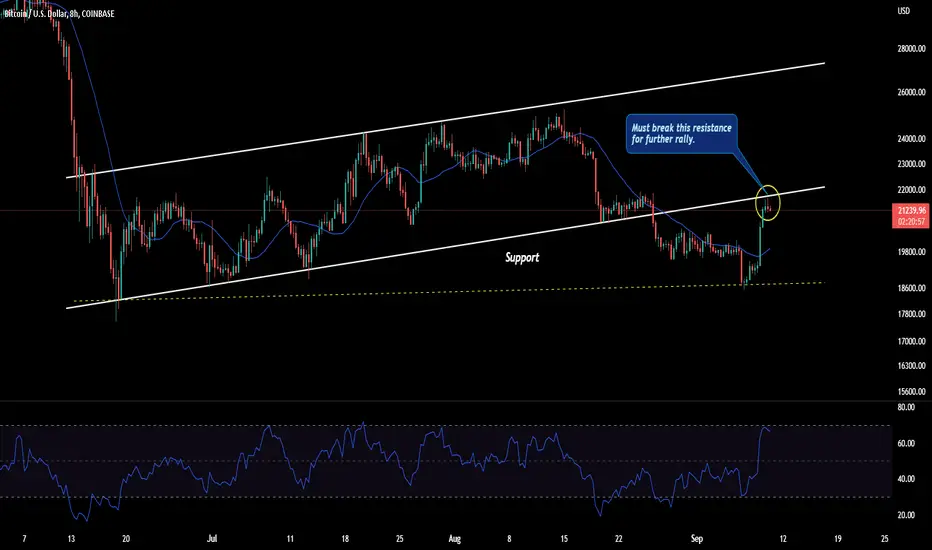
BITCOIN: STILL NOT BULLISH!!!Hello traders, I hope you guys are doing good. Here's a quick update on BTC in a lower timeframe.
Timeframe: 8 hours.
Update: BTC is still not bullish. It did perfectly bounce back from the $18.5k to $19k support level but currently, it is struggling to break above the $22k resistance level. If BTC fails to break above this level then we can expect another drop in the market. The RSI is already close to the overbought zone.
Conclusion: BTC is still in a critical zone. Holding leverage positions for long in this unstable market will be risky. You may take short or long calls for scalping but make sure that it is for a shorter period of time.
Note: Take the risk that you can effort to lose but knowingly do not jump into a bad trade. When you know and see that market is in a risky zone, stay aside.
I hope this update is helpful for you. Thank you for supporting me.
God bless.
#BTC/USDT 1DAY UPDATE !!Hello dear traders, we here new so we ask you to support our ideas with your LIKE and COMMENT, also be free to ask any question in the comments, and we will try to answer for all, thank you, guys.
BITCOIN UPDATE: Last Friday, August’s non-farm payrolls (NFP) was released, which showed that 315,000 jobs were added to the U.S. economy.
Although the labor market continues to be the bedrock of optimism in the United States, it has not been enough to avert attention away from the inflationary crisis.
Despite the better-than-expected NFP number, bitcoin fell to two months low the day after the data was released, dropping below $18,600.
Since then prices of BTC have mostly consolidated, trading between a floor of $19,500 and a resistance of $20,200.
However, as of writing this, the token has surged in today’s session, with prices once again moving above $21,000.
Some attribute this rally to comments from Fed Chair Jerome Powell, who all but confirmed that rate hikes would continue, until “the job is done”.
This is not a piece of financial advice. All investment made by me is at my own risk and I am held responsible for my own profit and losses. So, do your own research before investing in this trade.
Sorry for my English it is not my native language.
Hit the like button if you like it and share your charts in the comments section.
Thank you
#BTC/USDT 4Hr UPDATE !!Hello dear traders, we here new so we ask you to support our ideas with your LIKE and COMMENT, also be free to ask any question in the comments, and we will try to answer for all, thank you, guys.
BITCOIN UPDATE:- 4-hour timeframe, after forming the same continuation correction pattern for the third time and consolidating inside, the price finally broke the lower threshold. This resulted in a massive decline to the $18K support level.
This is the most crucial level for the bulls to defend. If the bears successfully push the price below this critical level, another clash for power will likely occur.
However, there is a considerable bullish divergence between the price and the RSI indicator in this timeframe. The formation, alongside the sentimental power of the $18K support level, indicates a potential reversal in the next few days.
The current question is whether the bulls can hold this support for the fourth time. Next week’s price action could be a clue to determining the outcome.
This is not a piece of financial advice. All investment made by me is at my own risk and I am held responsible for my own profit and losses. So, do your own research before investing in this trade.
Sorry for my English it is not my native language.
Hit the like button if you like it and share your charts in the comments section.
Thank you
BTC, price should take SL of trapped bulls BTC, price should take SL of trapped bulls
We wait for clear pattern to take entry

We're getting there!!Those who have been following me, gonna save money for the next bull-run. Moon boys with thousands and millions of followers gonna get you rekt! Mind it!
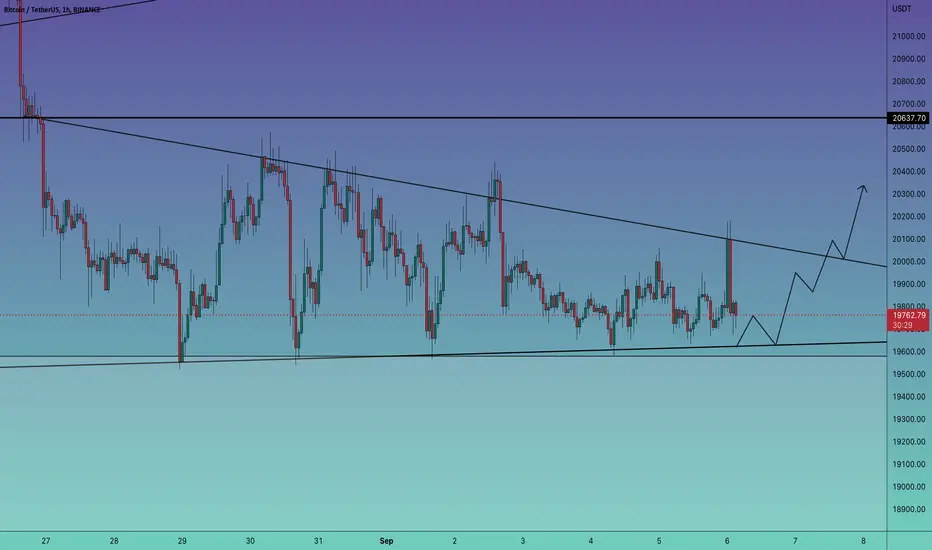
#BITCOIN 1HOUR UPDATE !!Hello dear traders, we here new so we ask you to support our ideas with your LIKE and COMMENT, also be free to ask any question in the comments, and we will try to answer for all, thank you, guys.
BITCOIN UPDATE:-Like I mentioned in the previous update BTC may bounce from here and the resistance of BTC which is close to $20.1k from where BTC bounced back and BTC fell to its resistance We are back to updating you the same chart from here let's tell you that btc is still trading further of the wedge channel if the channel upside btc breaks then we can see BTC one time $20.7k if btc breaks the lower trend line of the wedge channel so we can see drop in btc thanks stay tuned for updates
This is not a piece of financial advice. All investment made by me is at my own risk and I am held responsible for my own profit and losses. So, do your own research before investing in this trade.
Sorry for my English it is not my native language.
Hit the like button if you like it and share your charts in the comments section.
Thank you
BITCOIN 1DAY UPDATE BY CRYPTOSANDERS !!BITCOIN UPDATE :-Looking at the daily chart, the price has been consolidating in a tight range between $19,500 and $20,500 over the past few days, showing little intent for a significant move in any direction. The $20K support area seems to be holding the price for now.
If a bullish rebound is to happen, the 50-day and 100-day moving average lines around $23K and the $24K resistance level would be key areas to watch for as they can initiate a bearish continuation.
On the other hand, a breakdown from the $17K-$20K area could prove disastrous for the market, as, in this case, a rapid decline towards $15K and beyond would be probable. This would prolong the bear market significantly as bottom formation and accumulations take months at the end stage of bear markets.
Hello dear traders, we here new so we ask you to support our ideas with your LIKE and COMMENT, also be free to ask any question in the comments, and we will try to answer for all, thank you, guys.
This is not a piece of financial advice. All investment made by me is at my own risk and I am held responsible for my own profit and losses. So, do your own research before investing in this trade.
Sorry for my English it is not my native language.
Hit the like button if you like it and share your charts in the comments section.
Thank you
