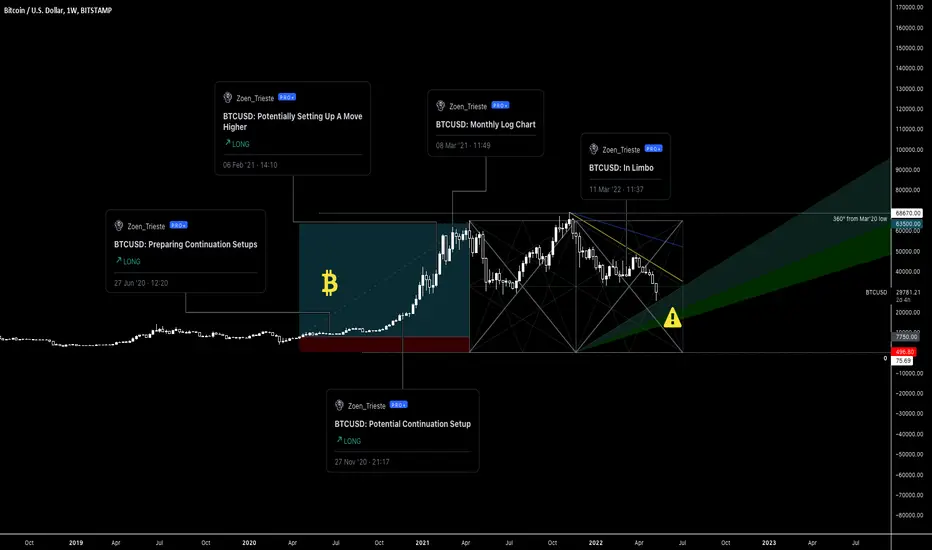
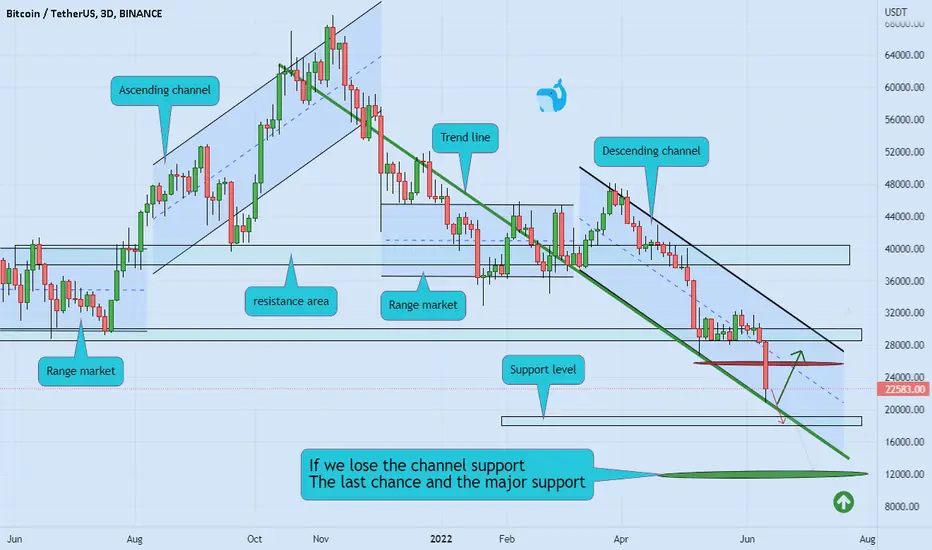
Bitcoin will fall between seven and ten thousand dollars.If you think Bitcoin is not falls anymore, I must say that you are sorely mistaken. The huge bitcoin falls and reaches its trend line, which is green at the bottom of the chart. I do not want to say that this is a signal, but I want to say that the first fall target is $ 26,779 and the second target is $20,645 based on the head and shoulders pattern, which is also confirmed by Gan Fan. Also, the pattern that is drawn at the bottom and left in a square should happen again in the future, and if that happens, the decline between seven and ten thousand dollars will continue, depending on the green trend.
But what I can tell you is that when the fall is over, anyone who buys on the green trend line to climb can see at least $ 150,000 bitcoin rise and profit. Because the end of the bullish channel will be around $ 150,000.
GOOD LUCK
(This is just an analyst's opinion and not a buy/sell signal. There is a high probability of error.)
Btcforecast

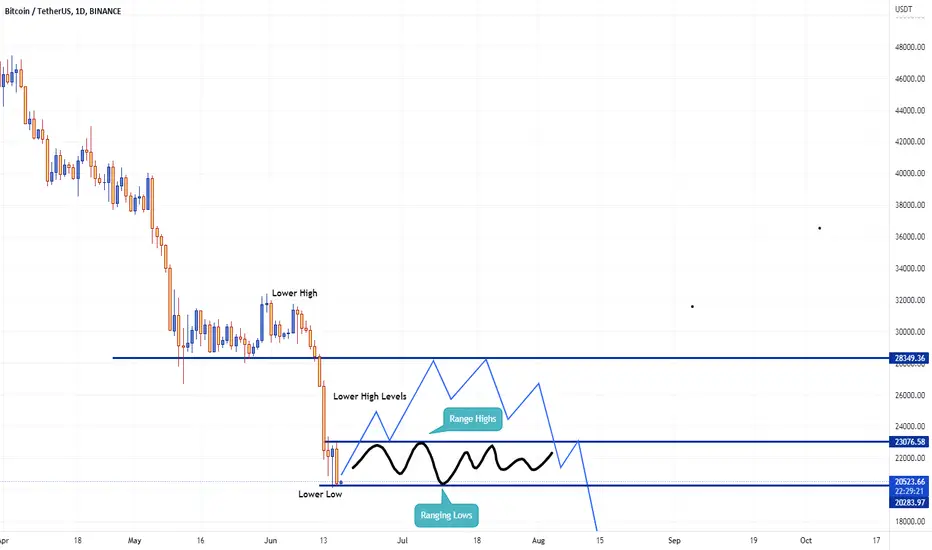
BITCOIN UPDATE: CAN THIS BE THE BOTTOM?Hello traders, welcome to this update on BTC. I will try to keep it simple and understandable for all of you.
BTC's weekly close was at $20.6k. It is still holding the support 1 ($19.5k).
Q. Can this be the bottom?
A. Possibly no cause we are still in the bear market cycle.
Q. Can we expect a bounce-back?
A. Possibly, the bounce can hit the resistance level of $30k.
Q. If BTC breaks down then what could be the possibly bottom range?
A. If BTC breaks down below the support 1, the next possible bottom could be $12k.
Conclusion: If BTC continues to hold the support 1 level then we can expect a bounce towards the resistance level ($30k) and then the downfall. But if BTC fails to hold S1 then I am afraid that we may see BTC once again at the $12k level.
I hope this update will be beneficial for you. Do check out my related ideas in the link. I posted these updates back in Jan and Mar 2022 and it beautifully played out.
Like and follow for more.
Thank you.

BTCUSD: Preparing Positional Long EntrySince our last post, the BTCUSD market went through a corrective phase that brought the price to the mid20k level, the lowest price since the onset of the price discovery phase when the prior ATH was left behind with a bang. It is an exceptionally well-behaved market despite the turmoil that many other DeFi projects incl. stable coins have been going through. It seems reasonable to be looking for opportunities to add to long exposure in this market as the risk/reward is becoming more attractive.
Key events/levels to look for clues:
25k bottom retest;
25k bottom retest +break = 7.5k extension lower;
17.5k - 22.5k as a major bottom.
INDEX:BTCUSD is at a very pivotal moment and opportunities always come with risk, do manage the risk accordingly.
Staying tuned for further tells.
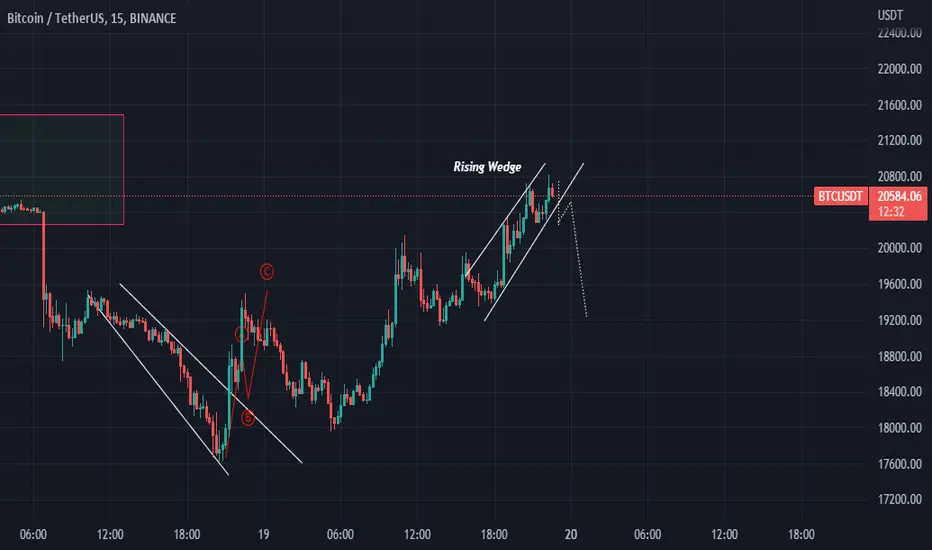
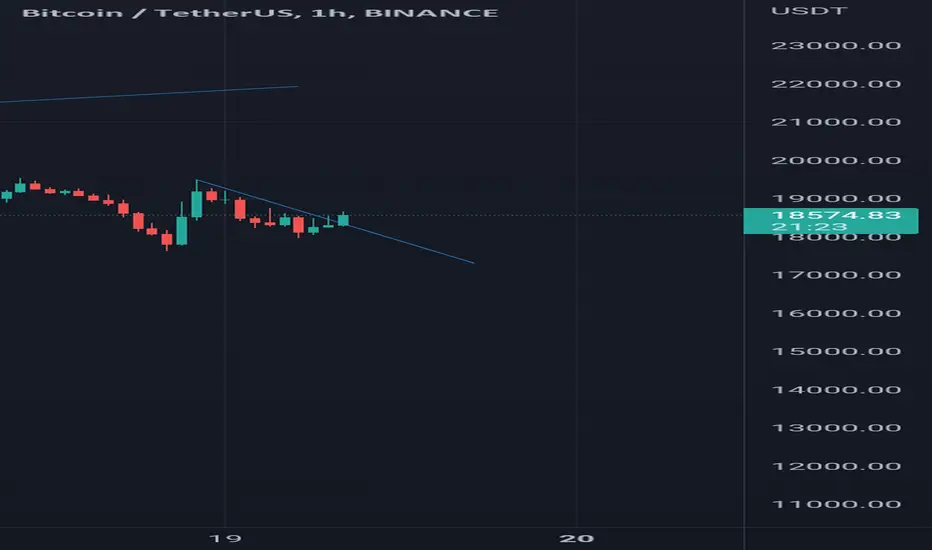
BITCOINBTC/USDT update chart forming rising wedge and its on Strong Resistance i dont think BTC pump more we need to test one more time Support Zone at 18000$
BtcusdtIs this the bottom? Please drop comments 🙏😪
This is weekly time frame
Let's see weekly candle close
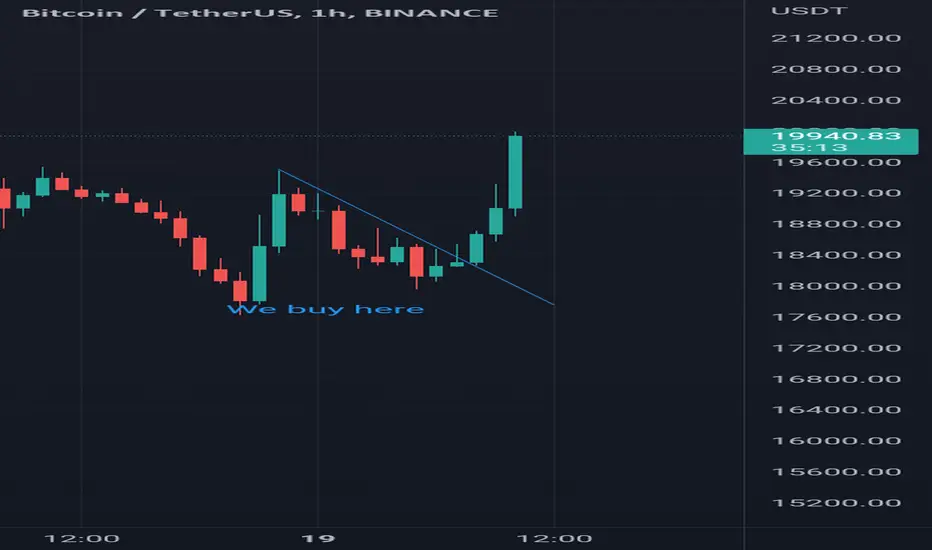
Btcusdt If u followed my long yesterday book some profit
And if u also followed today's long book some profit
I did a tiny long for a small scalp at this recent low as well as promised at 17k. I shill 17k I long it
We took another long around 18550 now current price 19k++
that's that about me check all my post and my recent ones we good 👍
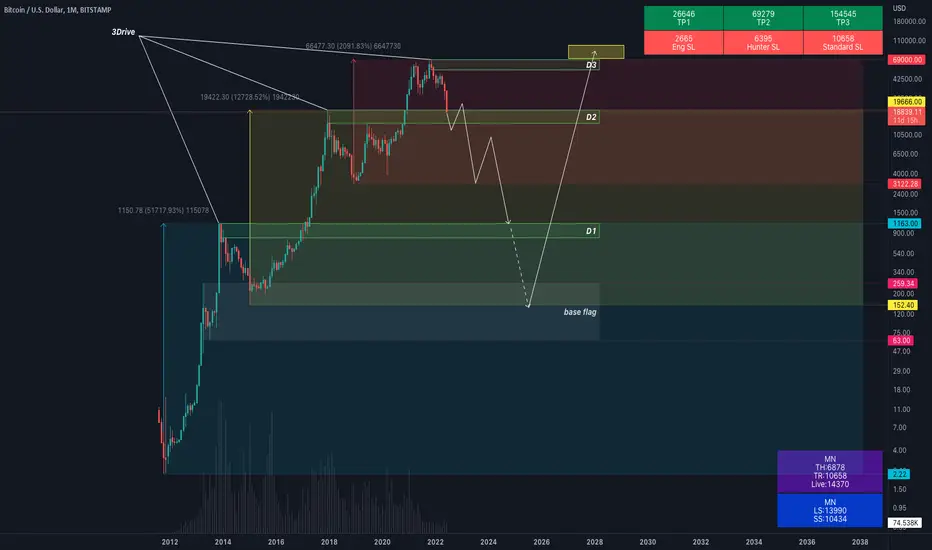
BTC Monthly TF 🛬😵💫What if bitcoin on correction path of monthly 3 drive!? 🤯🤡
If the economic situation goes far worst, in my opinion we might see bitcoin goes far far low.🛬😵💫
Maybe drive 1 can't apparent as a strong support and the base flag $63~$260 is a greatest opportunity to buy btc til reach $70K~$100K in long term!!!🚀🤑🤠
This is just an idea and maybe never reach this low but keep in mind everything happen in crypto! 🥶
Peace✌🏽
Btcusdt Long btc here and use stop lose
Btc will pump very soon and liquidate shorter
Be careful with your trade
It open target
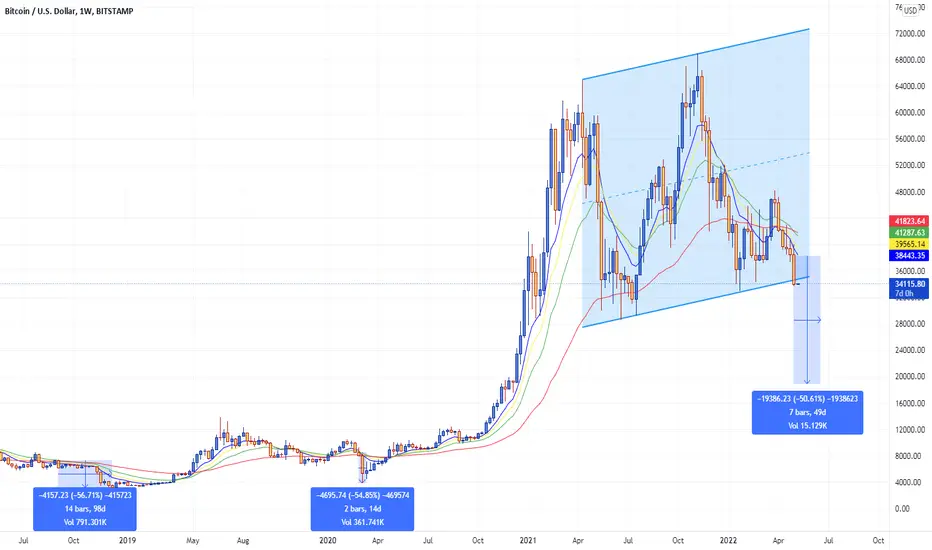
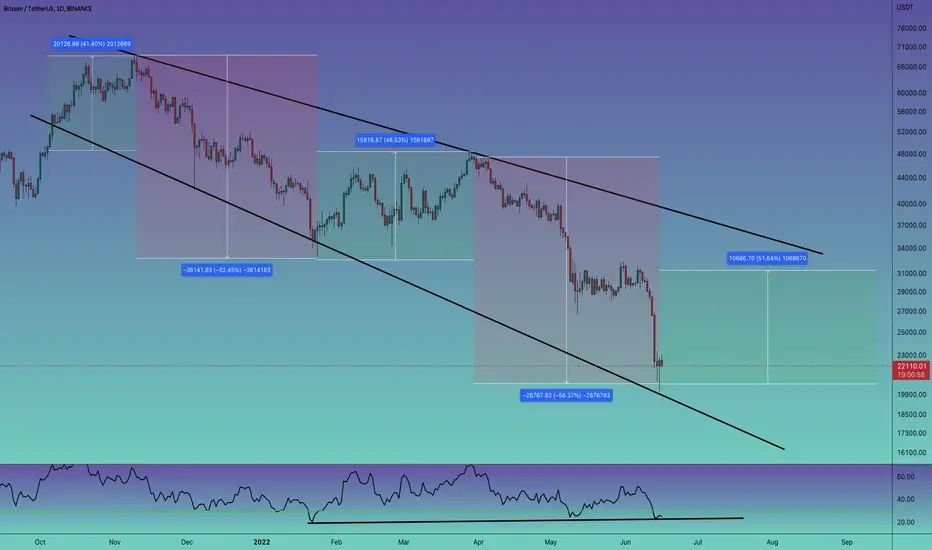
BTC 4ema bearish crossover target $20KWe have discovered something which suggest that $20K seems inevitable. This chart is based on 4EMA's on weekly.
First time bearish cross over happened was 3rd Sept 2018 and price dumped to over 56%
Second time this occurred in March 2020 (Covid Crash) and price dumped up to 55%
This is the 3rd time we are seeing this bearish cross over on weekly and lets say if we dump 50% from here then we are looking at sub $20k levels.
We also see the price breaking down from ascending channel which is another bad sign and to top it off we are close to a death cross on 3D chart so all of these confluences align with depressing bearish trend which can last up to 3 to 6 months or maybe a year but not more than this.
Kindly share, like and comment on our analysis.
Bitcoin Sell Off Realistic Price Deep DiveFinancial markets plummeting and macroeconomics hit with a torrent of shocking news what does this mean for Bitcoin and cryptocurrencies?
Before jumping into Bitcoins (BTC) price analysis it is important to understand the top reasons why markets are falling at an accelerated rate.
Inflation throughout the world is at record highs with inflation in United States of America at its highest in 40 years 8.6%
Interest rates are rising sharply with Fed increasing interest rates by 75 basis points this week the largest since 1994.
Dollar strength index DXY is steadily increasing indicating investors are moving money out of risk assets to less risky ones e.g. bonds & cash
Specifically, to cryptocurrency markets the crash of Terra’s $LUNA and $UST combined $50 billion spooked investors and raised concerns.
Rumours of Celsius and Three Arrows Capital insolvency due to large exposure with Terra assets which leads questions to which other cryptos will fall in the domino effect creating further sell off panic.
Many countries announcing and investigating new cryptocurrency regulations and laws. (Subscribe here to be notified of articles on latest regulations)
Fear and greed index is at all time-lows of 7 this week and below extreme fear levels for the last month.
Cryptocurrency total market capitalization has dropped from all time high of $3 trillion to below $1 trillion a $2 trillion decline in a few months.
Specifically, Bitcoin has experienced 9 weeks of price decline the first time in history and continues with effectively 11 weeks of price decline.
Bitcoin price has retraced below its previous all-time high for the first time.
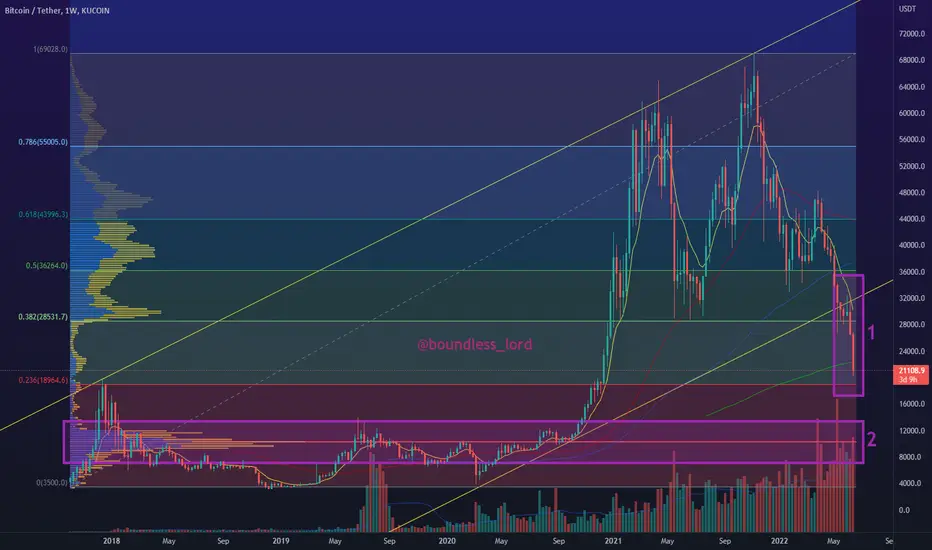
With the global financial market scene set above we can expect the following BTC price action in the near future. Looking at the area in box number one on my technical analysis chart above.
Bitcoin weekly candle close broke 0.382 Fibonacci support level $28500 to the downside.
200 Day weekly moving average a significant indicator (green line) which has proven to be historical support for previous bear markets and signalling bottoms has breached $22000 level this week for the first time.
In confluence price has fallen out of current trending channel illustrated as two yellow upward parallel lines.
What does this mean for Bitcoins price and key levels?
Next level of support which needs to hold is 0.236 Fibonacci around $19000 to prevent further downside.
Sell off at $19000 level will take Bitcoin to the next significant level of interest by investors the $10000 red line in box number two.
Failing the above levels of support $3000 is a very real possibility as final bottom since we have seen most significant key levels decimated over the past few weeks due to macroeconomic conditions.
Let me know your thoughts in the comments below and if you would like to know what this means for altcoins in your portfolio. Till then stay safe and always remember to apply appropriate risk management to your investments.
Legendary Investment Trader, Cryptocurrency & Web3 Master
Boundless Lord
Bitcoin Bullish Reversal Bitcoin will most likely reverse trend for a good while when it hits the previous price that changed the trend to bullish (breaker) which is 19798.68. The second point of interest will be from 13970 if it should continue to go down a lot more past 19798.68
BTC Relief RallyBTC is making a lower low on daily so we have a chance of a relief rally by making a lower high so based on that we have 2 scenarios. We are halfway to the bear market and second half is on the line.
Scenario 1
BTC will range between $20300 to $23000 for sometime and then break out towards $25k to $28k possibly making a bear flag and goes down towards $19k-$15k.
Scenario 2
BTC will simply break down from here towards $15k-$19k and we will bounce back up for a relief rally towards $30k levels or higher and then we go down again.
Bitcoin needs additional liqidation before hit it's bottom Bitcoin needs additional liquidation before hit it's bottom
i think after big range will happen

Bitcoin, there are still no messive liqidations Bitcoin, there are still no massive liquidations
For the clear bottom, we need 10B and more worth of liquidations

#BTC/USDT 1DAY UPDATE !!Hello dear traders, we here new so we ask you to support our ideas with your LIKE and COMMENT, also be free to ask any question in the comments, and we will try to answer for all, thank you, guys.
#BTC UPDATE:)
BTC makes this descending channel pattern in a daily time frame, currently holding above the lower support of this channel so we can expect a bounce from here up to the upper resistance of this channel. . RSI is in the oversold region, showing hidden bullish divergence.
If it breaks the lower support then the chart will be invalided.
Remember:-This is not a piece of financial advice. All investment made by me is at my own risk and I am held responsible for my own profit and losses. So, do your own research before investing in this trade.
Thanks for your time, we hope our work is good for you, and you are satisfied, we wish you a good day and big profits.
THANK YOU.
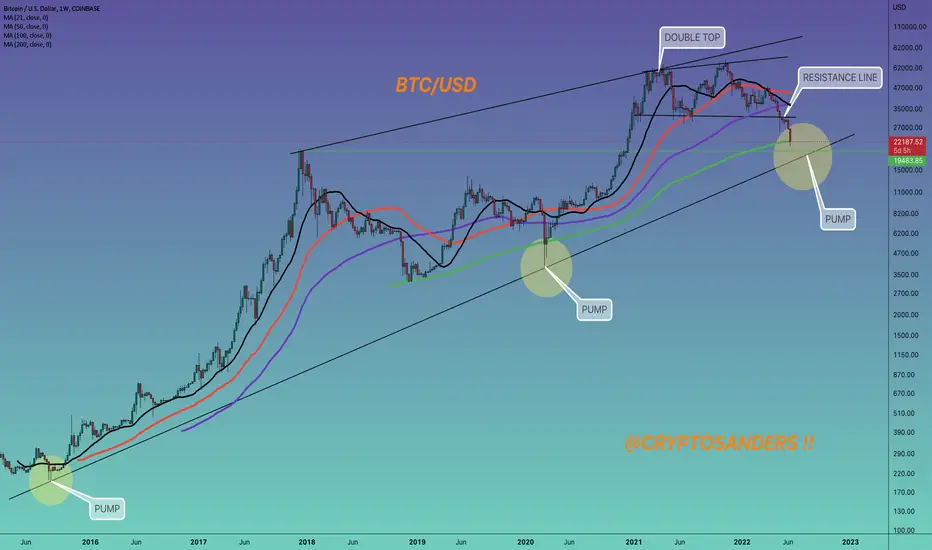
Must read BTC IMPORTANT WEEKLY UPDATE !!As we can see in the chart mentioned above that BTC is currently trading one support of green MA.
If we consider the past and do some backtesting then it is clearly evident that BTC holds the green MA very well but it always moves downside to touch the lower trend line support, so here I am expecting a wick off from the lower trend line support and rally to print a new ATH.
Whenever BTC bounced from the lower trend line support it printed new ATH.
At the top of this chart, BTC also printed a double top pattern and a triple top is likely in the upcoming days.
In another scenario, if BTC breaks below the lower trend line, this chart will be invalidated.
Thank you for your time, we hope that our work is good for you, and you are satisfied, we wish you a good day and big profits.
Thank you
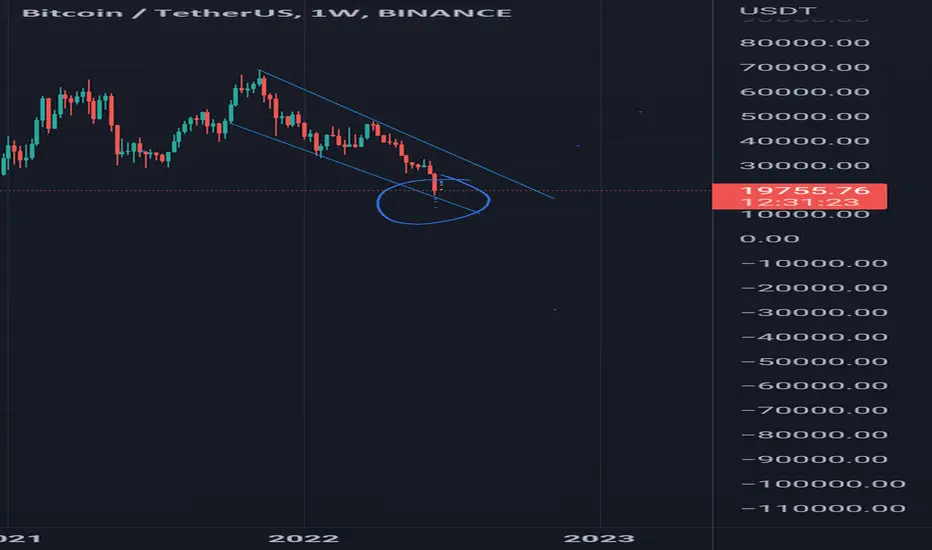
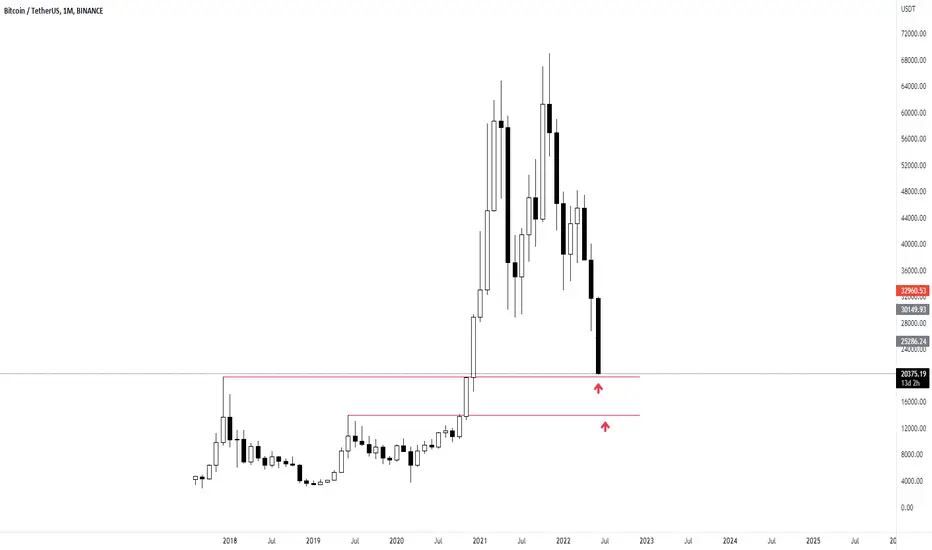
BITCOIN WEEKLY UPDATE: IS THIS THE BOTTOM??Hello traders, I hope you all are doing good. Here's a quick update on BTC in the weekly timeframe.
This is it, BTC is close to the support level of $19.5k from where many of us are expecting a rebound. Both the horizontal and lower trendline indicates $19.5k to $20k to be a strong support range for BTC. If BTC manages to hold this level and bounces back then we can expect a higher rally. But if it fails and breaks down below the support level then the only support level I can see is $11.5k to $12k.
The upcoming weekly close is going to be an important one for the market. We are at the end of the 2nd quarter and already we have seen a lot happening in the market. Hopefully, the 3rd quarter will be positive for us all.
I am in the ‘No Trade Zone’ right now. If there are any opportunities then I will share my updates. Until then, trade safely.

Bitcoin, where is the bottom? Still no messive liqidationsBitcoin, where is the bottom? Still no messive liqidations

BITCOIN long position 🚀Hello 🐋
based on the chart, the price is close to important support area and the channel support ✔️
if
the price do not break the channel support to the downside, we will see brief gain to the upside at least to $25000 🚀
otherwise
we can see more correction ❌🧨
Please, feel free to share your point of view, write it in the comments below, thanks 🐋
BITCOIN We Are Here & What Now!?Welcome Traders, Investors & Gamblers 😃
Daily Charts:
Support & Resistance Levels
On a quick glance at this chart we would think that there isn't too much support in the area that Bitcoin is currently hangingon to, but down below I will go through all the indicators that lead me to call these current lows for Bitcoin in the beginning of the year already.
Weekly Charts:
200 Week SMA & Falling Wedge:
As mentioned yesterday, THE bullish scenario! Wick below the support and finish the week above the wedge support to go back and test the resistance.
2017 $20k ATH:
Right in the middle of major moving averages and Fibonacci levels we have the historic ATH from 2018.
Monthly Charts:
200 Week SMA, 50 Month SMA:
Pay attentio to the red circle, in the one instance where we touched the 200 week SMA but not the 50 month SMA we ended up falling short of a new ATH until we came back downand touched both moving averages.
Fibonacci Retracement:
The "Absolute Bottom" could lay around the.786 for BTC since we lost the .618 it would be logical to continue down to the next Fib. level and find a bounce there. As we know we have never closed a weekly candle below the 200week SMA and 50 Month SMA, but we have wicked way below on various ocasions with the last being in March 2020.
I would like to add that this is only for educational purpose and in no way a guarantee that it will play out this way, nor is this or are any of my posts financial advise.
As always, A BIG THANK YOU for stopping by, I hope you liked my post! If you did, please take a second to drop a like or comment, every engagement puts a smile on my face, but also helps me to get my ideas out to many more of you guys! 😃🙏
Happy Trading ✌♥📈
Is history repeating itself?BTC is obviously in a strong downtrend. It reminds me 20k to 3k. As a predictive minded trader, going between 13k-14k is not challenging. It's a matter of time, not how. Maybe in Oct., maybe sooner. Let's see.

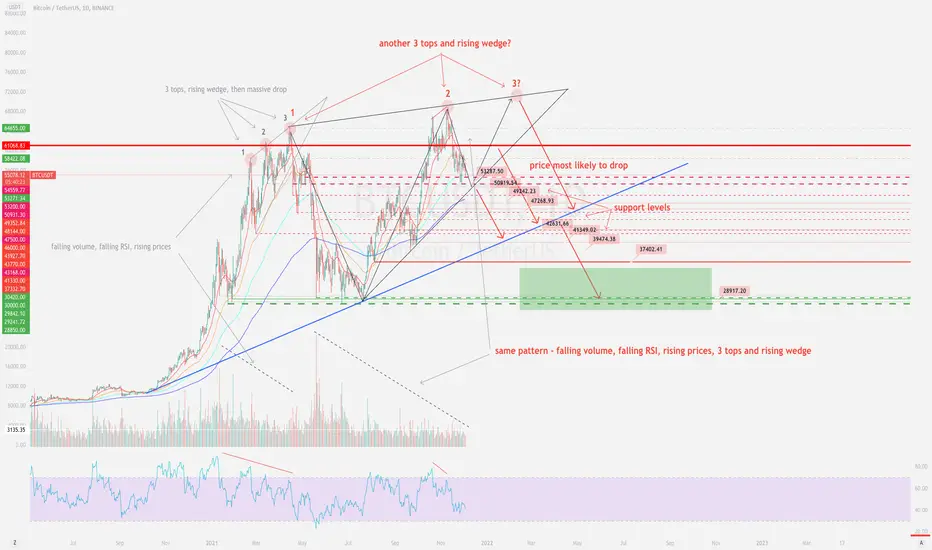
Is this game over? Come on, BTC, where's my Lambo then?What's up guys!
Here's what I'm thinking.
BTC is creating a rising wedge which is a bearish pattern.
We made 2 tops already and perhaps the last one is to made.
This pattern is very similar to the rising wedge we had this spring.
3 tops on falling vol and RSI ended up with a massive drop from $65k to $29k.
Just look at the chart - we're creating another one, great wedge.
We may be falling down to ~$53k, and then even rise to $68k, or the new ATH which would be ~$71-72k.
But then, considering falling volume and RSI more probable is that we will fall down, and this may be over for now.
I've marked multiple supports. I don't think we may fall down farther than to ~$28k but anything is possible.
Stay safe, stay tuned, I'll keep you updated.
Best!
BTC target $36,653 or $25,218BTC has been consolidating in symmetrical triangle for last 1 month and still there is more room to consolidate further. Upon breakout and retest from triangle, Technical target of this pattern is $36,653 and upon breakdown and retest we can see the target of of $25,218. So right now BTC is ranging in purgatory. There was a wick down on 12th may towards $26,702 but price went back up so right now BTC is in state of wait and watch. Don't take any positions until we have clarity plus weekend is here so expect some choppy movements.
