#BTC/USDT 4HOUR UPDATE BY CRYPTOSANDERS !Hello, dear traders welcome you to this BTC /USDT 4hr chart analysis.
Hello dear traders, we here new so we ask you to support our ideas with your LIKE and COMMENT, also be free to ask any question in the comments, and we will try to answer for all, thank you, guys.
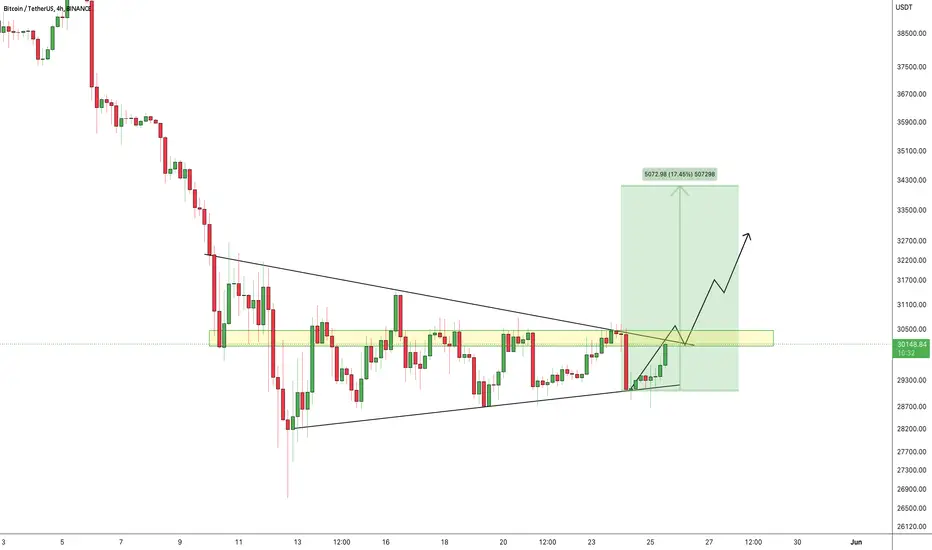
If BTC supports the upper trend line will then soon we will be able to see the price rally towards the yellow resistance areas in the coming day which is around 17% from the lower levels.
Remember:-This is not a piece of financial advice. All investment made by me is at my own risk and I am held responsible for my own profit and losses. So, do your own research before investing in this trade.
Thanks for your time, we hope our work is good for you, and you are satisfied, we wish you a good day and big profits.
THANK YOU.
Btcforecast

#BTC/USDT 1HOUR UPDATE BY CRYPTOSANDERS Hello, dear traders welcome you to this BTC/USDT 2hr chart analysis.
Hello dear traders, we here new so we ask you to support our ideas with your LIKE and COMMENT, also be free to ask any question in the comments, and we will try to answer for all, thank you, guys.
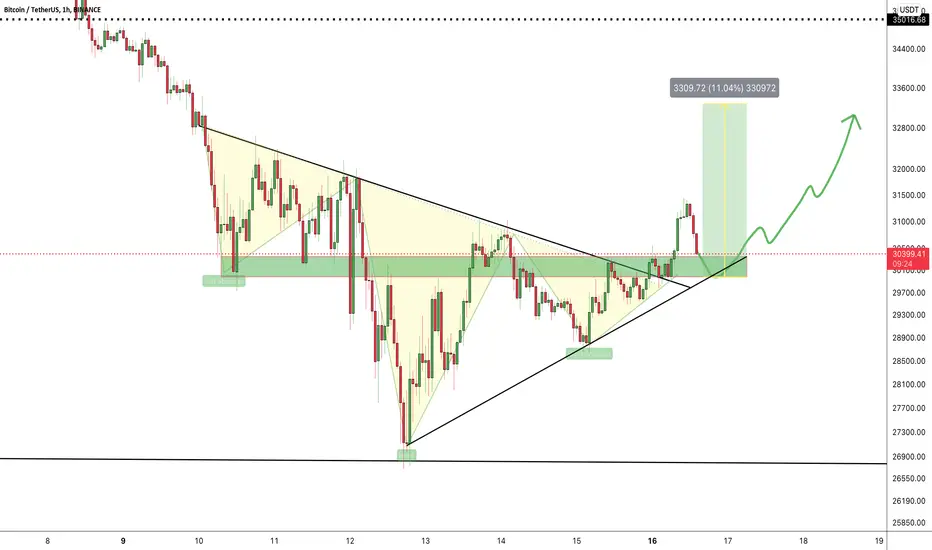
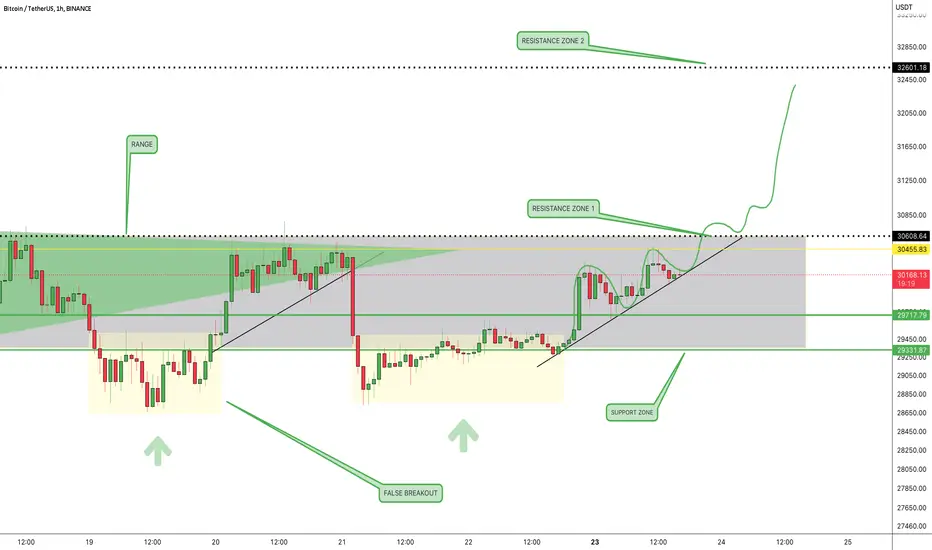
#BTC/USDT LONG TRADE SETUP
ENTRY:-$28900,$29300
TARGET:- 1-$30450
2-$31300
3-$32300
4-$34000
STOP LOSS:-$28450
with laverage :-5x to 10x
In the current scenario, the BTC is trading above the green support zone .
Now I am expecting more % down towards the lower support zone area which is also a good buying zone for BTC.
If BTC HOLDS the upper trend line support well then soon we will be able to see a bounce towards the yellow resistance zones at the price level in upcoming weeks which is almost 17% from the bottom level.
Remember:-This is not a piece of financial advice. All investment made by me is at my own risk and I am held responsible for my own profit and losses. So, do your own research before investing in this trade.
Thanks for your time, we hope our work is good for you, and you are satisfied, we wish you a good day and big profits.
THANK YOU.

#BTC/USDT 4HOUR UPDATE BY CRYPTOSANDERS Hello, dear traders welcome you to this BTC /USDT 2hr chart analysis.
Hello dear traders, we here new so we ask you to support our ideas with your LIKE and COMMENT, also be free to ask any question in the comments, and we will try to answer for all, thank you, guys.
If BTC supports the upper trend line will then soon we will be able to see the price rally towards the yellow resistance areas in the coming day which is around 17% from the lower levels.
Remember:-This is not a piece of financial advice. All investment made by me is at my own risk and I am held responsible for my own profit and losses. So, do your own research before investing in this trade.
Thanks for your time, we hope our work is good for you, and you are satisfied, we wish you a good day and big profits.
THANK YOU.
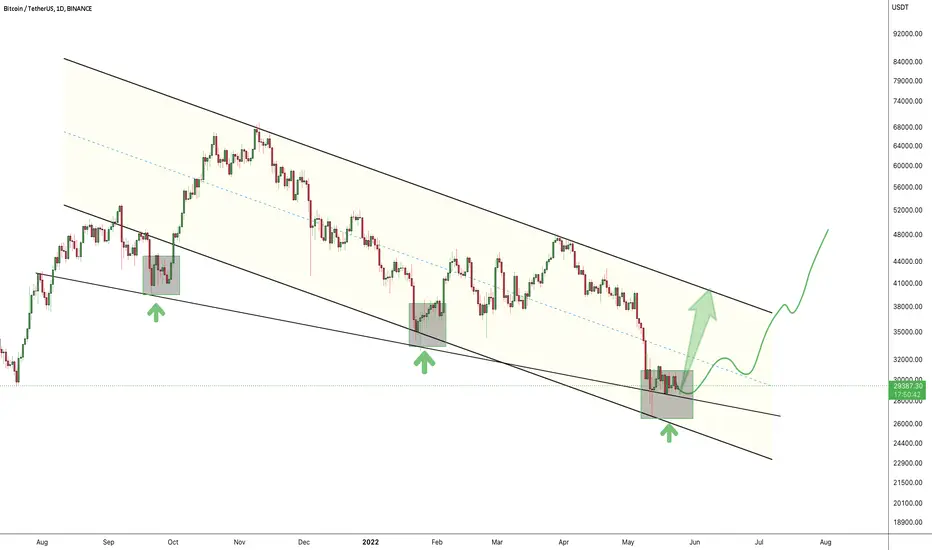
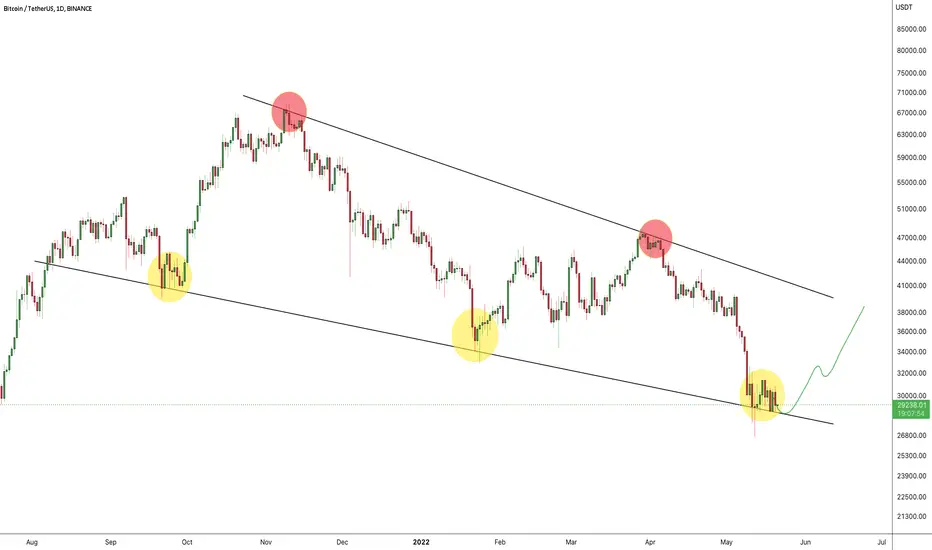
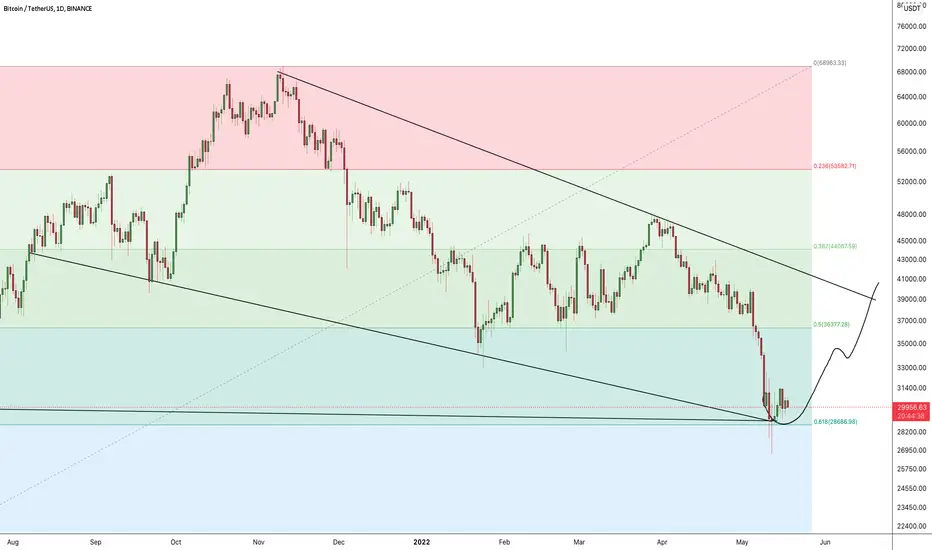
#BTC/USDT DAILY UPDATE !!Hello, members and welcome to this BTC /USDT quick daily chart analysis.
Nothing much has changed yet in this daily time frame.
As we can see ash the above-mentioned chart that BTC /USDT still trading still inside and at a lower trend line in support of descending channel pattern.
This is not a piece of financial advice.
Then, hit the like button and share your chart in the comment section if you like it.
thank you.
#BTC/USDT 15MINUTE UPDATE Welcome to this quick BTC/USDT analysis.
I have tried my best to bring the best possible outcome in this chart.
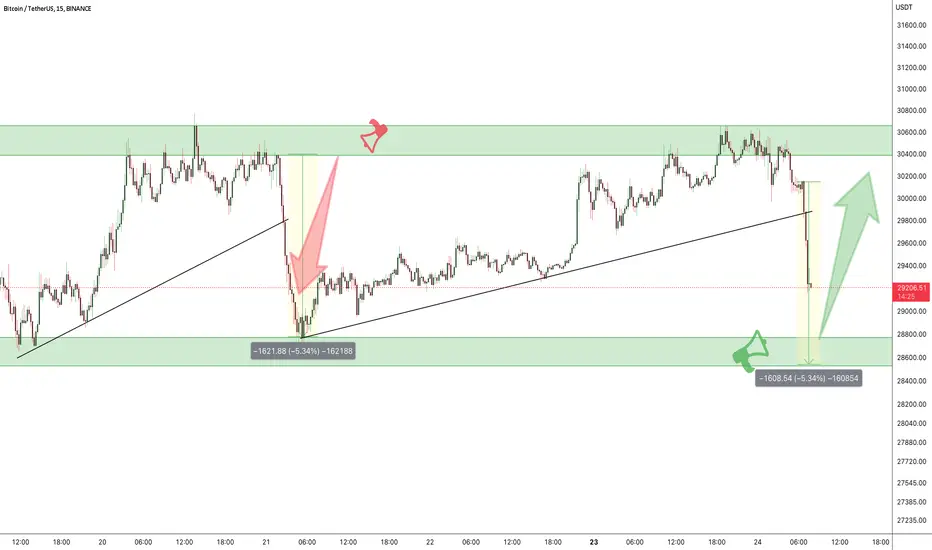
BTC/USDT dump and retest down green zone
$28500,$28800 buying zone, and stop-loss $28000
and target $30300,$30700
Remember:-This is not a piece of financial advice. All investment made by me is at my own risk and I am held responsible for my own profit and losses. So, do your own research before investing in this trade.
Sorry for my English it is not my native language.
Do hit the like button if you like it and share your charts in the comments section.
Thank you...
#BTC/USDT 30M UPDATE BY CRYPTOSANDERS !Hello, dear traders welcome you to this BTC /USDT 30M chart analysis.
Hello dear traders, we here new so we ask you to support our ideas with your LIKE and COMMENT, also be free to ask any question in the comments, and we will try to answer for all, thank you, guys.
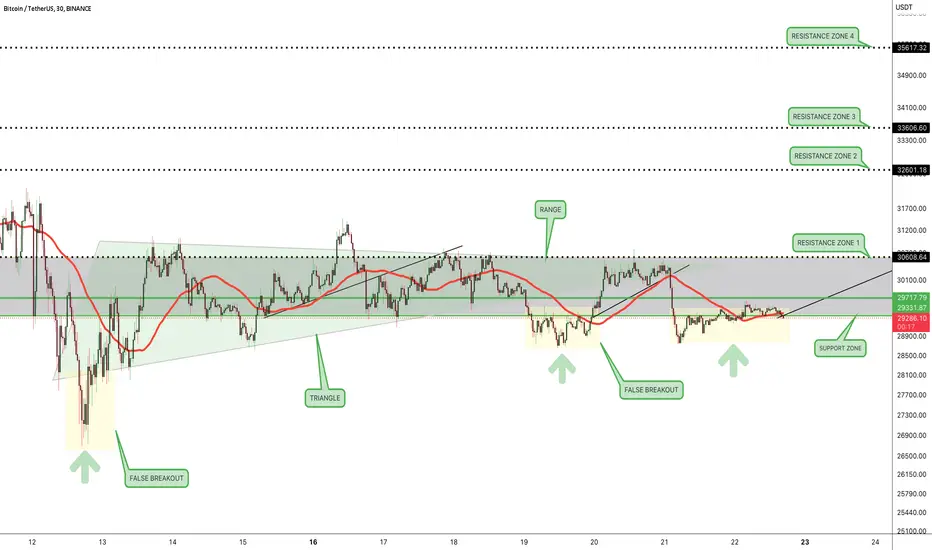
As I mentioned in my previous chart there is not much chance to see in this 30minute time frame,
Bitcoin is trading above the liquidity level in the Support area.
Prices broke the downside limit on declining volume and went back up on rising volume.
Fixed above 50MA on 30m time frame.
I expect the price to turn down from the current triangle but reverse once it recovers above the support level
Remember:-This is not a piece of financial advice. All investment made by me is at my own risk and I am held responsible for my own profit and losses. So, do your own research before investing in this trade.
Thanks for your time, we hope our work is good for you, and you are satisfied, we wish you a good day and big profits.
THANK YOU.
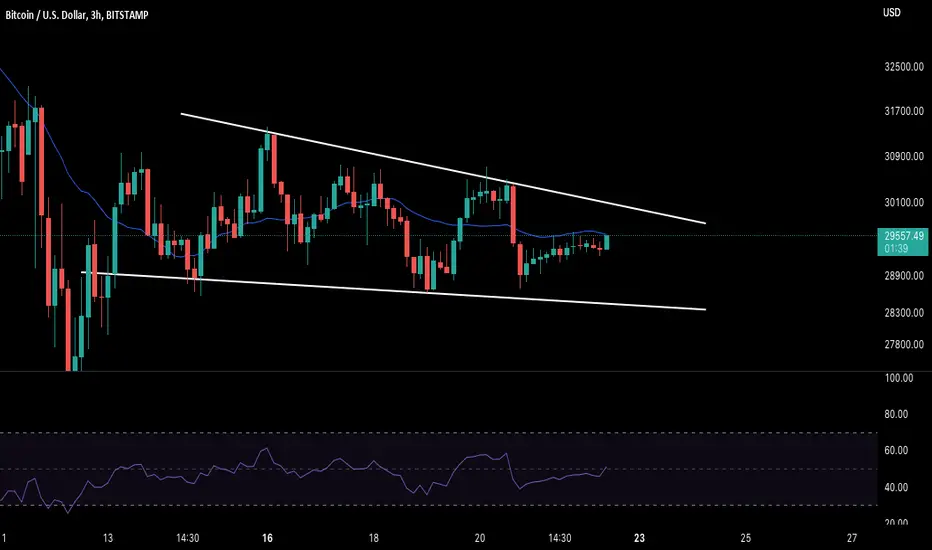
BTC UPDATE IN 3 HOURS TIME FRAMEWelcome guys to this 3 hours update on BTC. BTC is trying to push towards the upper trendline breaking the 21 MA resistance. But the real challenge is the $30k resistance. BTC must break above this level as we reach close to the weekly closing.
In case BTC breaks below the lower trendline (the support) then things may get into some trouble. So, keep your eyes open and trade safely.
I’ll see you in my next update.
#BTCUSD ❕ SUPPORT ZONEHello, dear traders welcome you to this BTC /USDT 30M chart analysis.
Hello dear traders, we here new so we ask you to support our ideas with your LIKE and COMMENT, also be free to ask any question in the comments, and we will try to answer for all, thank you, guys.
Bitcoin is trading above the liquidity level in the Support area.
Prices broke the downside limit on declining volume and went back up on rising volume.
Fixed above 50MA on 30m time frame.
I expect the price to turn down from the current triangle but reverse once it recovers above the support level.
Remember:-This is not a piece of financial advice. All investment made by me is at my own risk and I am held responsible for my own profit and losses. So, do your own research before investing in this trade.
Thanks for your time, we hope our work is good for you, and you are satisfied, we wish you a good day and big profits.
THANK YOU.
#BTC/USDT DAILY UPDATE !!Hello, members and welcome to this BTC /USDT quick chart analysis.
Nothing much has changed yet in this daily time frame.
As we can see ash the above-mentioned chart that BTC/USDT still trading still inside and at a lower trend line in support of descending channel pattern.
This is not a piece of financial advice.
Then, hit the like button and share your chart in the comment section if you like it.
thank you.
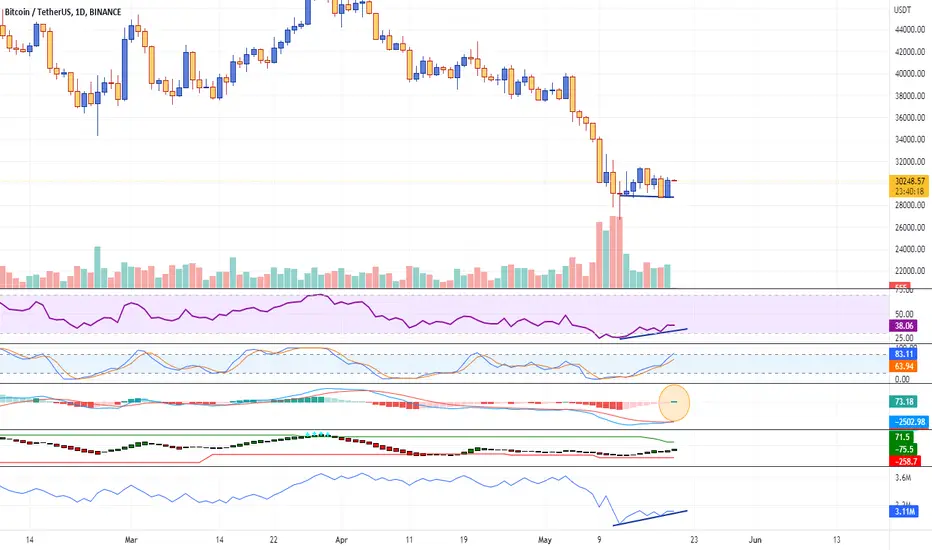
BTC showing bullish divergences on dailyBTC closed the daily candle with bullish divergence on RSI as well as OBV. MACD flipped bullish but looks a little weak in my opinion. Volume looks ok but not that good. For the divergences to play out we have to break $30500 resistance and $31500 to reach $34k to $36k levels although we are in a bearish trend so they might not work, These divergences will be invalidated if price goes back to $29500 level and validated if we break $31500 so fingers crossed for a relief rally.
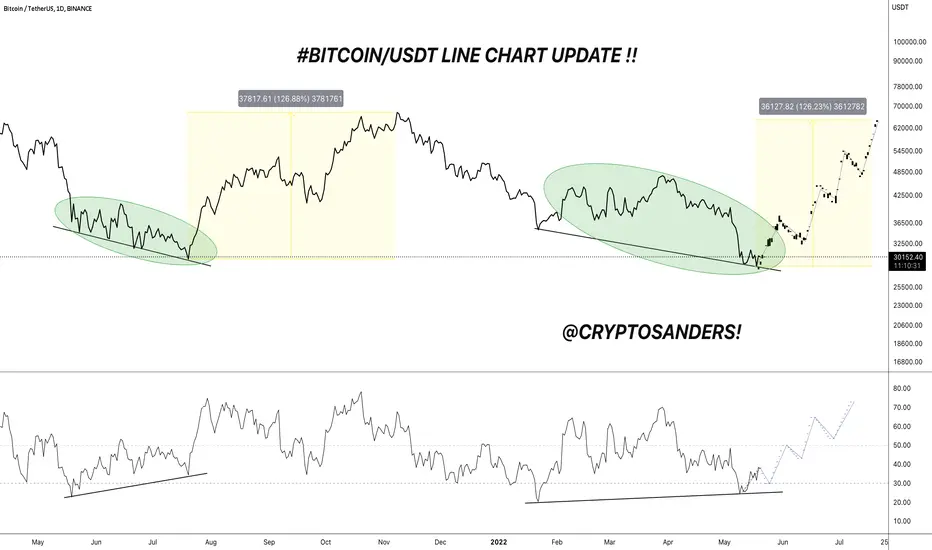
#BTC/USDT LINE CHART UPDATE BY CRYPTOSANDERS !!Hello, dear traders welcome you to this USDT.DOMINANCE 1hr chart analysis.
I have tried my best to bring the best possible outcome in this chart.
Hello dear traders, we here new so we ask you to support our ideas with your LIKE and COMMENT, also be free to ask any question in the comments, and we will try to answer for all, thank you, guys.
As we can see from the above-mentioned chart that BTC/USDT is printing a long bullish divergence in this line chart just like before in may-jun 2021.
If we consider the tenure this bullish divergence is almost 4 months long.
According to the past price action, BTC can put any time towards its new ATH.
Thanks for your time, we hope our work is good for you, and you are satisfied, we wish you a good day and big profits.
THANK YOU.
#BTC/USDT DAILY UPDATE !!Hello, members and welcome to this BTC /USDT quick chart analysis.
As I mentioned in my previous chart there is not much to watch on this daily time frame, the fib retracement bounced BTC is going bullish and altcoin is bullish
The btc/usdt fib label bounced off where btc was $28700 and bounced so that the altcoin became bullish.
So here we can get some good btc bounce
This is not a piece of financial advice.
Then, hit the like button and share your chart in the comment section if you like it.
thank you.
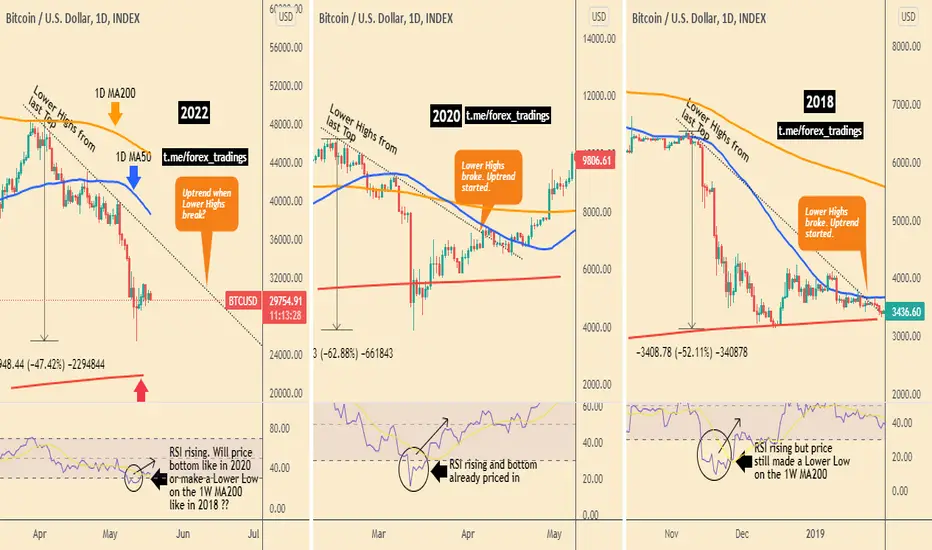
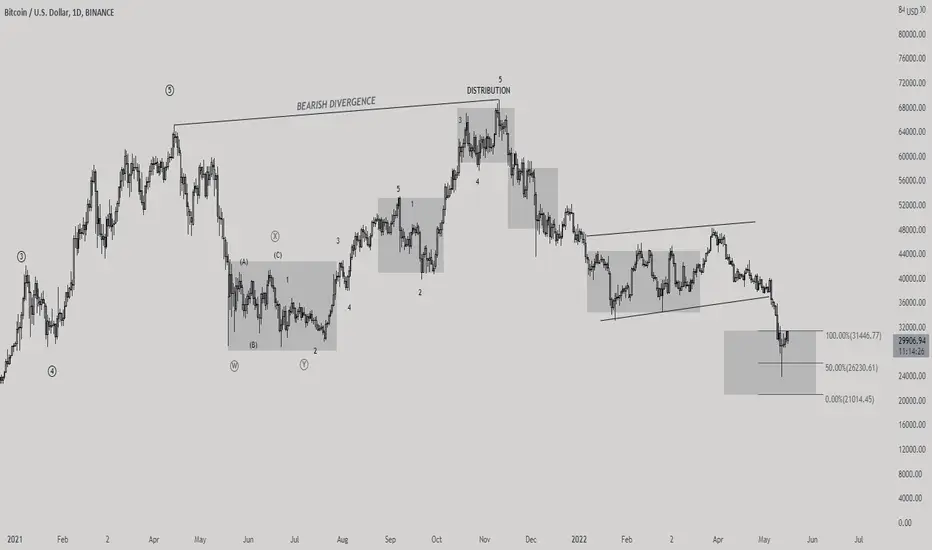
#BTC #bitcoin corrections phase2020 vs 2018
Similarities: Both confirmed their recovery and started a new uptrend when the price broke above the Lower Highs trend-line form the last Top. That roughly matched the 1D MA50
Differences: While the 1D RSI broke well below the 30.000 oversold level in both cases, in 2020 it achieved a price bottom for BTC , while in 2018, a price Lower Low was made for the bottom despite the fact that the RSI was rising.
That bottom was made exactly on the 1W MA200 , while in 2020 the price dropped considerably below the 1W MA200.
Today
The correction since late March resembles so far that of 2018 in terms of the 1D MA50 and 1D MA200 and in terms of the total drop percentage as so far it has completed a -47%, not far off the 2018 -52%. A -52% would be approximately around $23150, just over the 1W MA200, which in 2018 formed the bottom.
However it terms of RSI , it resembles more the 2020 correction, as the RSI is rising along with the price.
So whats the conclusion? The common parameter in those past corrections, is that the market confirmed a sustainable rise when the price broke above the Lower Highs trend-line, which is also roughly where the 1D MA50 was. Right now the 1D MA50 is at $38623 but dropping fast due to May's aggressive correction. Long-term traders and investors have much better chances buying once BTC breaks above this trend-line. Our thesis is that, we will most likely see sideways price action before the Lower Highs/ 1D MA50 break, meaning that we may see a 2 month consolidation.
Can this be a Bear Market Accumulation?
#BTC/USDT DAILY UPDATE !!Hello, members and welcome to this BTC /USDT quick chart analysis.
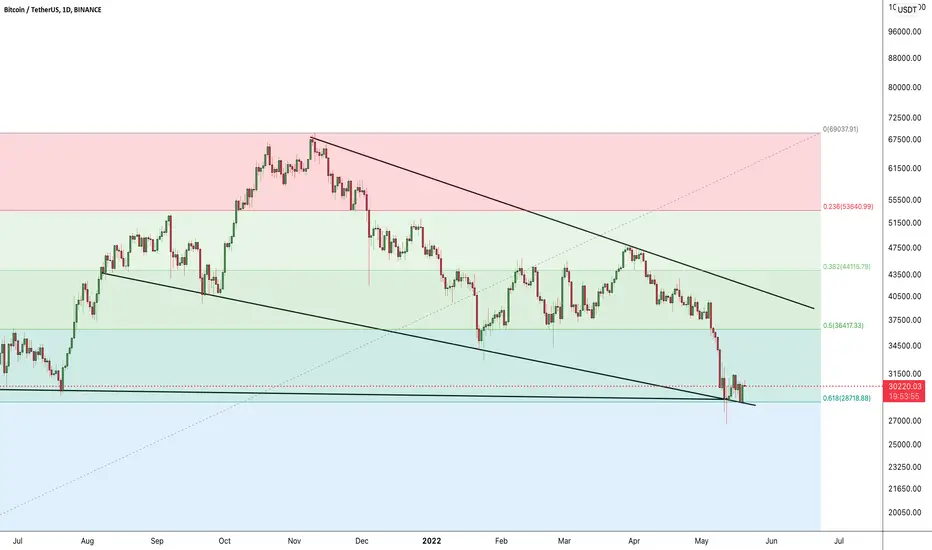
As I mentioned in my previous chart that is Nothing much change to see at this daily time frame BTC is still trading above the support zone which is $29.5k - $30k. and support zone $28.7k and resistance labels is $35k.$40.8k.$47.3k
This is not a piece of financial advice.
Then, hit the like button and share your chart in the comment section if you like it.
thank you.
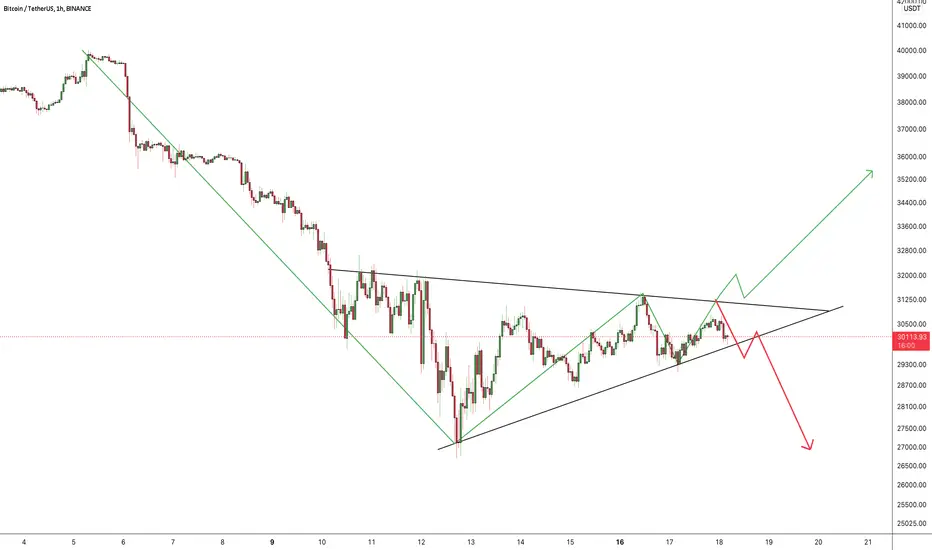
#BTC/USDT 1HOUR UPDATE !!Hello, dear traders welcome you to this BTC /USDT 1HOUR chart analysis.
Hello dear traders, If you find our charts helpful then support our ideas with your LIKE and COMMENT, also be free to ask any question in the comments, and we will try to answer for all, thank you, guys.
CHART ANALYSIS:
BTC is forming a rising wedge-like pattern in 1hr time frame. The direction of the breakout will decide the next move of BTC. If BTC breaks out (Break and close above $31.5k) from this wedge then our target is $35k or if BTC breaks down (Break and close below $29.5k) from this wedge then our target should be $26k
This is not a piece of financial advice.
Sorry for my English it is not my native language. If you like it,o hit the like button and share your charts in the comments section.
thank you.
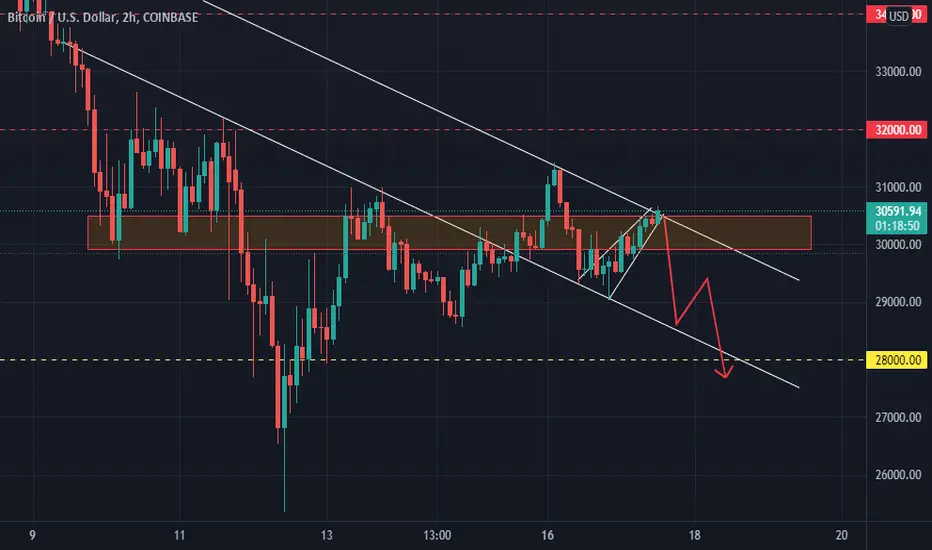
BITCOIN US DOLLARSDouble Top pattern have formed in the graph. It is another good factor to open a sell position.

BITCOIN US DOLLARSAs we can see from the graph, the trend is moving through a downward channel. So I am bearish. Before opening a short position we need a confirmation of candles.
TP 1 - 29000
TP 2 - 28580
TP 3 - 27710
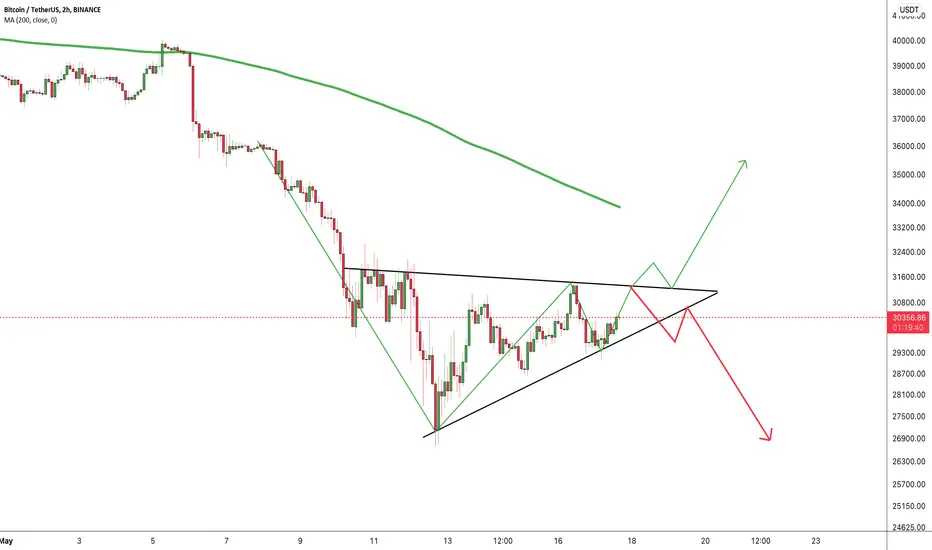
#BTC/USDT 2HOUR UPDATE !!Hello, dear traders welcome you to this BTC/USDT 2HOUR chart analysis.
I have tried my best to bring the best possible outcome in this chart.
Hello dear traders, If you find our charts helpful then support our ideas with your LIKE and COMMENT, also be free to ask any question in the comments, and we will try to answer for all, thank you, guys.
CHART ANALYSIS: In my previous BTC post, I showed you that BTC is forming an inverse head & shoulder pattern and we got the breakout but it didn't go according to the pattern. This is just because everyone is talking about the same pattern ( Inverse H&S ) and market makers never want that more than 90% of people are right so they manipulate the price action. So we have to be extra cautious at this time.
Now let's get to the chart.
BTC is forming a rising wedge-like pattern in 4hr time frame. The direction of the breakout will decide the next move of BTC. If BTC breaks out (Break and close above $31.5k) from this wedge then our target is $35k or if BTC breaks down (Break and close below $29.5k) from this wedge then our target should be $26k
Let's wait for the breakout or breakdown then we will decide our next move.
What do you think about this?
Do you think we go to $35k from here or $26k?
Share your views in the comment section.
This is not a piece of financial advice.
Sorry for my English it is not my native language.
Do hit the like button if you like it and share your charts in the comments section.
thank you.
#BTC/USDT WEEKLY UPDATE BY CRYPTOSANDERSHello, dear traders welcome you to this BTCUSDT WEEKLY chart analysis.
I have tried my best to bring the best possible outcome in this chart.
Hello dear traders, If you find our charts helpful then support our ideas with your LIKE and COMMENT, also be free to ask any question in the comments, and we will try to answer for all, thank you, guys.
CHART ANALYSIS :
As we can see in the above, mentioned chart that weekly candles closed at the price level of $31328.
After the weekly candle close BTC again tossed some % and moved downside, currently BTC is trading at the price level of $29500.
Here it is evident that whenever BTC touches the lower green line support it bounces and left a wick every time.
So, lower green support can be considered a strong support zone for BTC.
Here, BTC needs to candle close above the lower green support to stay in a bullish trend.
This is not a piece of financial advice.
Sorry for my English it is not my native language.
Do hit the like button if you like it and share your charts in the comments section.
thank you.

Bitcoin (BTC)
🧵 Trading Session // Bitcoin
Master Trading Plan: Most traders who fail do not have a clear plan.
The Sell Model by ICT on daily timeframe. Volume, indicators, s/r must confirm the trade.
19000-26000 nice accumulation zone imo.
Take Note:
• 2024 is BTC halving also a prior ATH maybe, then 2025 is our parabolic push for Bitcoin and other altcoins.

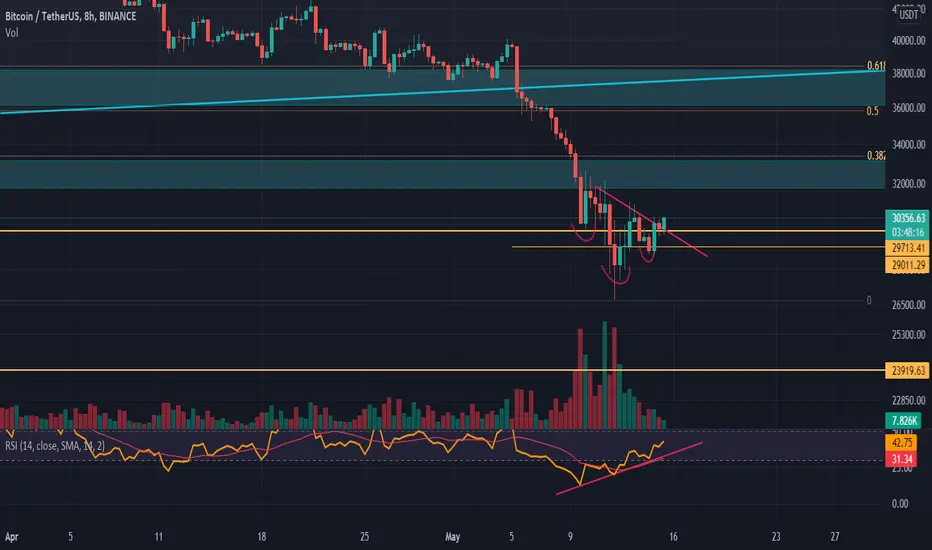
Bitcoin LongBitcoin 8h timeframe chart looking bullish in low timeframes. Inverted Head & Shoulders has formed. Exelent opportunity to go long on bitcoin (4h candle has closed above the neck line). And more bullish divergence confluence on the rsi.
#BTC/USDT 1HOUR UPDATE BY CRYPTOSANDERS Hello, members and welcome to this BTC /USDT quick chart analysis.
As I mentioned in my previous chart that is Nothing much change to see at this daily time frame BTC is still trading above the support zone which is $29.9k - $30.3k and the support zone is $26.9k the resistance labels is $35k.$40.8k.$47.3k
This is not a piece of financial advice.
Then, hit the like button and share your chart in the comment section if you like it.
thank you.