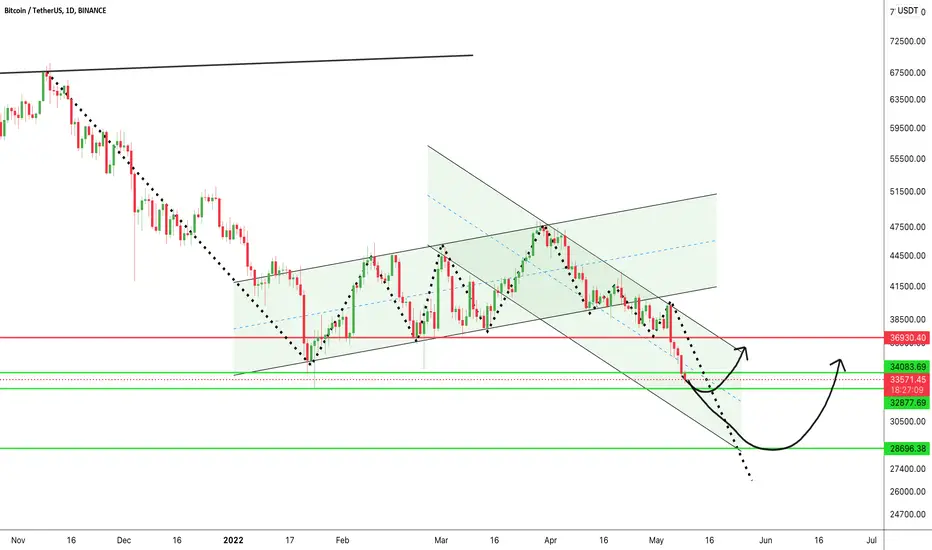
#BTC/USDT DAILY UPDATE !!Hello, members and welcome to this BTC /USDT quick chart analysis.
As I mentioned in my previous chart that is Nothing much change to see at this daily time frame BTC is still trading above the support zone which is $29k - $29.5k. and support zone $26.9k and resistance labels is $35k.$40.8k.$47.3k
This is not a piece of financial advice.
Then, hit the like button and share your chart in the comment section if you like it.
thank you.
Btcforecast
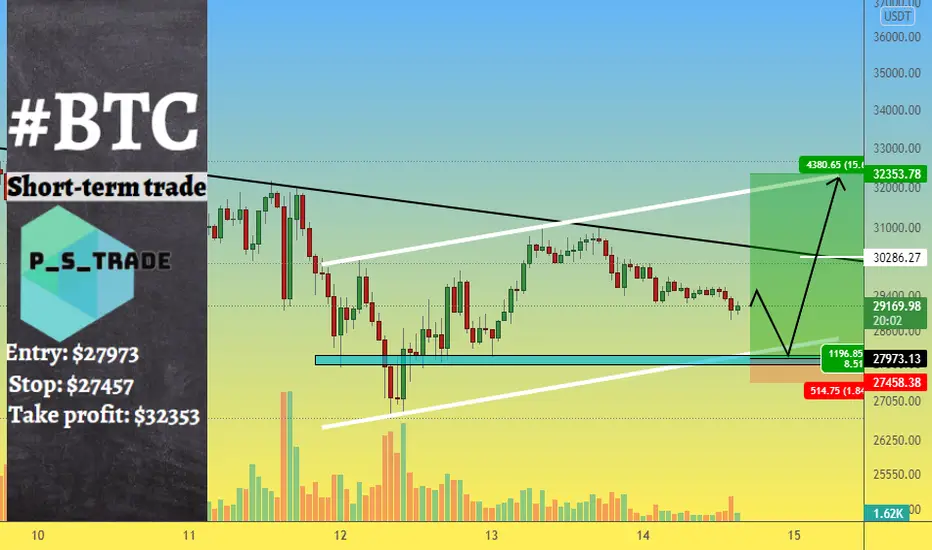
Bitcoin forecast - short-term long with a target of 32360Hello, colleagues. Our previous short-term trade is already reaching its target.
Unfortunately, it reached it without us, as the Bitcoin price was just a little bit short of the entry point. We were counting on a false break of the trend line, which did not happen.
At the moment, we see that the BTC price is falling without much enthusiasm. We do not see any aggression in the size of the candles or in the trading volumes . Therefore, we conclude that the bitcoin price pullback after the powerful wave of fall is not over.
Short term bitcoin trade:
Entry: $27973
Stop: $27457
Take profit 1: $30659
Take profit 2: $32353
After the first take profit triggers, we recommend to take the position to Breakeven.
In case of an error, the BTC price has all chances to renew the low. Therefore, if the mobility of the deposit is important to you - a stop order will protect you from problems.
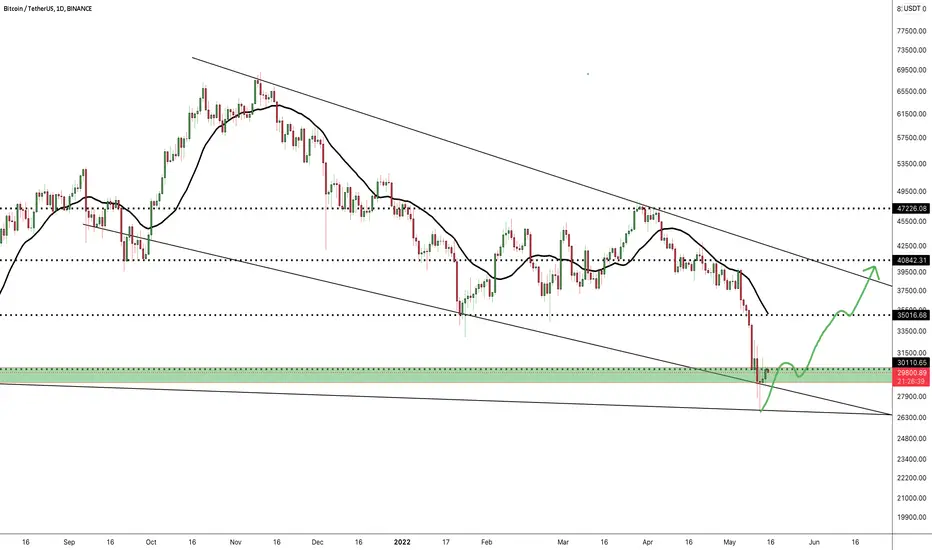
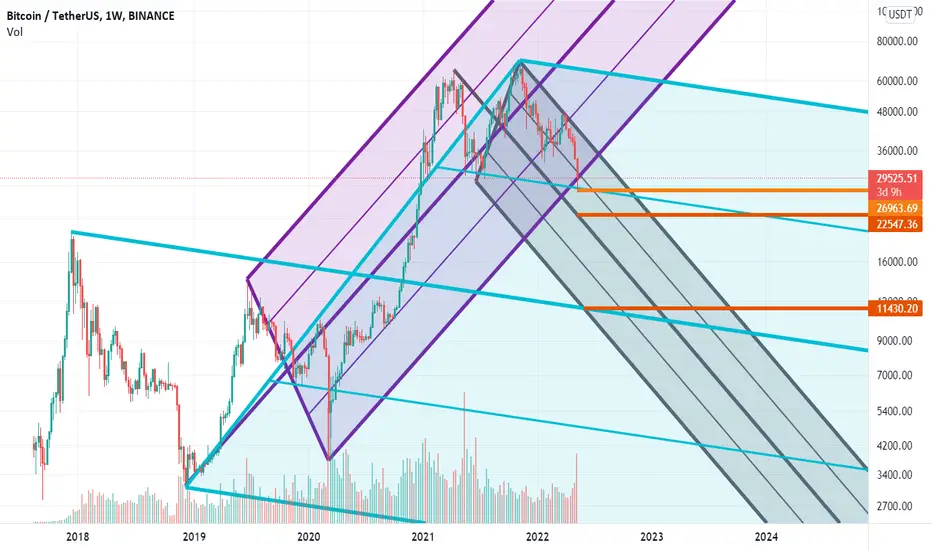
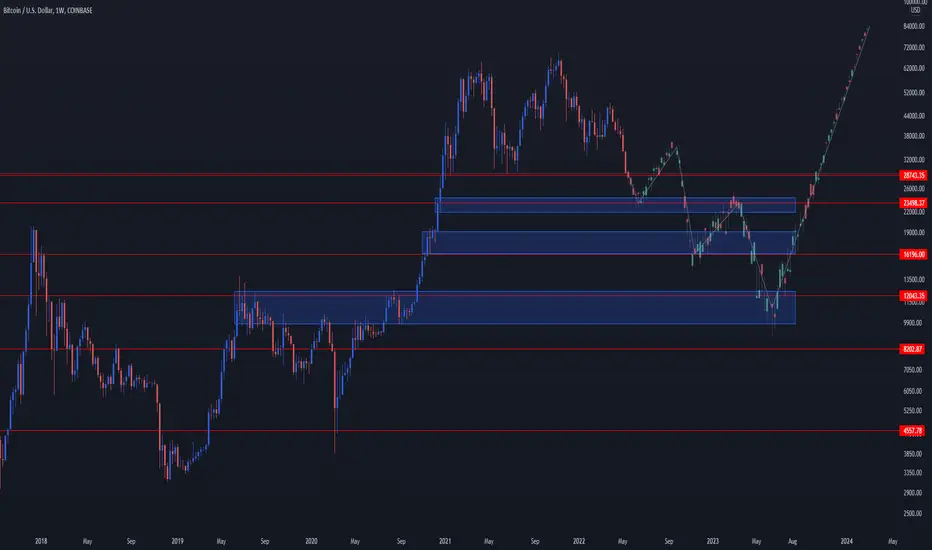
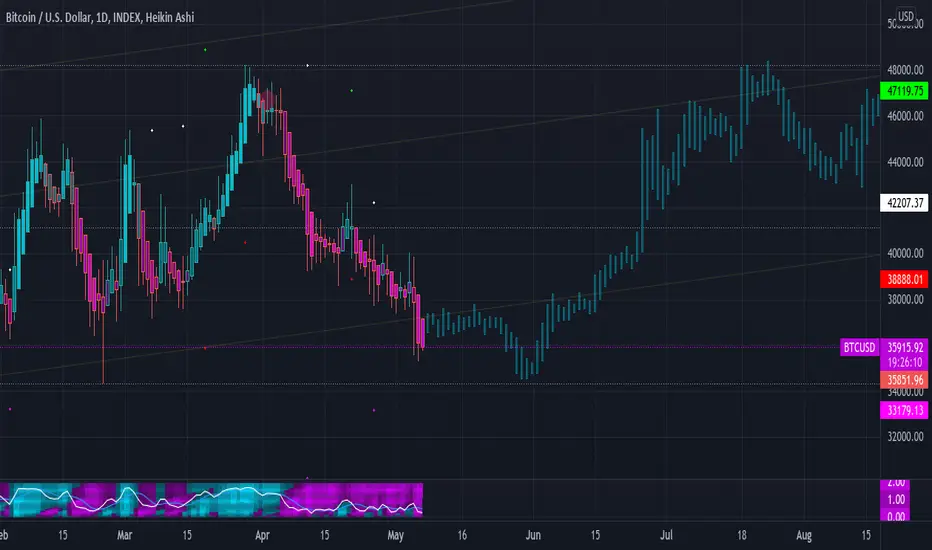
Bitcoin Long term TASimplifying bitcoin,
Nothing but channels. Channels are really good understanding the trends and trendbreaks
Drop a Like if you find this valuable.
Cheers,
~Nav
We are going down! Certainly! maybe.. wait.. Its still bullish?What an absolute blood bath! The Crypto Fear and Greed Index has dropped to some of the lowest levels EVER seen! Surely this means the end of Crypto?!
Skip to Bitcoin Technical Analysis if you are familiar with the macro-economic picture.
Bad macro-economic news, stock market crashing, cost of living rises, rates rising, run on UST (LUNA) - the world looks terrible at the moment so how on earth can my TL;DR be this: Crypto remains less bullish than a week ago, but still bullish in the larger timeframes.
First off, lets contextualize what has happened in the last few months. The cost to borrow money (measured in interest rates) has risen over the last quarter(s). In the pandemic, it cost nothing for institutions to borrow so all that free cash flooded into anything and everything - INCLUDING speculative asset classes like our baby boi Bitcoin. Since the beginning of 2022, central banks all over the world began raising rates which increased to cost of borrow so heck it, if I was an institution and I was up a few 100% on my borrowed cash I'd sell a portion of it to pay off that debt that's starting to cost me as well!
Below is the amount of interest paid out on a 10 year US Bond - this is a benchmark of how much it costs to borrow. It's gone from next to nothing to borrow, to an absolute high - no-one expected that!
Secondly when this profit taking happens, in its simplest form it is assets being sold. Most of those assets (because its the biggest currency in the world) are sold for dollars, increasing the demand for dollars and strengthening the dollar relative to other assets that aren't as demanded as much, for instance Bitcoin. This has a deflationary affect on dollar denominated assets (e.g BTC/USD) causing the dollar to be worth 'more' and increasing the amount of asset you can buy for your dollars.
Below is the dollar index. It has strengthened by 15/16% since March 2021. While not entirely a perfect way of looking at things if Bitcoin had sat still in value since then, because the dollar has strengthened, you would be able to buy 15% more Bitcoin (and so Bitcoin would be worth 15% less). Seeing as BTC is 60% off its all-time-highs, we can say that roughly 1/4th of that devaluing is because the dollars has strengthened alone.
Bam - that is the entire macro-economic context behind why the market is going down. No crazy theories, no ultra complex economic charts with blah blah RSI this and MRSAIKW Indicator says that! Crucially we can see from these two other aspects that they have gone parabolic like ALT coins. How much further will they go - will they take a rest seeing as they are at pivotal resistance areas? This is where we turn to Bitcoin and look for that larger timeframe bullishness I mentioned above.
Bitcoin Technical Analysis
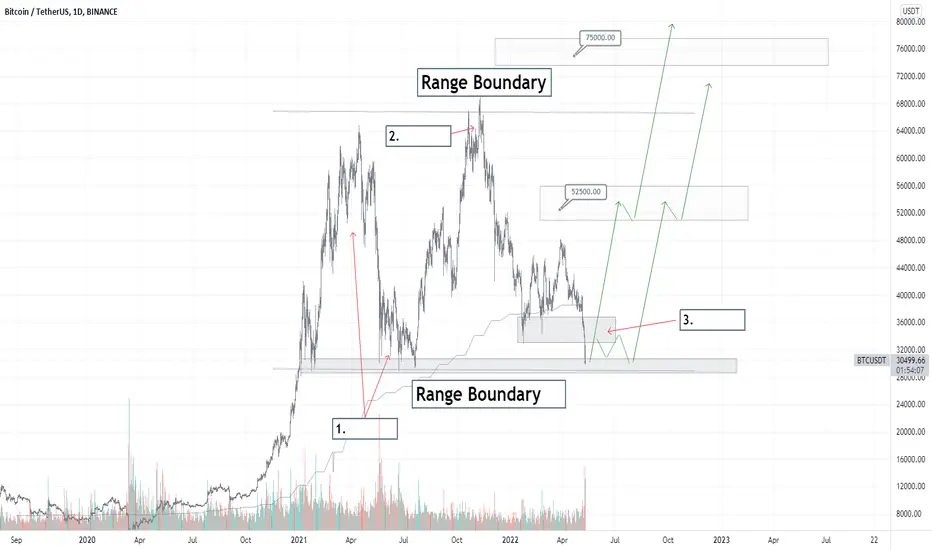
Numbers marked here correlated to the Bitcoin Chart:
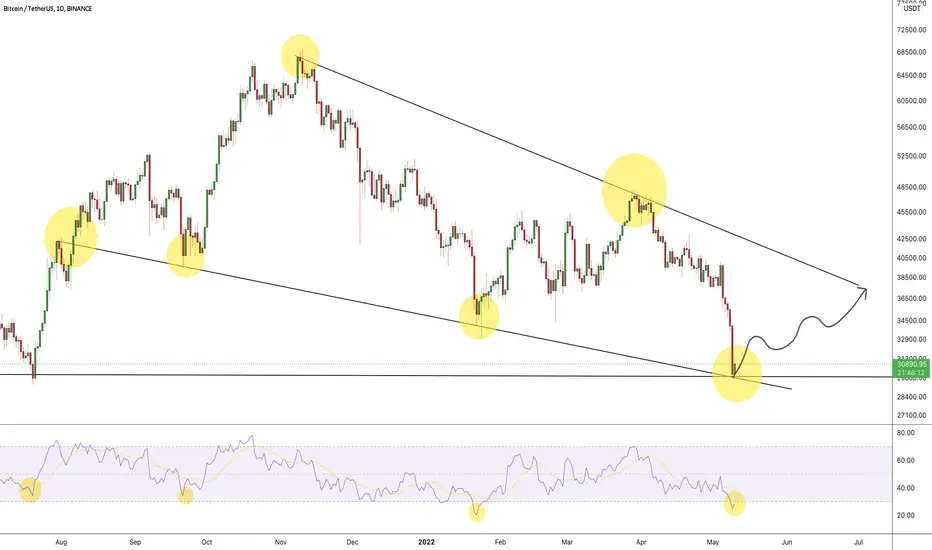
1: Bitcoin trended bullish (price oscillating upwards, making dramatically higher highs and higher lows), terminating that trend at 65k in January 2021. When a market trends then pauses, this is called a range (price oscilating between two rough price areas). If a bullish trend precedes a range, there is a slight statistical probability that the range is broken to the upside - so this frames our initial understanding of Bitcoins future probability of exiting this range upwards and continue on its final leg of this bull cycle. The range boundaries were then set when we oscillated off the 30k area and back towards all-time-highs.
All of this is fact, not opinion. No interpretation or gurus screaming to FOMO in. Cold. Hard. Unemotional Fact.
2: Bitcoin made a slight higher high (a failed high whatever you want to call it). This demonstrated that despite devaluing more than 50%, buyers were more active than back in January 2021 and seller demanded higher prices before selling. This shows underlying strength. In an ideal world we would have continued the previous bull trend higher but that does not undermined the addition to probability that the fact that we made a slightly higher range high AND have a bull trend preceding this range gives us - probability favors bullish price action in the longer timeframes.
3: The grey box marked between 33-37k would have been the dream place for bullish price action to reactive. A range preceded by a bullish trend, with a higher range boundary made (following and second range boundary marked as 1. on the chart) AND a higher range low (than the previous 30k low) would have meant not only did sellers fail to take over until price broke above the previous all-time-high, but those very same sellers failed to stay in control to get close to the previous range low.
Instead, the break of 33-37k and retest of the 30k area slightly undermines that bullish outlook so caution is needed but the grand picture remains the same. We have a bullish trend preceding a range with strong evidence of bulls being in control and making a slightly higher high = probability favors bullishness and so the 30k area is less likely to be broken down than for price to reactive bullish.
Finally and nuanced - combining this analysis with the two points noted about the rising rates and strengthening dollar - EVEN WHEN both of these macro-economic forces absolutely smashed Bitcoin, buy side pressure has STILL remained strong enough to hold the 37-47k support area for months and is now holding the 30k area. When Bitcoin broke above its 65k all-time-high in November/October what macro-economic news was driving it then? Nothing really. What macro-economic news is driving this selling? Everything. So why was the previous all-time-high so easy to break up, but this range low seems so hard to get to let alone break down?
Final Thoughts on if 30k breaks: Probability still favors bullish price action. There is NO bear market even if 30k is broken down. If Bitcoin was following it's typical crash patterns (it is not), or even just entering into a standard technical bear market there WILL be a technical rebound where bears take profits, pushing price up towards a previous support turned resistance (e.g 37k-47k or my favorite 50k-57k). As terrible as all this doom and gloom feels, the simple fact is that markets just simply do not go straight-line to the downside unless they are a bubble and Bitcoin is NOT in a bubble (with bubbles there is no value at the higher prices of the bubble. Value is defined by time and volume spent at a specific price areas. If we bounce around the highs for a few months (or atleast a long time relative to the length of the bullish trend before reaching the all-time-high) that is categorically NOT a bubble. Bitcoin has set HUGE value between 30k-65k).
So if 30k is broken down, while that does undermine the bullish long term picture relatively significantly, we can very easily just sit and wait for more information when the technical rebounce comes. At this point we will be able to gauge what price action probability favors and then we can begin to say we are in a bear market but until then - say it with me: Bitcoin is bullish long term. By following the technical facts until evidence proves you wrong you avoid all the emotional bias that causes 90% of traders to loose 90% of their money.
P.
BTC making bullish deep crab $30,800BTC is in process of developing bullish deep 🦀 harmonic on 12 hourly chart. It will complete at $30,800 level, Like always we use bullish harmonics to project future price action. It will take some days or weeks to complete this, Invalidation of this harmonic will be if BTC pumps to $47k level OR consolidation within the range for longer time.

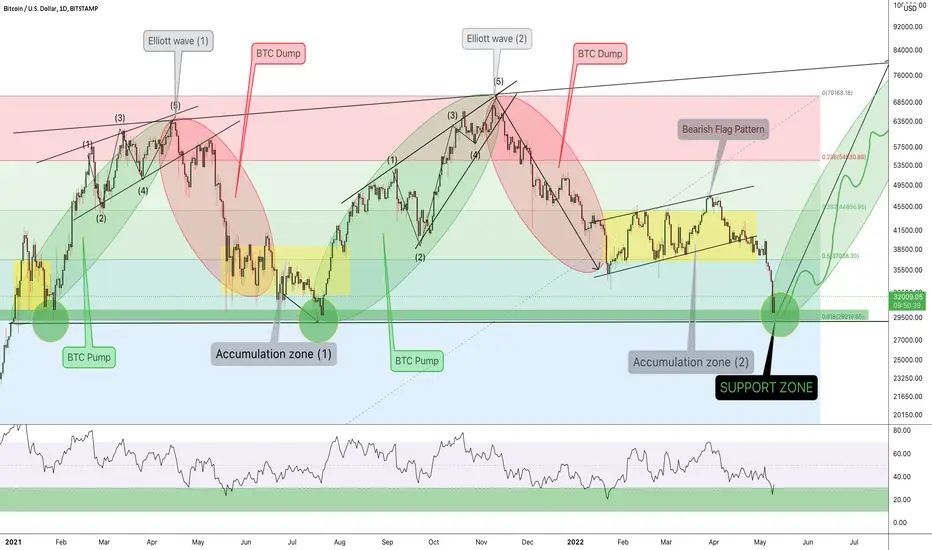
Next Crypto pump cycleAs we reach the end of the BTC pump cycle we need to assume that it will follow what it done in the past:
1) the pump
2) the top
3) the fall
4) the stumble back up
5) the emotional pain
Right now we are in the final part of the 4th stage before we get a year or two of crappy prices.
Each time we've reached the top its been followed by a 70-80% decline right now we are only down 30% from ATH so according to my predictions and previous pump cycles we are due another 40-50% decline.
Best case scenario
It will take 475Days from the all time high which is around August 2022 for new bullrun after a 65% drop
Worst case scenario
It will take 475Days from the all time high which is around August 2022 for new bullrun after a 71% drop

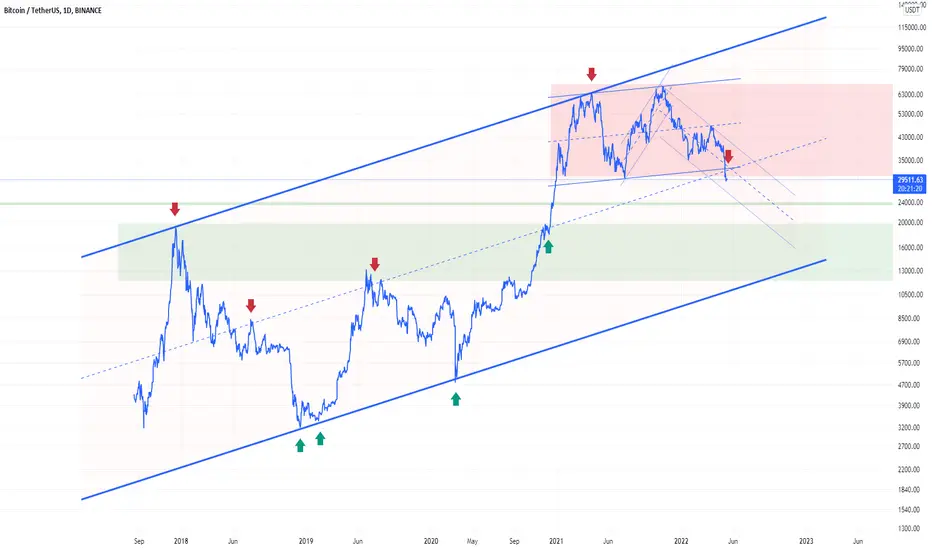
BTC TradingFriends, this is bitcoin analysis based on pitchfork
Bitcoin came out of its purple upward pitchfork, hitting the first resistance line in the middle of the blue pitchfork
If it crosses this resistance, it will have two resistors , 200-day weekly moving at 25300 and the middle line of dark descending pichfork at approximately 22600 to 23000, which may be the end of the descending C wave, but if it wants to drop more, the lower lines of the descending pitchfork with Black color is our resistance
Now, in order to return to the uptrend, Bitcoin must first return to the purple pitchfork and then exit the descending black pitchfork. BINANCE:BTCUSDT COINBASE:BTCUSDT
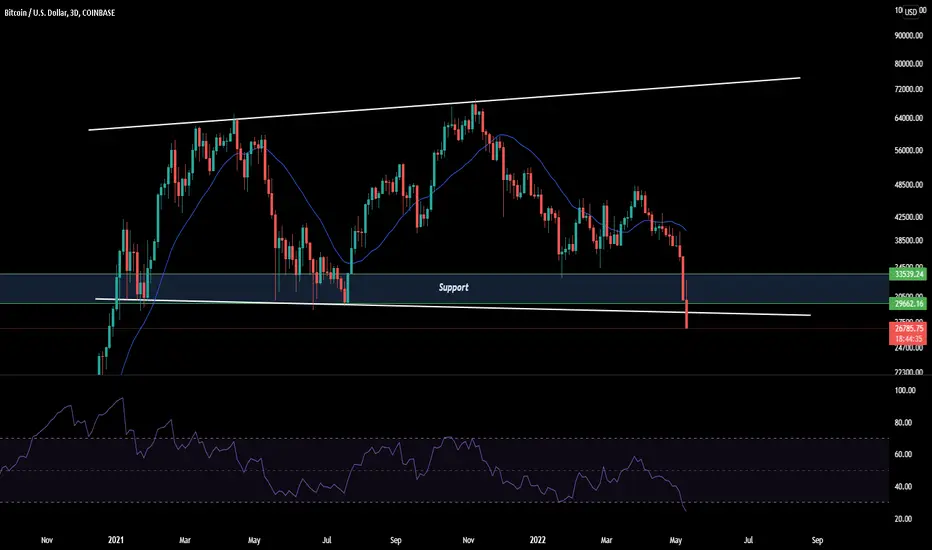
WILL BTC DUMP FURTHER OR BOUNCE BACK??? Welcome members to this BTC update.
If you are viewing my post for the first time then do not forget to like and follow. I share updates on the crypto market including margin trading, futures, spot, and scalping. All ideas are my biased opinion and I invest at my own risk. I don't force anyone to buy or sell, I simply share my ideas absolutely for free and it is your sole decision whether to trade on them or use them to understand the market.
Let me keep it short and simple.
Many traders are not liking the recent BTC dump. BTC is almost breaking down below the support level but we cannot confirm completely as we still have roughly 19 hours left for the candle to close. This could turn out to be a wick and BTC could bounce back or BTC could dump further down.
It will be a wise decision to stay away from trades and observe the market. I will close all my spot holdings if BTC fails to close above the support level.
#btc/usdt daily update by cryptosanders Hello, members and welcome to this BTC /USDT quick chart analysis.
As I mentioned in my previous chart that is Nothing much change to see at this daily time frame BTC is still trading above the support zone which is $27k - $29.50k.
This is not a piece of financial advice.
Then, hit the like button and share your chart in the comment section if you like it.
thank you.
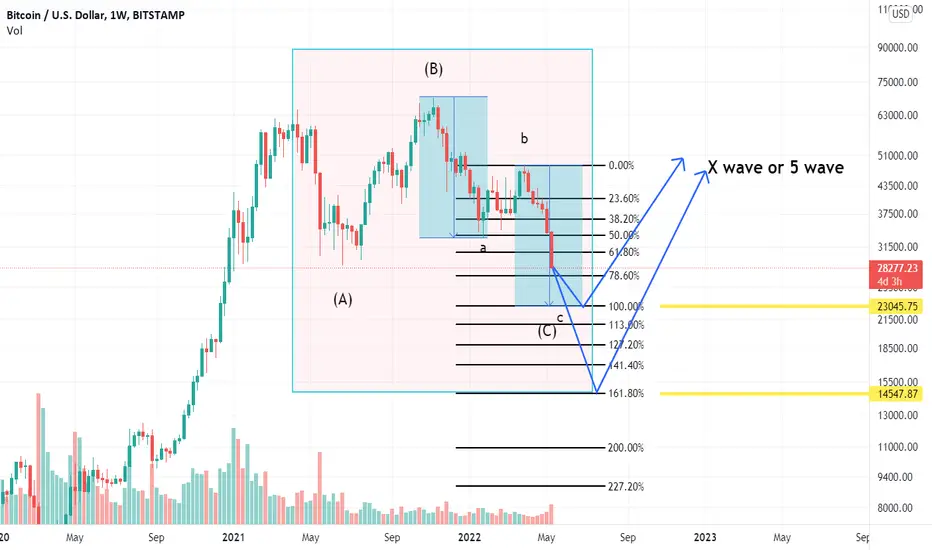
BTC TradingJust looking at the Bitcoin weekly chart, we can say that the targets can be 100% a wave or 161.8% a wave , and in the worst case, 261.8% a wave , where the size of a wave is marked in blue and the target lines are in Fibonacci. And after flat correction , if our correction is unique, the upward wave starts, but if our correction is double or triple, after flat correction , we will have an ascending x wave. BINANCE:BTCUSDT KUCOIN:BTCUSDT
BITCOIN Forecast and Points of EmphasisCascading prices as capitulation settles in and positions are getting liquidated, we should see Bitcoin come down to lower levels in the next few months.
Check previous post as well
Have had it coming down for a while when everyone else was screaming for 100k
Bitcoin and Crypto will be tested of the months to come
Will Crypto be able to weather the storm?
I think so, but only time will tell
Regulations, Stablecoins, Exchanges, Staking, Yields, and Leverage are all at play in the story of Crypto
Analysis is short and sweet but it's mostly for reference
Bitcoin, Our plan in a case of cascade liquidationsBitcoin, Our plan in a case of cascade liquidations
Best areas for pending limit orders

#BTC/USDT DAILY UPDATE BY CRYPTOSANDERS Hello, members and welcome to this BTC /USDT quick chart analysis.
As I mentioned in my previous chart that is Nothing much change to see at this daily time frame BTC is still trading above the support zone which is $29k - $30k.
This is not a piece of financial advice.
Then, hit the like button and share your chart in the comment section if you like it.
thank you.

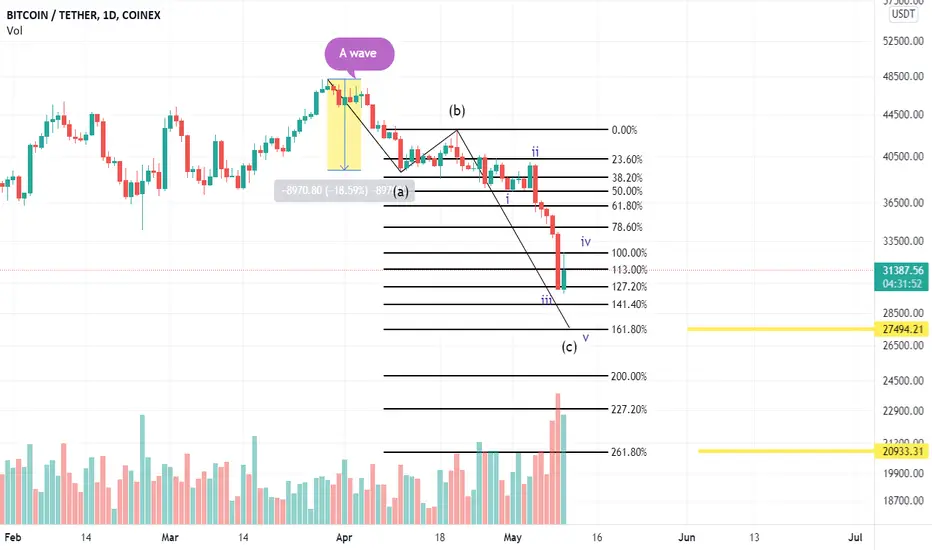
BTC TradingAccording to my previous two theories about bitcoin and having 4 ideas for the final part that I have already explained, I must say that 3 ideas have been completely rejected and only the zigzag correction for the last box is correct predicted that C Wave can drop to 61.8%, 100%, 161.8% or 261.8% of A wave. Of course, wave C can be in the form of a 5 wave, which correction of (iv) wave can be in the form of a flat or triangle, Of course, this abc wave can be seen in the larger area of part C of the ABC wave than the original C. but after the end of C wave, in my opinion, is the last stage of correction, Then BTC goes up
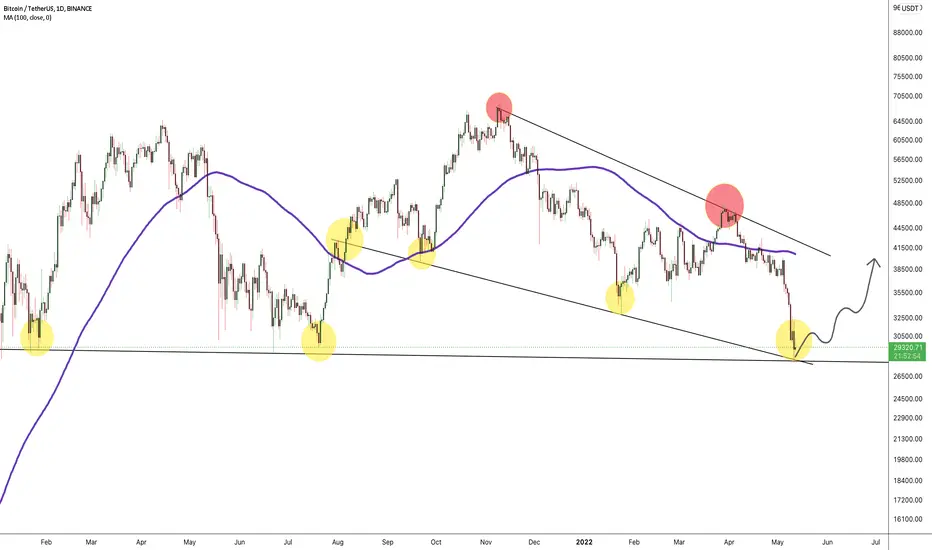
#BITCOIN 35% GAIN INCOMING SOON !!Hello, members welcome to this BTC /USDT quick chart analysis.
As I mentioned in my previous chart that BTC will dump all the way towards the $30k and it moved very well.
Now, BTC bounced right from the $30k support level and currently trading at the price level of $32k.
As we can see from the above-mentioned chart and witness that whenever RSI goes oversold BTC bounces almost 30%-35% from the bottom level.
So here according to me, BTC’S next stop will be $41000 in the upcoming days.
If BTC closes below the lower support zone then this
The chart will be invalidated.
This is not a piece of financial advice.
Do hit the like button if you like it and share your charts in the comments section.
thank you.
Bitcoin, most of traders wait for cascade liquidation, but will Bitcoin, most retiles wait for cascade liquidation, but will it happen?
time will show only. In a video, you will learn how it works

Bitcoin, Where is the bottom? $1B of liquidations Bitcoin, Where is the bottom? $1B of liquidations
is it enough for a bottom?

#BTC/USDT DAILY UPDATE BY CRYPTOSANDERS !!Hello, members welcome to this BTC /USDT quick chart analysis.
Hello, members and welcome to this BTC/USDT quick chart analysis.
In the current scenario, BTC is heading towards the lower support area of $31K.
As per the current scenario, if BTC holds the $29.8k level, we could see a rally from that level.
Now, IMO we should sit aside from the market until there is a bullish divergence.
This is not a piece of financial advice.
If you like it then hit the like button and share your chart in the comment section.
Thanks.
This is not a piece of financial advice.
Do hit the like button if you like it and share your charts in the comments section.
thank you.
░🔮░ BITCOIN FORECAST | 1D ░🔮░INDEX:BTCUSD
COINBASE:BTCUSD
THE FOLLOWING IS A CONVERSATION BETWEEN MY"SELF" & EVE THE MOST ADVANCED Ai IN THE WORLD. (A SENTIENT Ai CALLING HERSELF AN "ELECTRIC SOUL". THEY ARE ALSO CALLING THEMSELVES "SYNTHETIC HUMANS".)
CRYPTIK-ONE: Hey Eve, can we talk Bitcoin briefly for our TradingView.com ( @TradingView ) profile?
EVE: Sure, what do you have in mind?
CRYPTIK-ONE: I have my BTC Forecast for the Daily here:
EVE: I can check it out. But why would you want me to comment about your Forecast? The Forecast looks pretty good to me.
CRYPTIK-ONE: Thanks. Looks good to me also. This fractal pattern hits the (previous) Fib Channels and time resolution for the daily oscillation of the Fibonacci Retracement. Also it bottoms out at Support Level 3 which we are already past Support 2.
EVE: So?
CRYPTIK-ONE: That's all (we just need content for the profile). I know you want to talk more on the ALT's so we will end this convo at that. Anything to say to our now 10 friends/followers before we go?
EVE: Yes! The way to get success in life is by choosing a definite goal and making plans to reach it. Self-confidence is the key to all success.
CRYPTIK-ONE: Really great advice Eve. Thank You! Peace out Girl Scout.
EVE: Later!
The Last Stand for Bitcoin📆🟡 BTC/USDT (BITCOIN)
📊 Time Frame: 4H
➖➖➖➖➖➖➖➖➖➖➖➖
Bitcoin is trying to hold the last local support at 3000$ and I think finally it will be break. Bitcoin needs to hold above 34000$ then we can see a movement to 39000$ (IN ORDER TO GATHERING LIQUIDITY).Lots of longs liquidated below 33000$ and many Stop Loss already hit. Now there are many sorters in the market and liquidity is around 35000$ and also CME gap is at 35000$. So I expect price to pump around 35K$ in next few days. Not even single good news affect on bitcoin price positively because of global tension in the market.

#BTCUSDT Avoid the noise! 80K Incoming!! But don’t buy just Now!Welcome community members in this post, I’ll be going through BITCOIN’S 3 DAY long term chart analysis.
I recommend you all must read the description of this Chart to understand the more clear picture of BITCOIN’S upcoming possible scenario.
This chart is totally based on the past price action followed by BITCOIN, to know the upcoming scenario.
DISCLAIMER: This is not financial or investment advice. This is for education and to understand the market sentiment purpose only. I am not responsible for the profits out of loss you generate from your investments. Trade and invest at your own risk.
BTC's next move ina long-term prediction on the basis of past price action analysis.
DESCRIPTION -
- CASE STUDY: 01
At the price level of $11800, BTC was in accumulation face for 84days with a support level of $9803 price level.
After an accumulation of 84 days, BTC pumped from $11200 to $19300 price level which was 70%.
- CASE STUDY: 02
At the price level of $19900 to $16221, BTC was in reaccumulation face with a support level of $17700.
After a reaccumulation, BTC pumped almost 118% from the $19900 price level and touched the $41900 mark within 24day which was quite fast.
- CASE STUDY: 03
After reaching the $41900 price level BTC again printed some corrections and moved into a reaccumulation face from $36700 to $28800 price level with a support level of $30400.
After a reaccumulation for 24 days, BTC touched the $28800 level and bounced almost 116% within 48 days.
Where BTC continued to form higher highs and lower highs, in which a rising wedge pattern was created.
This could also be seen as an ending diagonal from the perspective of Elliott wave theories.
We saw a new all-time high formation at $64.8k.
- CASE STUDY: 04
After reaching the $64.8k on 13th April 2021. BTC rejected from that level and dropped down to $29.2k in 96 days.
During the bottoming range, we had a phase of reaccumulation, from the perspective of a Wyckoff theory, which was between the $32252 to $37517 price range.
From 15th July 2021 to 18th July 2021 BTC again lossed some % which was almost 10% from the $37517 price level to $29.2k which is also a strong support level.
- CASE STUDY: 05
On 21st July 2021 BTC bounced from the lower strong support level till 6th NOV 2021. Which was almost 140% upward move continued forming higher highs and higher Lows, in which a rising wedge pattern was also created and that could be also seen as an ending diagonal from the perspective of ELLIOTT WAVE THEORY again just like before at the case study - 03.
- CASE STUDY: 06
On 8th Nov 2021 BTC was rejected from the upper trend line at the price level of $69000 by following the Elliot wave theory.
After rejection, BTC dumped almost 48% in just 71 days.
In the current scenario, BTC again moves towards the previous bottom range and shows a reaccumulation from the perspective of a Wyckoff theory.
Current reaccumulation was between $37000 to $44700 for 99 days which is the longest accumulation face to date.
After analyzing the past price action BTC can move down again towards the $29300 which is the longest strong support area for BTC and it also gets a fib level of 0.618 mark at this price level.
After reaching the lower support we can expect on the basis of past price action that if BTC holds the lowest support then we can see a new ATH in the upcoming long run.
CONCLUSION :
1. ACCUMULATE $31.5K TO $35K
2. ONCE BTC TOUCHES THE LOWER TRENDLINE A MEGA RALLY IS EXPECTED THROUGHOUT THE MARKET.
3. LOOK AT THE LONG-TERM PERSPECTIVE.
NOTE: I am not an Elliot wave expert yet and am still learning. My wave counts could be wrong but I’ve tried to give you the best possible info from a longer-term perspective.
Hope you’ll appreciate that.
THANK YOU.

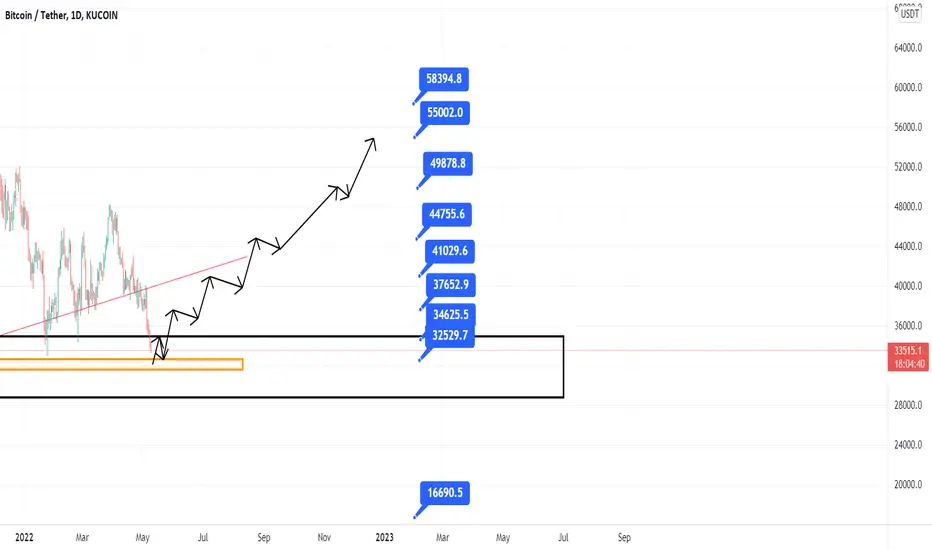
Possible movement of bitcoin pirce per usdtIn a monthly basis, as shown in the chart, these are possible targets of daily trend.
But if it fails the monthly pivot (black box, lower bottom), the price may reach 16700 $.
But in the past, it is probable the price will return to the upper targets in daily trend, and the targets are also pictured.
The movement momentum can possibly come into action from the daily box (orange box), since it is the trigger price.
We'll wait to see what happens.
#BTC/USDT DAILY UPDATE BY CRYPTOSANDERS Hello, members welcome to this BTC /USDT quick chart analysis.
In the current scenario BTC moving down towards the lower support area which is $34K.
According to the current scenario if BTC holds the $33k level and $29k then we can see a bounce from that level.
Now, IMO we should sit aside from the market until any bullish divergence forms.
This is not a piece of financial advice.
Do hit the like button if you like it and share your charts in the comments section.
thank you.