#BITCOIN MOVIG TO WORDS $32.8K SUPPORT ?Hello, members welcome to this BTC /USDT quick chart analysis.
In the current scenario BTC moving down towards the lower support area which is $35K.
According to the current scenario if BTC holds the $34k level and $32.8k then we can see a bounce from that level.
Now, IMO we should sit aside from the market until any bullish divergence forms.
This is not a piece of financial advice.
Do hit the like button if you like it and share your charts in the comments section.
thank you.
Btcforecast
#BTC/USDT DAILY UPDATE BY CRYPTOSANDERS !!Hello, members welcome to this BTC/USDT quick 1day chart analysis.
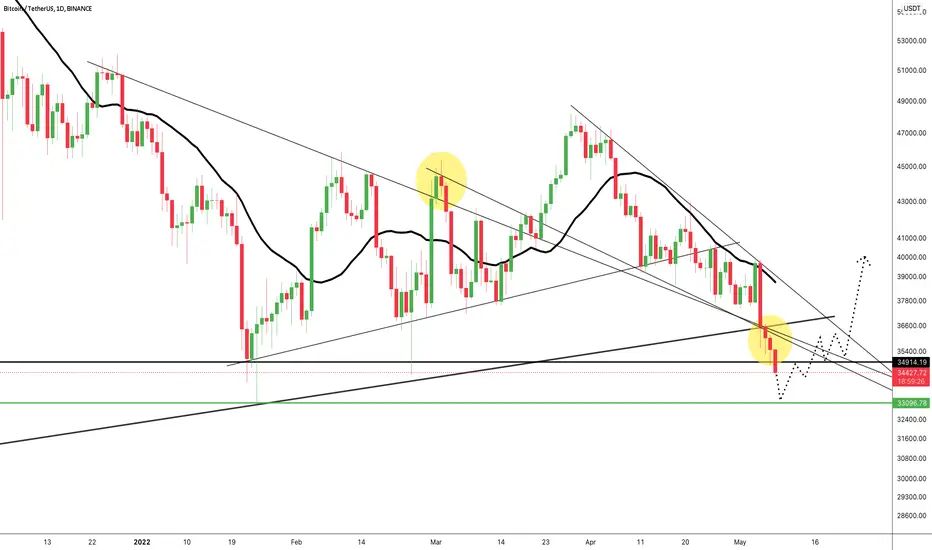
As in my previous chart I mentioned that BTC needs to hold the lower mid support level to stay in a bullish mode, now btc broke the $35k mark support level.
In the current scenario BTC moving down towards the lower support area which is $33k.
Here we should wait to witness BTC’s next move in the upcoming days.
According to the current scenario if BTC holds the $33k level then we can see a bounce from that level.
Now, IMO we should sit aside from the market until any bullish divergence forms.
This is not a piece of financial advice.
Sorry for my English it is not my native language.
Do hit the like button if you like it and share your charts in the comments section.
thank you.
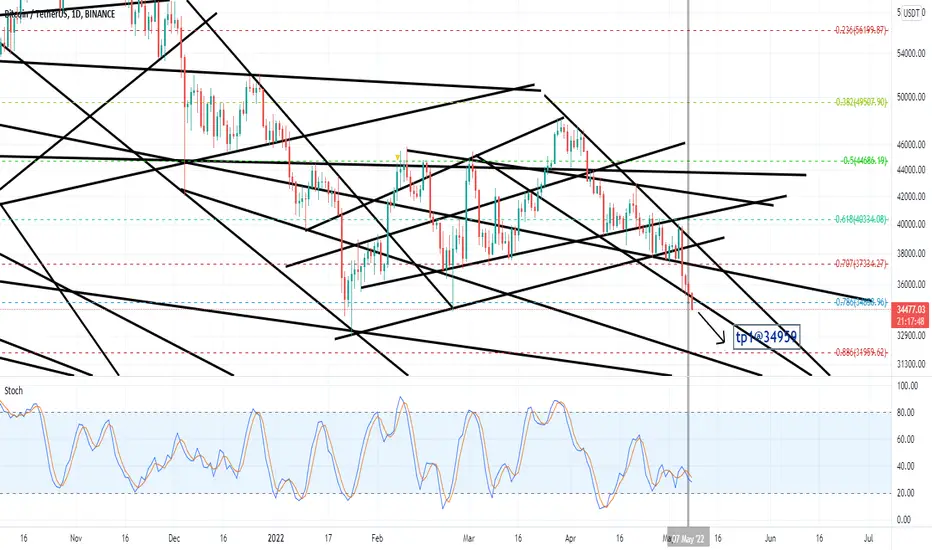
BTC fallin to 34959BTC is falling sharply and will fall to at least 34959.
Based on the many trendline drawn on the bitcoin chart, unfortunately it must be said that bitcoin will have a drop to reach its next trend, which will be around 34959. Forecasts will still be ascending around seventy-seven thousand and above in the future, but the world now wants bitcoin to fall.
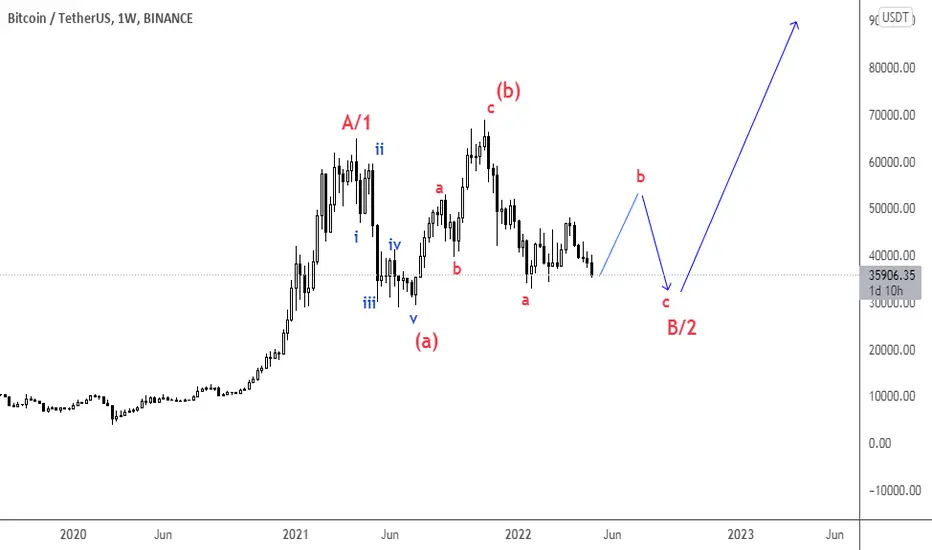
BITCOIN ON CORRECTION PHASE ! when the correction phase we saw in bitcoin in the past,we can clearly see that the bitcoin takes time to complete a correction wave , on that point I can say bitcoin will go below the 27000 price range then we can see a rally of an impulsive move
thank you!
#BTC/USDT DAILY UPDATE BY CRYPTOSANDERS I have tried my best to bring the best possible outcome to this chart.
Show some support do hit the like button, follow and comment in the comment section. this motivates me to bring this kind of chart analysis on regular basis.
Hello, welcome to this BTC /USDT daily chart update by CRYPTOSANDERS.
Welcome community members in this post, I’ll be going through with BITCOIN’S DAY chart analysis.
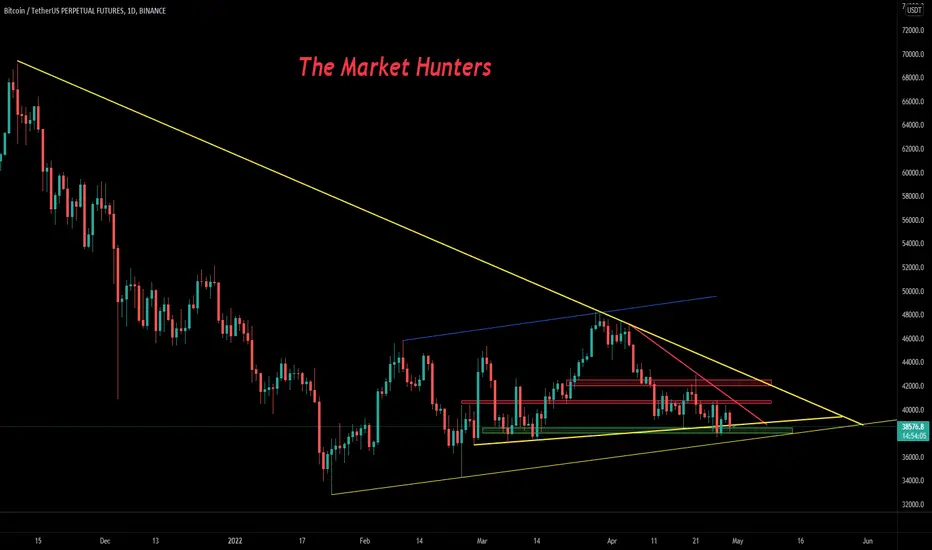
As we can see in the above-mentioned chart that BTC dropped more % after breaking the falling wedge pattern and trading above the lower support line.
As you can see the yellow spot marks which represent the fakeout where btc broke the triangle pattern and got back inside the triangle.
Just like before I am expecting that in the current scenario is also a fake-out and it can get back inside the wedge pattern we just need to wait for the daily closing.
If BTC is unable to sustain the lower mid support then lower support will be the most crucial support which BTC needs to must hold to stay bullish in the daily time frame.
This is not a piece of financial advice.
Sorry for my English it is not my native language.
Do hit the like button if you like it and share your charts in the comments section.
thank you.

#BTC/USDT 4HOUR UPDATE BY CRYPTOSANDERS I have tried my best to bring the best possible outcome to this chart.
Show some support do hit the like button, follow and comment in the comment section. this motivates me to bring this kind of chart analysis on regular basis.
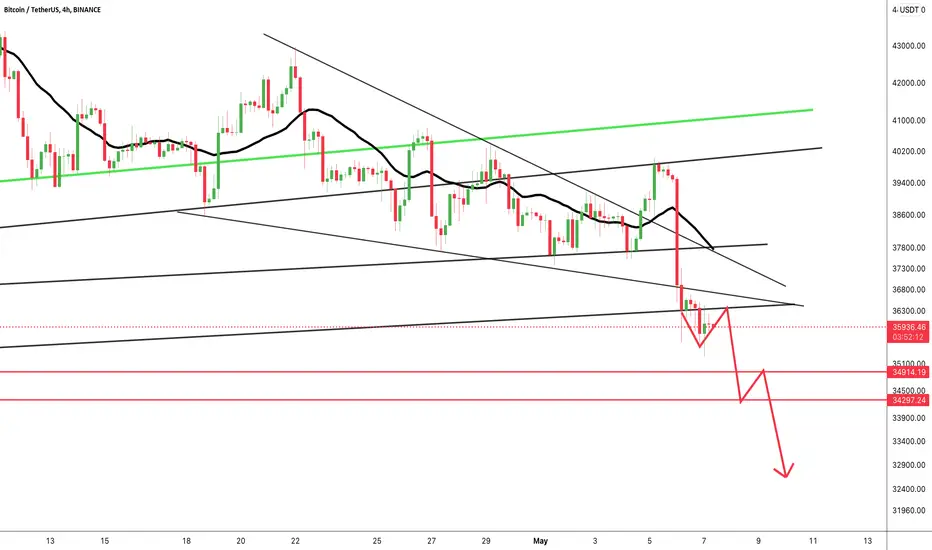
CHART ANALYSIS:-Welcome to this quick BTC /USDT update by CRYPTOSANDERS
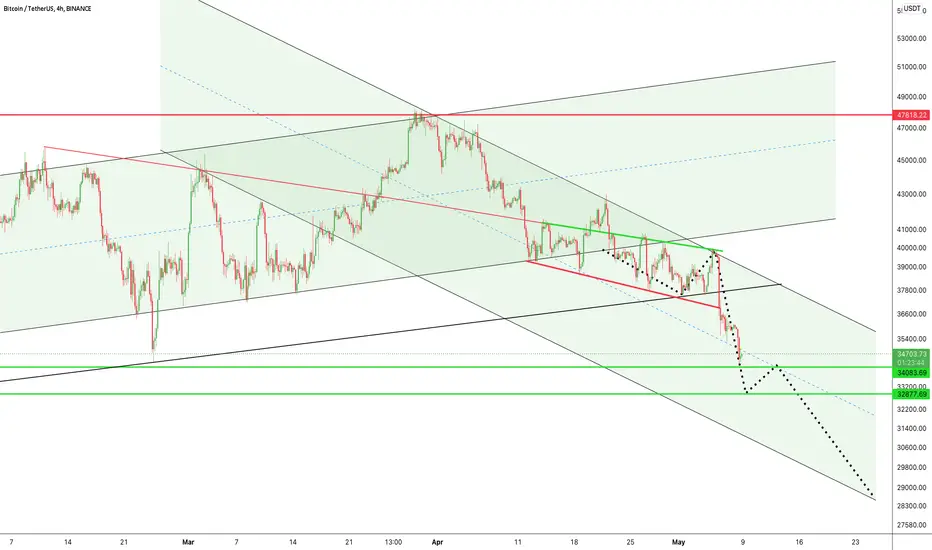
According to the above chat, this is not a good 4hour close for BTC, with a drop of around 3%.
It has formed upper trend line resistance and $36300 support and lower trend line support in a triangle pattern.
Now BTC has a mark of $35000 which
This is another support level that btc needs to maintain in a bullish mode.
If BTC is unable to maintain the current levels then $31500 is the key support level
This is not a piece of financial advice.
Sorry for my English it is not my native language.
Do hit the like button if you like it and share your charts in the comments section.
thank you.
#BTC/USD DAILY UPDATE !Hello, welcome to this BTC/USD daily chart update by CRYPTOSANDERS.
I have tried my best to bring the best possible outcome to this chart.
Show some support do hit the like button, follow and comment in the comment section. this motivates me to bring this kind of chart analysis on regular basis.
CHART ANALYSIS :
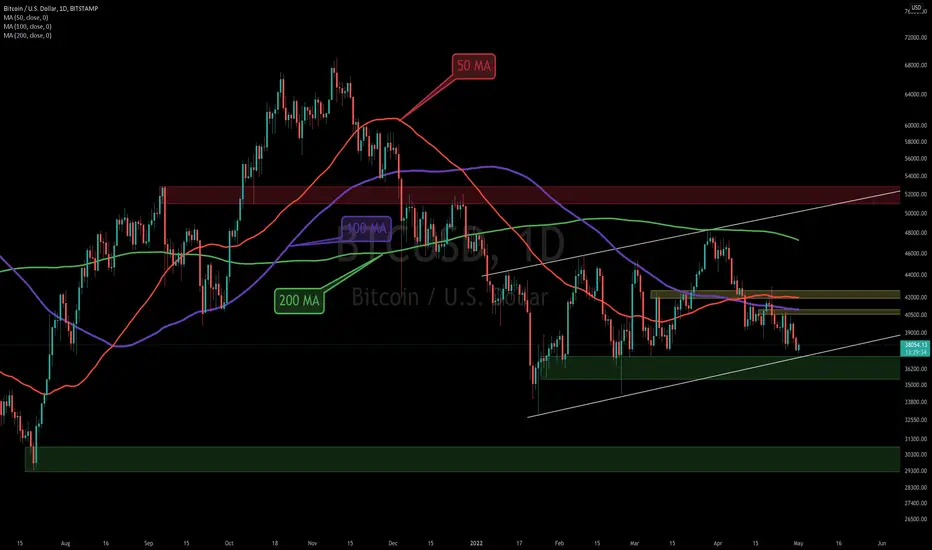
The Daily Chart
The recent trajectory of lower highs and lows has been forming on the chart, indicating a continuation of the bearish trend. As it seems now, BTC’s price targets the $36K support area in the short term, which has held the price on multiple occasions over the past year. However, a break below it could result in a rapid drop towards the $30K demand zone.
This is not a piece of financial advice.
Sorry for my English it is not my native language.
Do hit the like button if you like it and share your charts in the comments section.
thank you.
BTC/USDT 2HOUR UPDATE BY SANDERS !Hello, welcome to this BTC /USDT 4Hr chart update by CRYPTOSANDERS.
I have tried my best to bring the best possible outcome to this chart.
Show some support do hit the like button, follow and comment in the comment section. this motivates me to bring this kind of chart analysis on regular basis.
CHART ANALYSIS:-
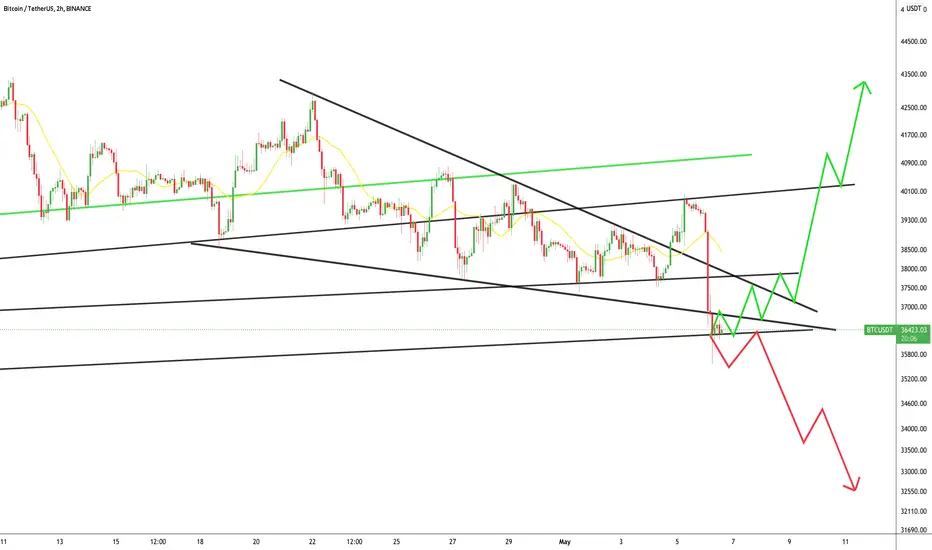
Welcome to this quick BTC/USDT update by CRYPTOSANDERS
As per the above-mentioned chat, not a nice daily close for BTC it lost almost 10%.
It broke the upper trend line support, $38200 support, and the lower trend line support of a triangle pattern.
Now BTC is holding the $36500 mark which
This is another support level that btc needs to hold to be in a bullish mode.
If BTC is unable to sustain the current level then $35k is the major support level
This is not a piece of financial advice.
Sorry for my English it is not my native language.
Do hit the like button if you like it and share your charts in the comments section.
thank you.
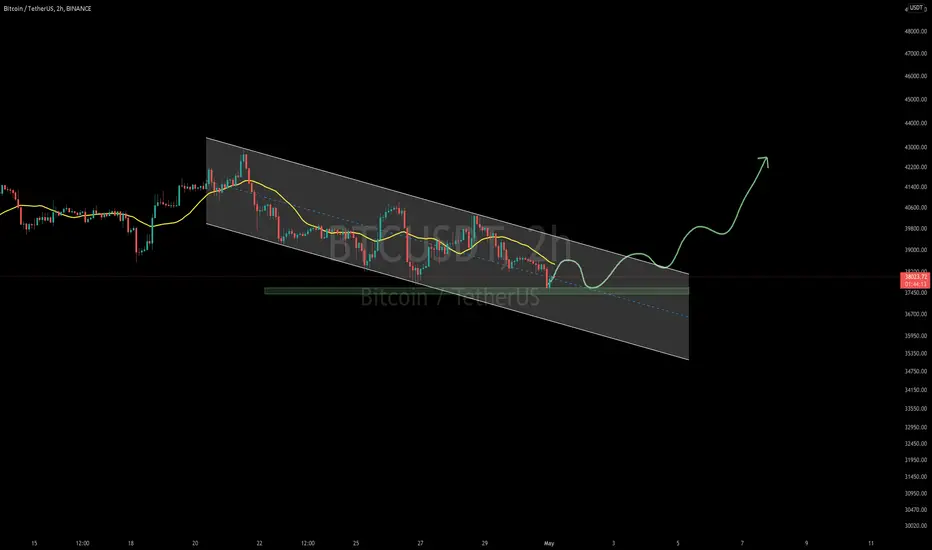
#BTC/USDT 4HOUR UPDATE BY CRYPTOSANDERS Hello, welcome to this BTC /USDT 4Hr chart update by CRYPTOSANDERS.
I have tried my best to bring the best possible outcome to this chart.
Show some support do hit the like button, follow and comment in the comment section. this motivates me to bring this kind of chart analysis on regular basis.
CHART ANALYSIS:-
BTC showed 7.5% curection which already liquidated 50x 100x.
Now in the current scenario btc needs to hold the lower trend line support in 4hr time frame for that we need to wait for a candle close inside the channel pattern.
If btc is unable to sustain the lower trend line support then 35k will be another support level.
This is not a piece of financial advice.
Sorry for my English it is not my native language.
Do hit the like button if you like it and share your charts in the comments section.
thank you.
USDT DOMINANCE AND BTC COMPARISON!!Hi guys, This is CryptoMojo, One of the most active trading view authors and fastest-growing communities.
Do consider following me for the latest updates and Long /Short calls on almost every exchange.
I post short mid and long-term trade setups too.
Let’s get to the chart!
I have tried my best to bring the best possible outcome in this chart, Do not consider it as FINANCIAL ADVICE.
I always emphasize that time in the market beats timing the market, but I want to share an interesting approach that you can consider taking when timing the cryptocurrency market, especially when it comes to Bitcoin's overall direction.
Tether Dominance
- Just as Bitcoin dominance refers to Bitcoin's market cap relative to that of the entire market cap, Tether dominance is no different.
- It refers to how much capital is parked in stablecoins, specifically Tether, at any point in time.
- Since Tether (USDT) is a stable coin that tracks the USD, an increase in Tether dominance suggests a pullback or correction in cryptocurrencies.
- A simple way to understand it is to think of USD flowing in and out of the market.
- On the other hand, if Tether dominance drops, it means that more capital is being deployed to purchase cryptocurrencies, which is bullish overall for the market.
- If you look at the graph above, you'll clearly see the inverse correlation between Bitcoin (orange) and Tether dominance (black).
- Key support and resistance zones for Tether dominance are marked as well.
- As we're currently trading slightly above local support, marked in green, if we see Tether Dominance fall below those levels, we could expect Bitcoin to continue rallying upwards.
This chart is likely to help you in making better trade decisions if it did consider upvoting this chart.
Would also love to know your charts and views in the comment section.
Thank you

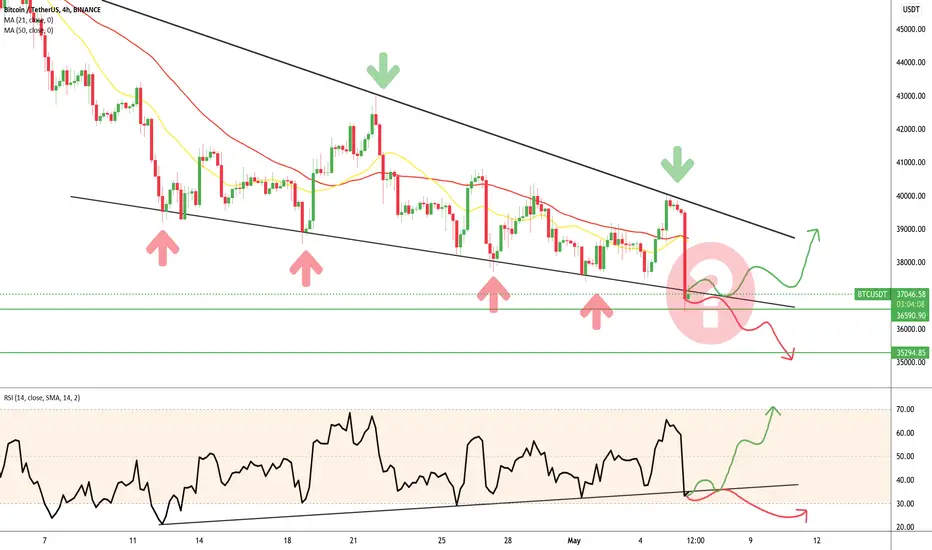
#BITCOIN break the resistance?Hello, welcome to this BTC /USDT 4Hr chart update by CRYPTOSANDERS.
I have tried my best to bring the best possible outcome to this chart.
Show some support do hit the like button, follow and comment in the comment section. this motivates me to bring this kind of chart analysis on regular basis.
CHART ANALYSIS:-
Hello, welcome to this BTC/USDT 4Hr chart update by CRYPTOSANDERS.
I have tried my best to bring the best possible outcome to this chart.
Show some support do hit the like button, follow and comment in the comment section. this motivates me to bring this kind of chart analysis on regular basis.
CHART ANALYSIS:-
As we mentioned in our previous chart that BTC will break and will gain some % that happened till now very well.
BTC also broke the $39000 level resistance and that resistance become now support.
In this scenario, BTC needs to retest the $39000 mark support level which will be more strong confirmation for a bull rally towards the $40800 mark.
In the upcoming hr, BTC will face again the resistance which is $40800 so for a bull run btc must break this resistance level.
Till then we should wait for the break to resistance which will be the signal to get in the market.
This is not a piece of financial advice.
Sorry for my English it is not my native language.
Do hit the like button if you like it and share your charts in the comments section.
thank you.
Bitcoin i think BIG chance for break upBitcoin i think BIG chance for break up
Price failed to drop so many times

BTC trend line is broken. Where to book profit & open new tradesBTC trend line is broken. Where to book profit & open new trades? You will learn it in this video

BTC Daily Analysis! Bullish Triangletoday we are looking at BTC on the daily chart and we see a bullish triangle we ae currently breaking out of and we are trading still within this sideways box. We have a ton of open money sitting in multiple spots above and below the current price action. On the top and bottom sides of the bullish triangle we have money building up on both sides and we are currently breaking to the upside. My thoughts on this particular pattern is that it could quite possibly be a retail trader trap. We have lots of downside liquidity waiting to be taken out and what we could see here is a fakeout to the upside like we may be seeing right now before shooting down taking out bottom side liqudity before bouncing back to the upside and going for all of that liquidity. The reason why i favour this scenario is because it would cause max pain for retail traders and paper hand investors, another fast spike down would wipe out money and also strike massive fear into the eyes of investors. We have a red box drawn that shows a major level of resistance, we have the 236. FIB level we have the Pivot point and the R1 resistance, we do also have multiple EMA's in that zone aswell but i don't want to clutter the chart. On the upside we have a clear Imbalance shown by the green box that at some point will need to be filled. Finally a good target will be around 47.7K at the top of our box, we have been stuck within here and a break and close above that level will likely give us some major momentum to continue moving up! Not financial advice just my opinion!

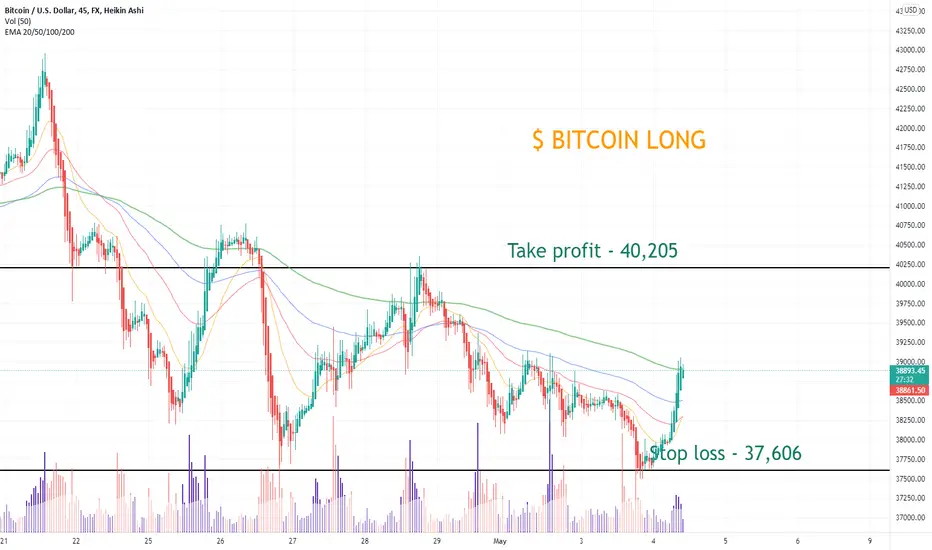
Bitcoin longWe are expecting a bounce in Bitcoin at current levels.
Profit taking level @ 40,205
Tight stop loss @ 37,606 due to expected volatility on FED day
GMT - we can take Long at $3 - volume at bottom is best confirmGMT - we can take Long at $3 - volume at the bottom is best confirmation for our trade

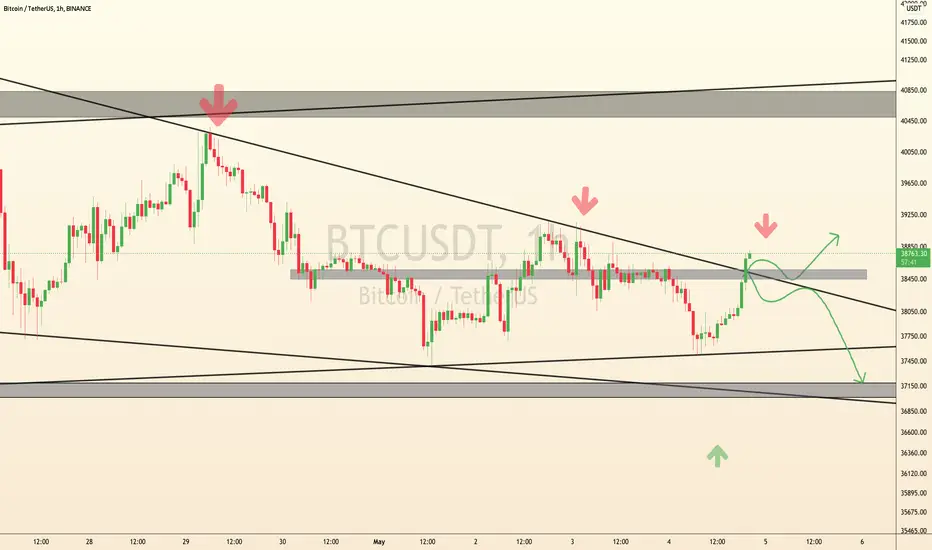
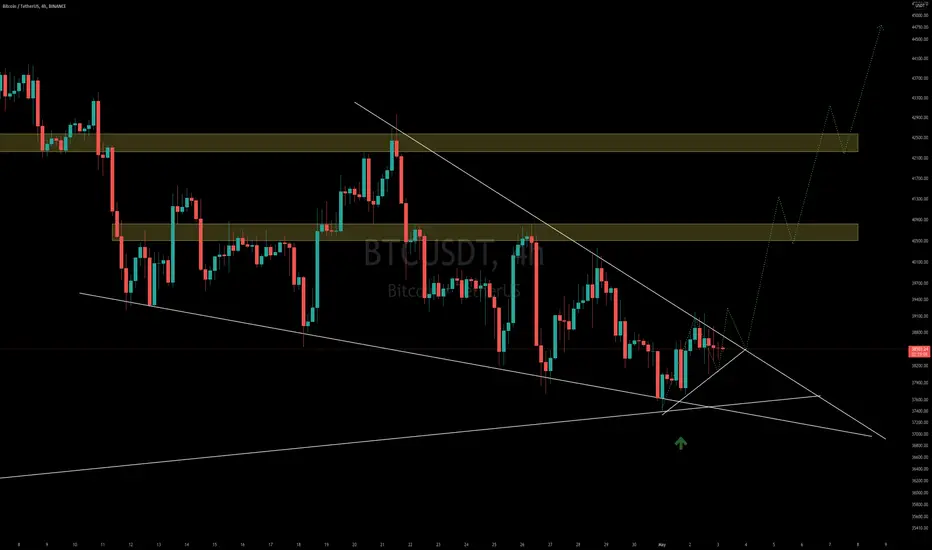
#BTC WILL BREAK OR REJECT WHATS NEXT ??Hello, welcome to this BTC /USDT 1Hr chart update by CRYPTOSANDERS.
I have tried my best to bring the best possible outcome to this chart.
Show some support do hit the like button, follow and comment in the comment section. this motivates me to bring this kind of chart analysis on regular basis.
CHART ANALYSIS:-
As we can see in the above-mentioned chart that BTC/USDT is still trading inside this triangle pattern and trying to break the upper trend line resistance for the fourth time.
This chart shows that whenever the price reaches near the upper trend line it rejects and moves downside towards the lower trend line maximum times.
In this uncertain market, BTC can brake or also can reject from the current price level, if its able to break the upper trend line then BTC will be bullish and if rejects then it will again fall down to the lower trend line.
For now, it's better to wait for confirmation.
This is not a piece of financial advice.
Sorry for my English it is not my native language.
Do hit the like button if you like it and share your charts in the comments section.
thank you.
BTC is in a range, Trade when clean pattern appears BTC is in a range, Trade when a clean pattern appears

#BITCOIN is bullish AND bearish AND fake out? ? Hello, welcome to this BTC /USDT 2Hr chart update by CRYPTOSANDERS.
I have tried my best to bring the best possible outcome to this chart.
Show some support do hit the like button, follow and comment in the comment section. this motivates me to bring this kind of chart analysis on regular basis.
CHART ANALYSIS:-
For now, we should wait for the confirmation to take any position in BTC OR ANY ALTCOINS.
If BTC breaks the lower trend line support then this chart will be invalidated
This is not a piece of financial advice.
Sorry for my English it is not my native language.
Do hit the like button if you like it and share your charts in the comments section.
thank you.
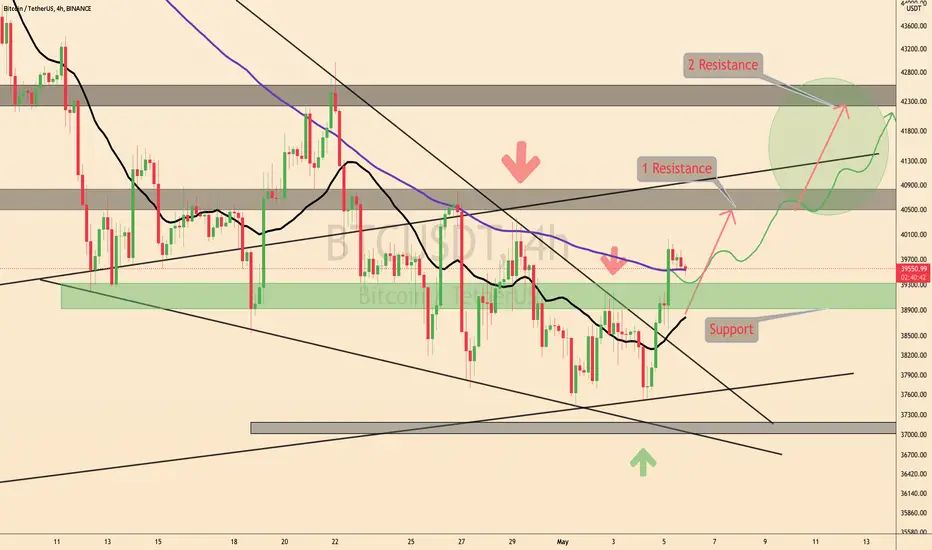
#BTC/USDT 4HOUR UPDATE BY SANDERS !Hello, welcome to this BTC /USDT 4Hr chart update by CRYPTOSANDERS.
I have tried my best to bring the best possible outcome to this chart.
Show some support do hit the like button, follow and comment in the comment section. this motivates me to bring this kind of chart analysis on regular basis.
CHART ANALYSIS:-
On a 4hr chart, nothing many changes we can see BTC is still trading inside the triangle pattern and holding the lower trend line support very well.
As we can see here that btc bounced four times from the lower trend line and four times retested also from the upper trend line.
Now, in the current scenario, BTC/USDT needs to break the upper trend line for a short-term bull trend towards the $42k.
This is not a piece of financial advice.
Sorry for my English it is not my native language.
Do hit the like button if you like it and share your charts in the comments section.
thank you.
Bitcoin, Potential Break up of a trend line Bitcoin, Potential Break up of a trend line
2 main reasons
- Price bounced from the big value area
- 500m liquidations of long buyers that happened during 25 and 26 of April

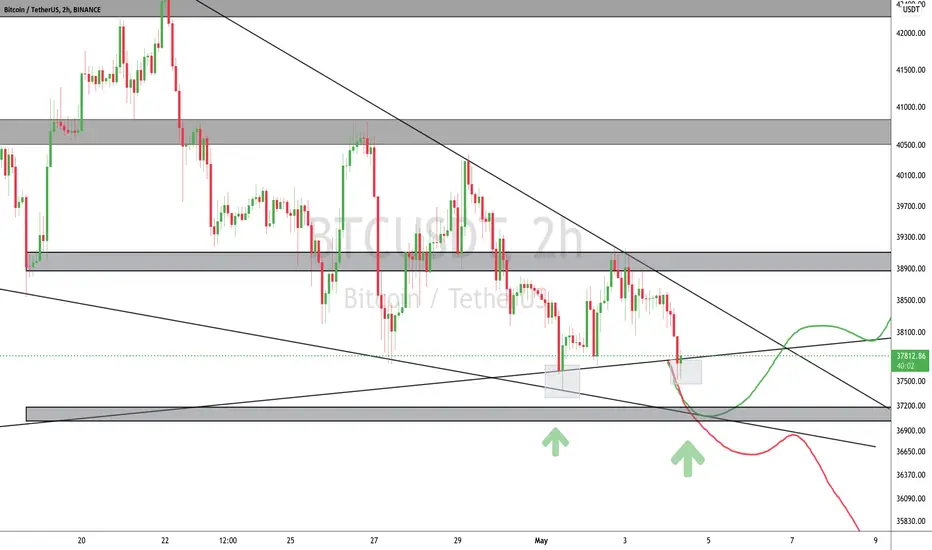
BTC/USDT 2HOUR UPDATEHello, welcome to this BTC /USDT 2hr chart update by CRYPTOSANDERS.
I have tried my best to bring the best possible outcome to this chart.
Show some support do hit the like button, follow and comment in the comment section. this motivates me to bring this kind of chart analysis on regular basis.
CHART ANALYSIS :
BTCUSDT is the bullish trend
and BTCUSDT is the current price of $38000
$38800 brake upside and btc pump!
This is not a piece of financial advice.
Sorry for my English it is not my native language.
Do hit the like button if you like it and share your charts in the comments section.
thank you
BTC rejected hard and reached a build-up support again#BTC rejected hard and reached a build-up support again. Price fell till $38,200 mark. If #BTC follows the wedge pattern then we might see some lower low till around $37,000.
Today is weakend and monthly closing as well so.Trade less and use tight stops.