$BTC Daily UpdateCRYPTOCAP:BTC #BTC Above $56,557 support after good struggle, $58,290-$58,882 test approaching. Expect resistance at $58,290-$58,882 as it's key support area, RSI on 1D and 4H looking good, $56,557 support tested on previous 4H but isn't safe yet. Watch given S/R on the chart
Btcforecast
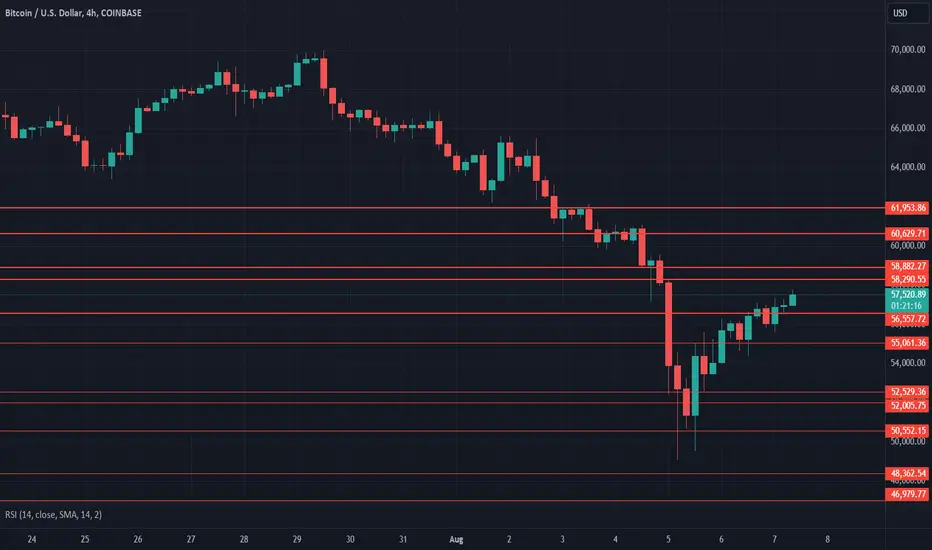
$BTC Daily UpdateCRYPTOCAP:BTC #BTC $56,557 resisting as expected, nice follow up on bullish engulfing on 4H which allowed the test at $56,557. Currently seems to be forming bearish engulfing on 4H, RSI on 1D remains in oversold region, $52,529 seems to be current support area, watch given S/R
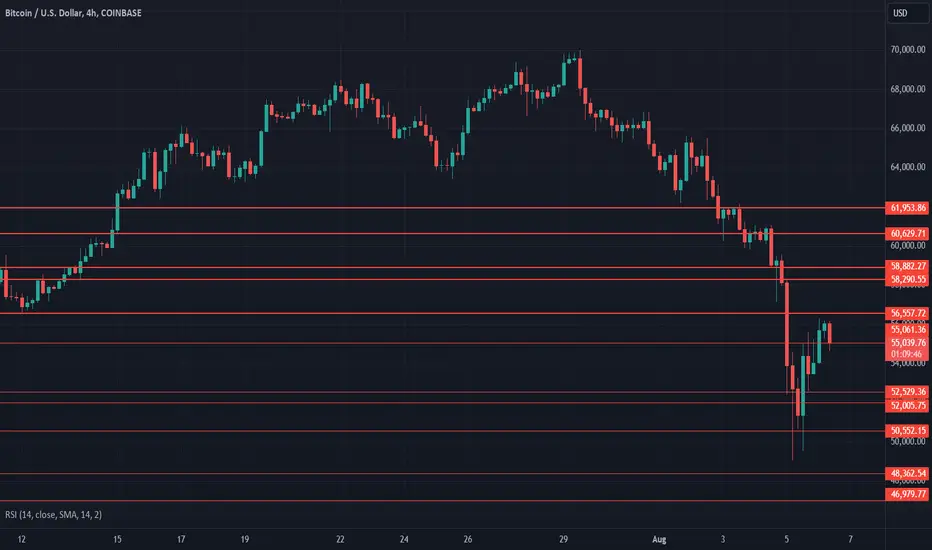
$BTC Daily UpdateCRYPTOCAP:BTC #BTC Nose dived to $52,529 support! RSI on 1D and 4H both in oversold region awaiting sign of reversal. Last 4H close looks good, $56,557 key support to be regained which will resist, $50,552 next key support from here, and $48,362, $46,979 if drops further. No clear sign of reversal yet, watch given S/R

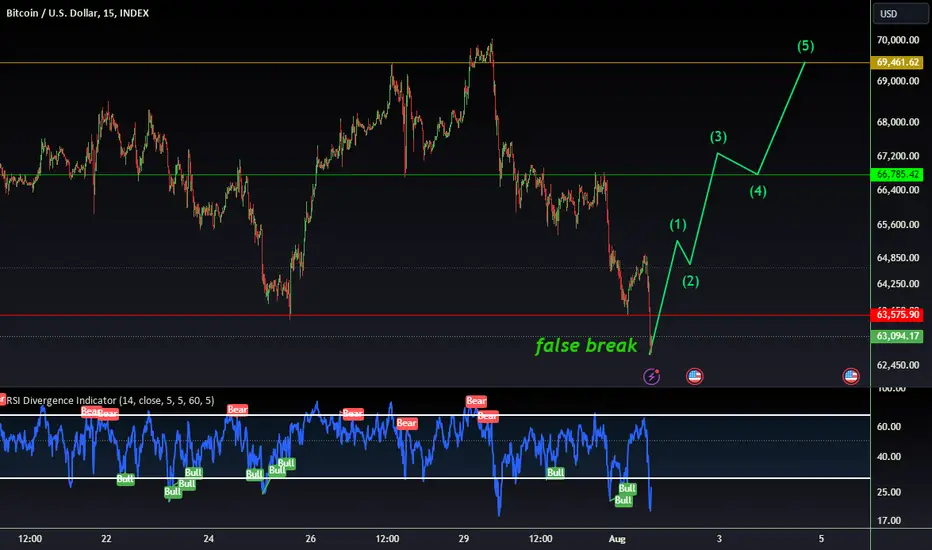
BTCUSD 15Min-TIMEFRAME BITCOIN ANALYSIS💥BTCUSD 15Min-TIMEFRAME ANALYSIS
💗Hello ladies and gentlemen
This is my new idea for 💥BTC Bitcoin
I hope my idea is clear
Please support me by like and sharing thank you
Stay Safe💯💲💲💲
Good luck💰😍
$BTC Daily UpdateCRYPTOCAP:BTC #BTC testing $66,961, previous 1D close looks super good. RSI on 1D and 4H looks good, current 4H looks to be forming bullish engulfing, strong support at $66,961 needed to test $68,546. $65,789 current key support, $68,546 key resistance. Continue watching given S/R
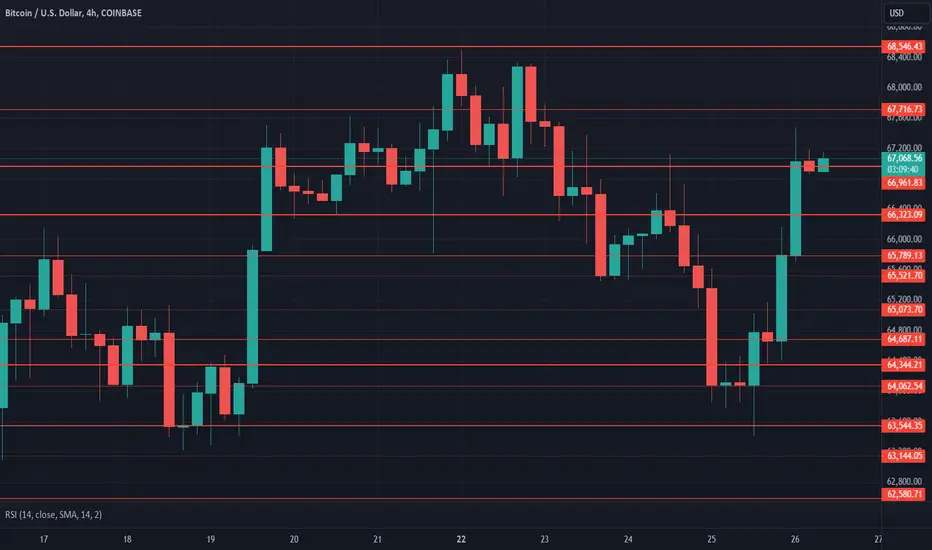
$BTC Daily UpdateCRYPTOCAP:BTC #BTC $66,961 support in effect and testing, $68,546 resisting here, previous 1D close looks good, $66,323 key support here, $69,296 support required to test $71,379-$71,981. Currently forming bearish engulfing on 1D, if bearish engulfing played out expect $66,323 test.
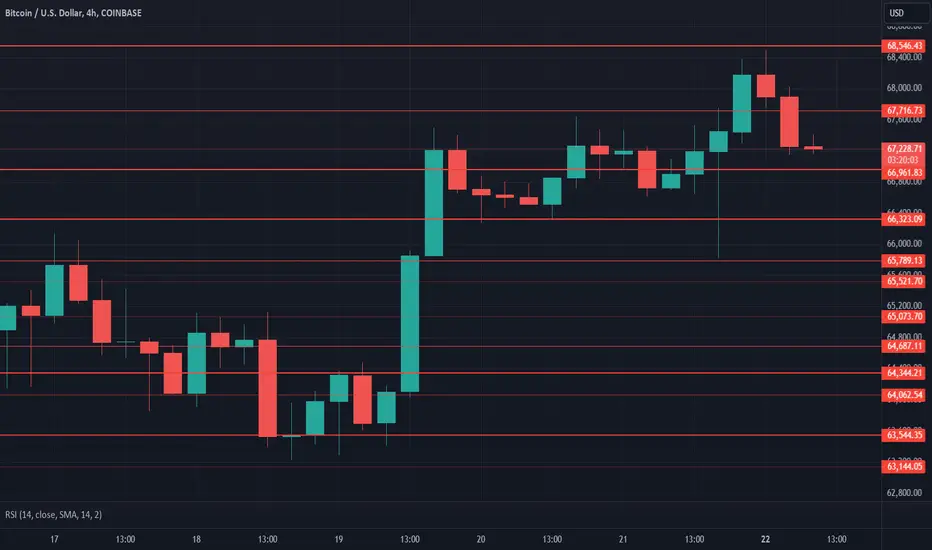
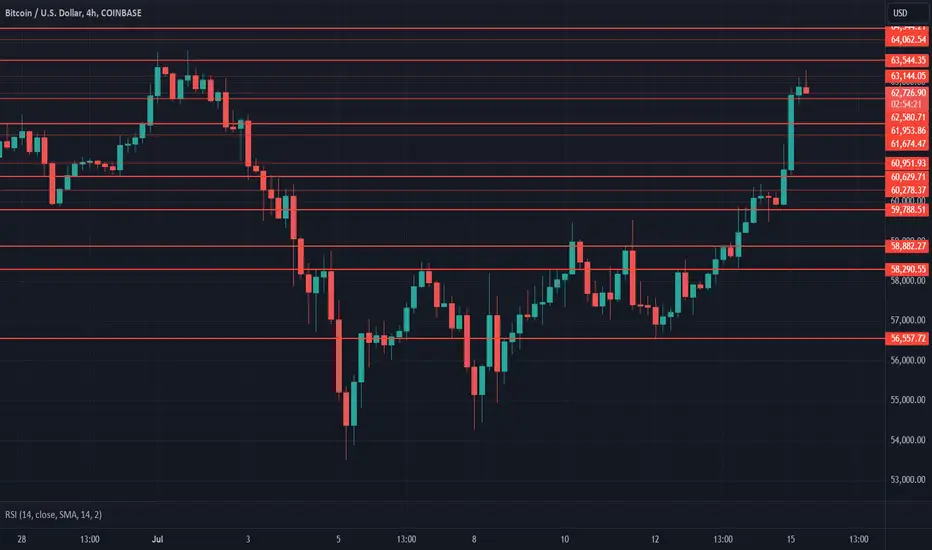
$BTC Daily UpdateCRYPTOCAP:BTC #BTC $63,544 testing, Beautiful push above $60,629 with a test, Current 4H looking bearish, RSI on 4H in overbought region while 1D looking good, support above $63,544-$64,344 will allow test of $66,323, $61,953 current support yet to be tested, watch given S/R
Bitcoin Simple Strategy- The strategy is simple :
---------------------------------------------
- Buy when TOP.
- Sell when BOTTOM. 😂
---------------------------------------------
- Hope u got the Joke.
---------------------------------------------
- Everything is in graph.
- No matter how dip TheKing will go, don't be greedy.
- When they speak Bitcoin is Dead. the bottom is near.
- Focus on the long term.
- Fortune favors the Bold!
Happy Tr4Ding!

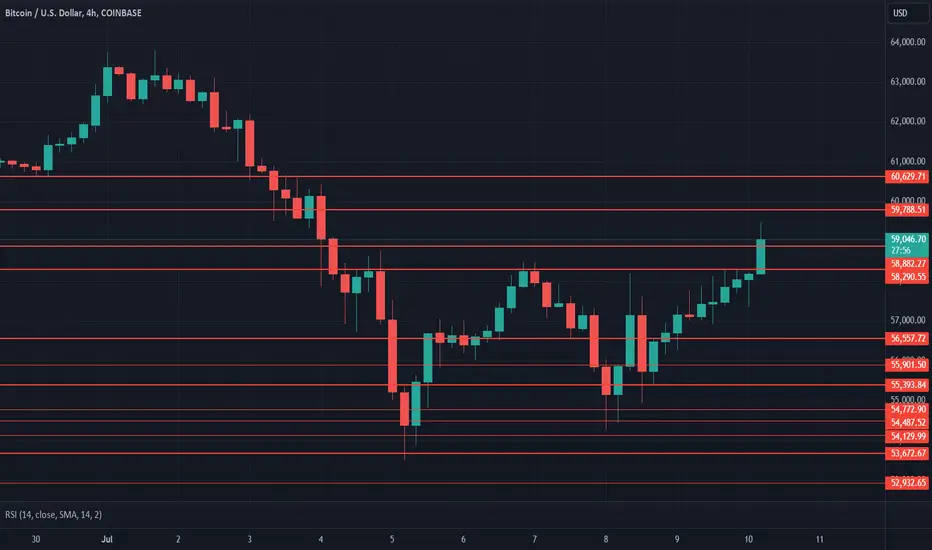
$BTC Daily UpdateCRYPTOCAP:BTC #BTC following up on previous 4H bullish close on current 4H, $59,788 testing, some resistance at $58,882 is also expected, RSI on 1D and 4H looks good, must gain support from $58,882 or it will retrace back to $56,557 test, $60,629 next key resistance, watch given S/R
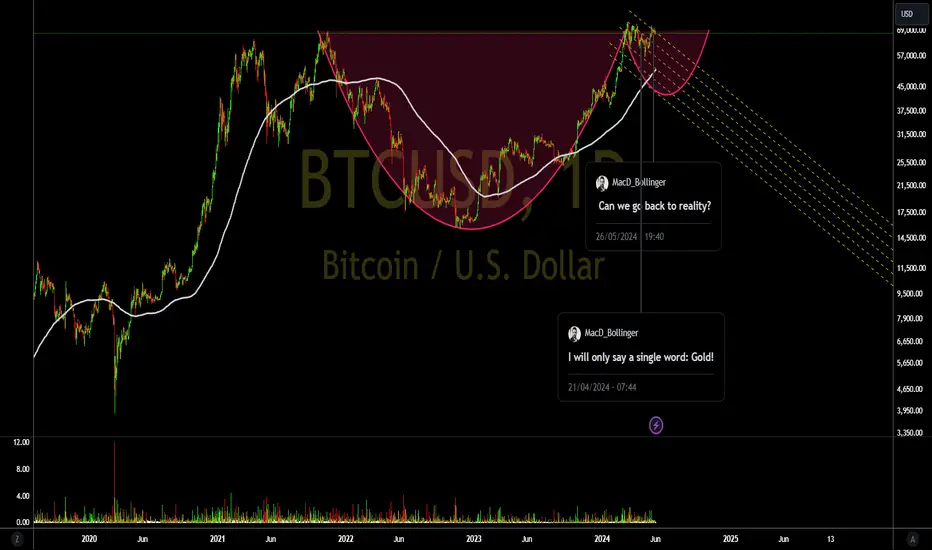
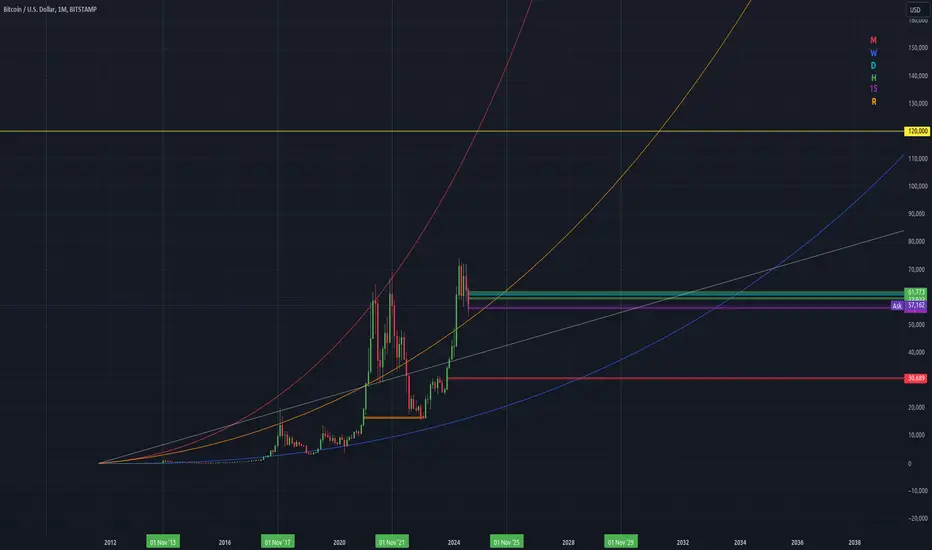
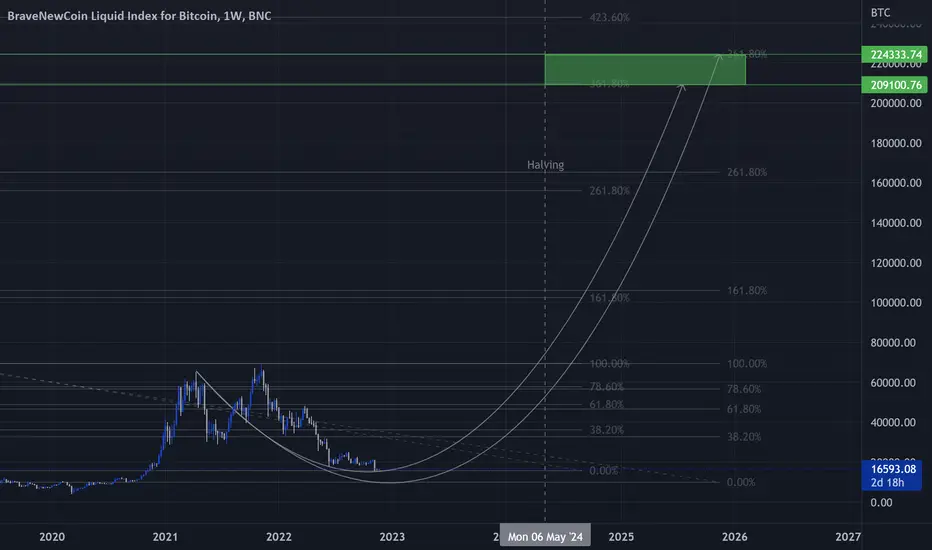
Elementary Bitcoin in its entirety for beginnersUnlike all kinds of cryptocurrencies, the issue of Bitcoin is limited by the condition of a regular reduction in the size of the mining reward. Naturally, the American dollar will always be issued without any special restrictions. This allows you to make a basic calculation: “infinity” divided by “21 million” = “infinity”. That is, theoretically, in the infinite future, Bitcoin can cost as much as you like; based on general data, you can already calculate the nearest maximum target of $120k at the end of 2025. Of course people won't spend all their dollars on Bitcoin because they have other needs to survive. People will buy and sell Bitcoin to achieve their budget goals. Therefore, the price will not rise every day.
Looking at the figure, you can see three symbolic exponents (blue at the bottom, red at the top and orange in the middle) the struggle between buyers and sellers unfolds. But this is not a fact that the price will reach them, since the real exponential median is extended into eternity, or at least for the next hundred years until all Bitcoin is mined. The most likely upward trend will fluctuate around a straight white line. I think the price will charge below this line and shoot exponentially much higher again and again as mankind's speculative sentiment never runs out.
Therefore, in the near future, since the price has not reached its nearest maximum immediately, a break is needed to recharge. Anything can happen at once, but most likely it will drop below the previously mentioned orange exponential and below the white straight line to collect at least part of the liquidity between $28k-33k and reverse fast back to its nearest target at $120k. I believe this downward and upward movement will occur before the end of 2025. However, from my own experience, I can note that my scenarios are implemented much faster because we are not given time, we create it ourselves. Therefore, just stay in touch and watch the unfold of events vertically if you are not in a hurry. =]
I still provide brief comments as the story progresses from that “Watchlist, details and news” section in the upper right corner of the screen on the stationary monitor.
Best wishes.
$BTC Daily UpdateCRYPTOCAP:BTC #BTC $58,290 support in effect, next key support at $56,557 which was last tested on May 01, RSI on 4H in oversold region, approaching oversold region on 1D time-frame too. Second follow up today on bearish engulfing from Tuesday, must hold $56,557 support area to avoid $55,393 support test. $59,788 initial resistance from here, then $60,629-$61,674.

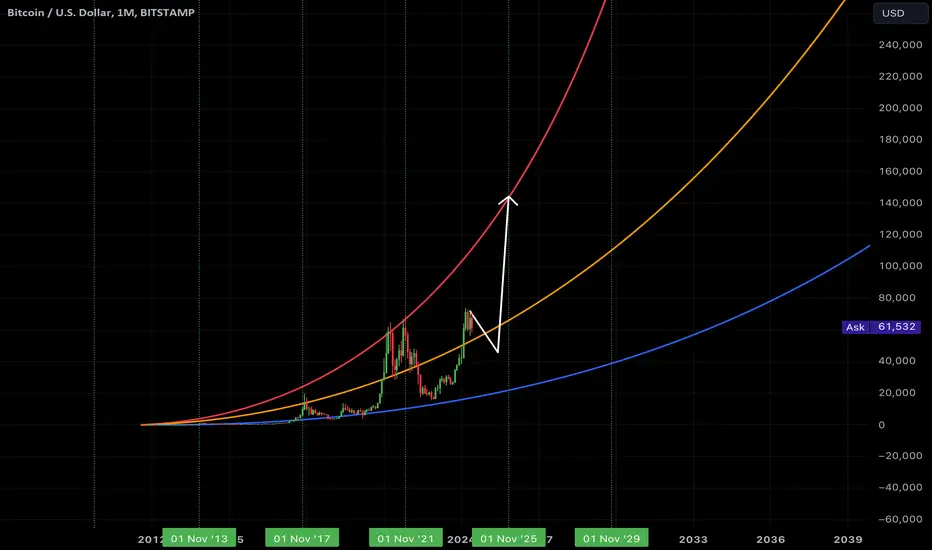
Magnetic Fields (Part 2)At the architecture faculty, I was taught that if it looks ugly in a project, then it won’t work. So this is another clear example of how events can unfold in the future. Given the exponential trend, we can assume that without the current stop Bitcoin price would have already reached $150k. But since this hasn't happened yet, the start of the swift rise period is clearly moving to the second half of 2025. Looking at this optimistic scenario, we can see that the resistance and support exponents each have their own magnetism and the price always made sharp falls after reaching the highs and a smooth rise untill excitement begins. So this time, it is quite likely, and ideally necessary, for the price to fall below the (orange) median expected in this case. I understand that the trends of the desired and the actual may differ and therefore I try to be objective. However, one way or another, the clarity of the picture speaks for itself.
A related idea (part 1) has a less optimistic outlook.
$BTC Daily UpdateCRYPTOCAP:BTC #BTC Testing $60,629 support, bearish engulfing forming on current 4H, RSI on 4H weakening and not looking good on 1D, $58,882 key support here which remains at risk, next key support at $56,557. $61,953 current resistance. Watch given S/R
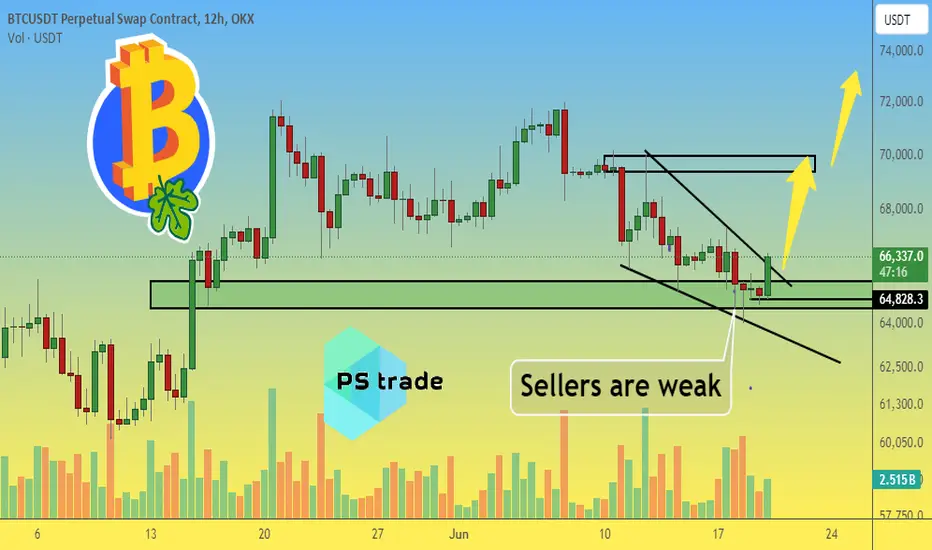
BITCOIN will deceive sellers and rise to $73,000!Yesterday's inactivity of sellers in the $64500 range gave a chance for a local wave of growth for bitcoin and the entire cryptocurrency market.
⚡️ In our previous idea , we wrote about the failure rate of the $64500 range:
💥 On the 12-hour timeframe, sellers failed to break through the 64500 range for 5 candles. And growth after such a failure should be aggressive.
On the 4hr timeframe, yesterday's weakness of the sellers was well worked out:
The BTC price failed to gain a foothold below the 64800 mark , and the local growth of bitcoin continued.
⚡️ The USDT dominance indicator broke the trend line down:
If the USDT dominance does not rise above 4.9% today, we expect a drop to 4.6%. This is the most modest target at the moment.
The BTC dominance chart has yet to break through the 55% mark. There is a feeling that the BTC dominance nightmare is not over, despite the clear signals of a drop on the daily timeframe:
💎 Therefore, today we expect such feats from customers:
✅Not to lose control of 65100
✅To develop the trend line from June 7 upwards and test the 67300 mark
For now, the main scenario is growth to 70000 and the recovery of altcoins.
💎If you are interested in the forecast of other cryptocurrencies , write their names in the comments!
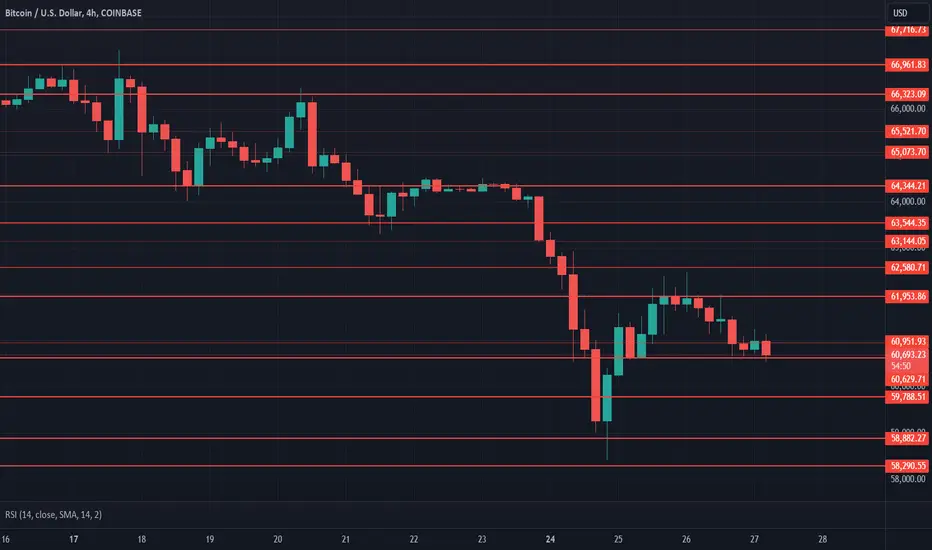
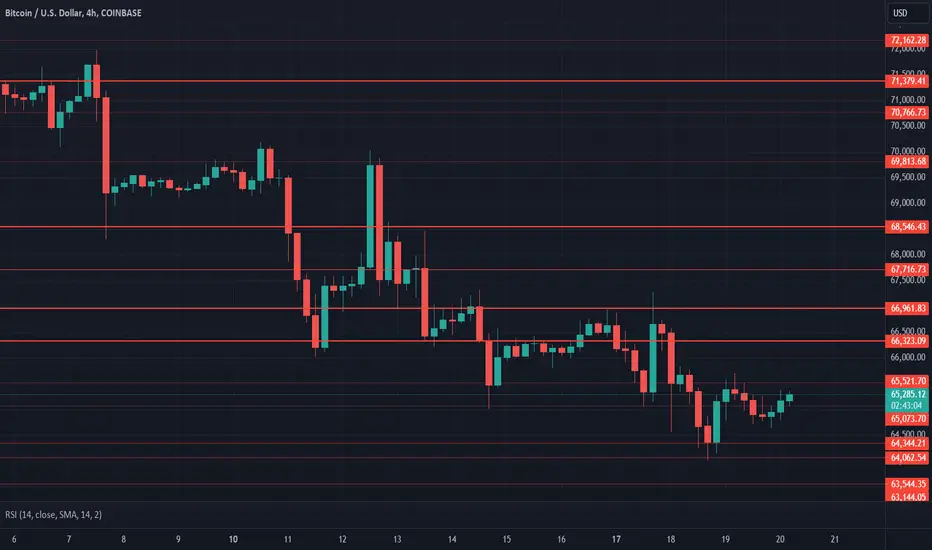
$BTC Daily UpdateCRYPTOCAP:BTC #BTC $64,344 given key support came in effect as expected 😎! Currently testing $65,521 support, RSI on 4H looks fine while improving on 1D, still look unsteady here. it could test for $66,323 by weekend if continues to improve on 1D. $64,344-$64,062 remains current support area. $63,544 next support from here. watch given S/R
$BTC Daily UpdateCRYPTOCAP:BTC #BTC Broke below $66,323 key support as expected, currently testing $65,073-$65,521 area. RSi on 1D dropping, $64,344 next key support from here to watch as of now, Previous daily close showed some strength, $68,546 support much needed. Watch Given S/R

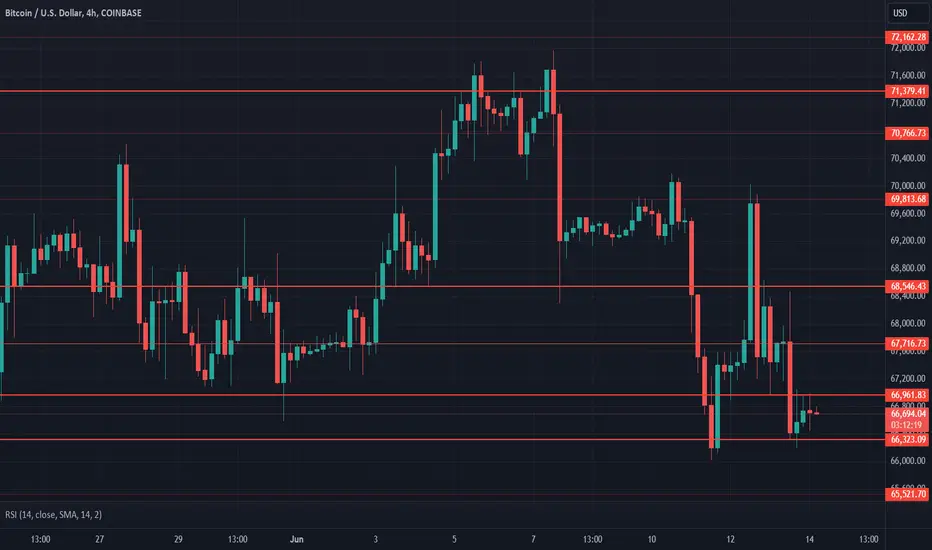
$BTC Daily UpdateCRYPTOCAP:BTC back on $66,323 support currently testing it, Previous 1D closed with bearish engulfing if followed thru it might break $66,323 support, next key support $64,344, next support from here $65,521. RSI on 1D looks weak. Watch the support areas, must regain $68,546 support to retest $69,813. Watch given S/R
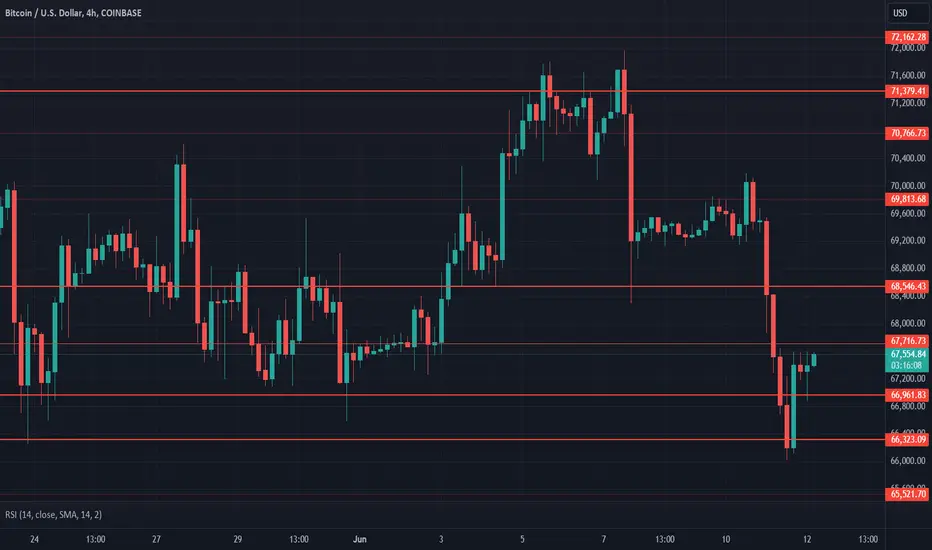
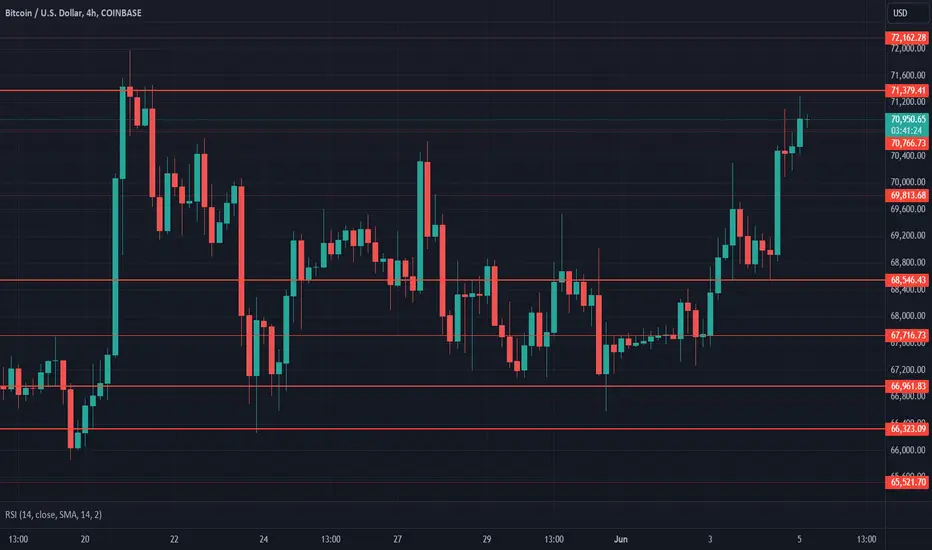
$BTC Daily UpdateCRYPTOCAP:BTC #BTC broke below $68,546 support down to $66,323 support which tested and held on last dip, $67,716 being tested as of now, RSI on 4H and 1D getting better, $68,546 support to be regained to reattempt at $71,379-$72,162 resistance area. Watch given s/r
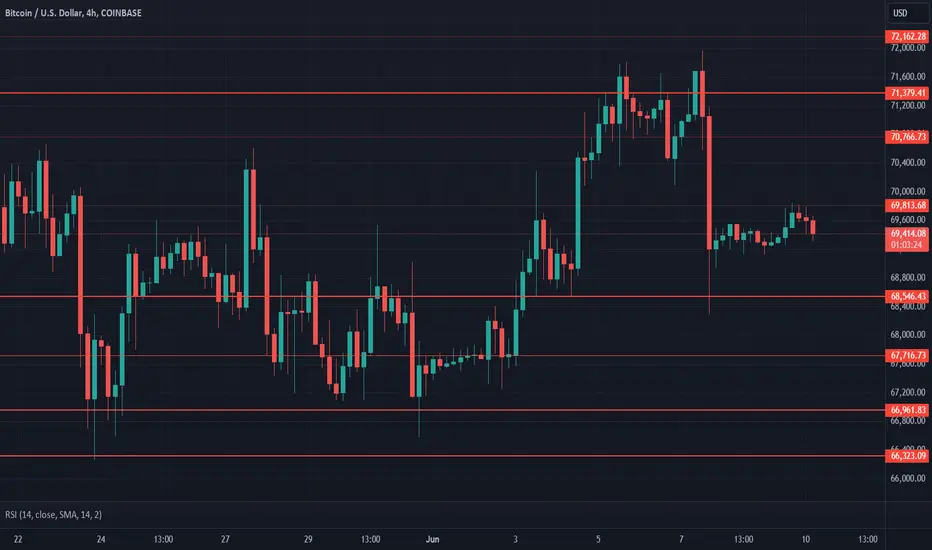
$BTC Daily UpdateCRYPTOCAP:BTC #BTC $69,813 resisting, very weak volume on 1D over the weekend, RSI looking weak on 1D and 4H, $68,546 current support, $72,162 resisted on previous climb, Continue Watching given S/R
$BTC Daily UpdateCRYPTOCAP:BTC #BTC WOW!!! Look at that, already testing given resistance range $70,766-$71,379. Gaining support here would bring $73,523 test on the table, RSI on 4H is hyped up but 1D looks good, Time to see if it can gain a support of $71,379. Watch given S/R
Bitcoin WayKeep that in mind :
- More we go Down.
- More the next bullrun will go High.
- Fibonacci Law Rule.
- Happy thanksgiving to everyone! 🐔
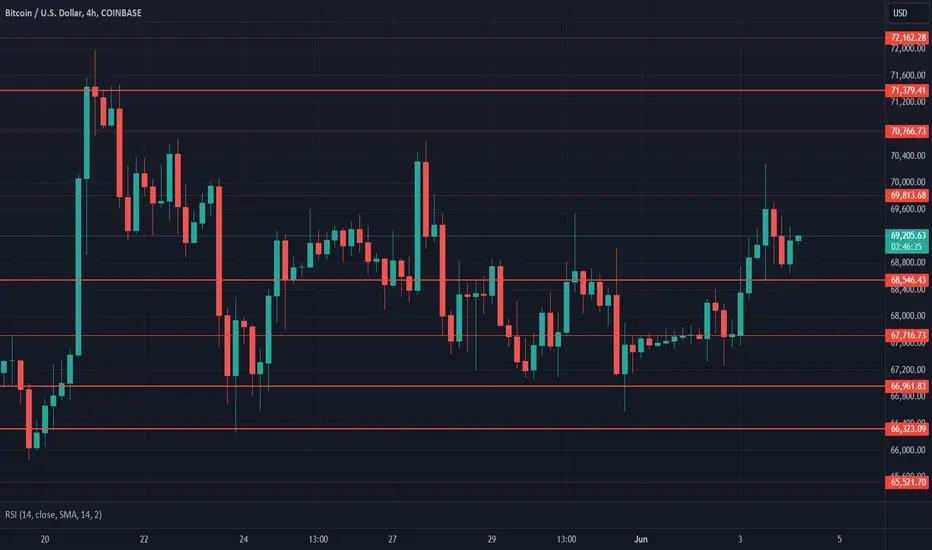
$BTC Daily UpdateCRYPTOCAP:BTC #BTC Back on $68,546 support after testing $66,961 support, Previous 1D closed weak, $69,813 resisting currently, RSI on 1D and 4H looking good, needs to break above $70,766-$71,379 resistance area, continue watching S/R
BTC – Weekly Perspective – 02/06 to 09/06On the first day of June, the SETUP used indicates a corrective bearish pivot on the long-term chart. Will we have a correction later on, so that the cryptocurrency finally breaks free and reaches new peaks?
When we analyze the impressive rise that the cryptocurrency has had in the last 16 months and trace just one Fibonacci retracement, we will see that the 50% region is around 44.6K.
In my opinion, a correction as soon as possible is completely healthy, as nothing goes up forever in a straight line without there being a correction at some point in the future.
Coming to the daily chart, we have prices on the verge of forming a corrective pivot, with enough strength to reach 44.5K, if prices do not remain above 69.6K.
The most interesting thing is to see that we have a confluence between the values provided by the Fibonacci retracement of the rise, in which 50% of this correction is at 44.6K, with the corrective pivot found on the daily chart, whose final destination has the potential to reach 44 .5K, as shown in the images above.
Can I trust what my eyes have just seen? To know for sure, unfortunately, I will have to live day by day.
Do your analysis and good business.
Be aware, if you buy, use stop loss.
See other graphical analyzes below.