BITCOIN UPDATE: A DIVE OR A JUMP???Welcome members to this update on BTC. I am using 3 hours TF for the analysis.
If you are viewing my post for the first time then do not forget to like and follow. I share updates on the crypto market including margin trading, futures, spot, and scalping. All ideas are my biased opinion and I invest in my own risk. I don't force anyone to buy or sell, I simply share my ideas absolutely for free and it is your sole decision whether to trade on it or use it to understand the market.
Coming back to the chart.
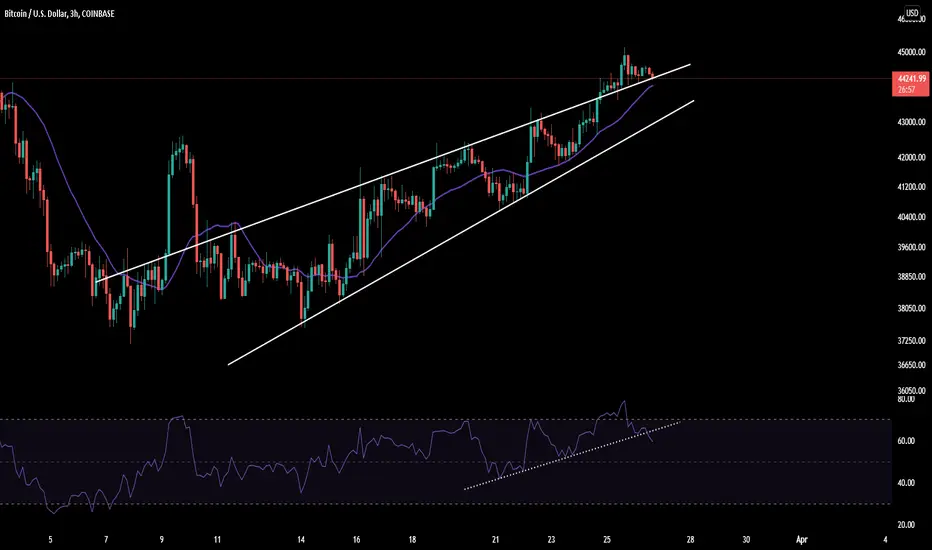
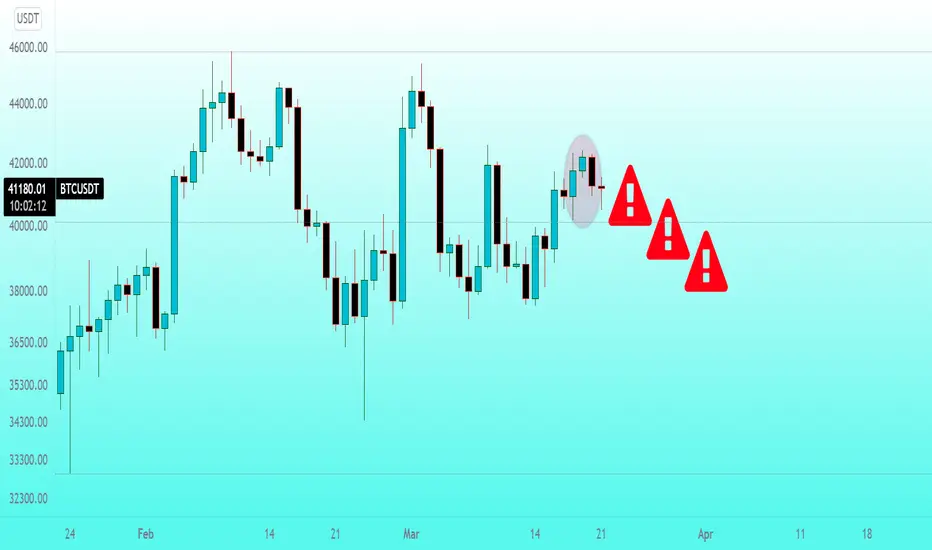
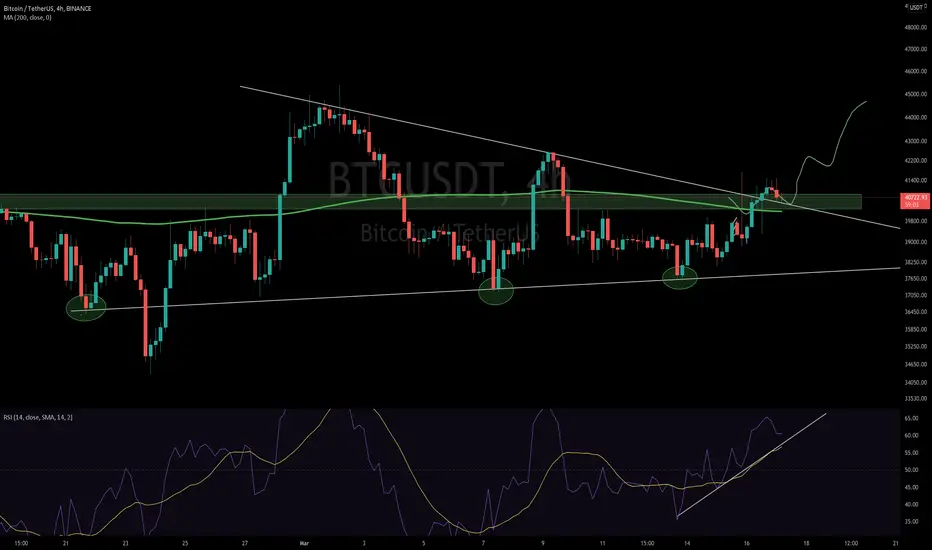
BTC has broken out of the rising wedge pattern but things still look skeptical here. We can possibly see a higher rally coming in and BTC could bounce back from a $44k support level. But let us not forget the RSI. BTC is rallying higher but the RSI is breaking down below the lower trendline. It is losing the volume here and whenever this has happened, BTC has fallen down badly.
Here is the possibility according to the support and resistance level.
1. $44k support level: If BTC manages to hold this level then we will soon see a bounce towards $46k.
2. $43k support level: If BTC breaks down from the current level then we can expect BTC to create a support at $43k and then a bounce.
This will be an important level to keep an on and for now $44k level is a crucial support for BTC.
Let me know what you think about BTC. Do like and follow for more updates.
I'll see you at the next one.
Thank you.
Btcforecast
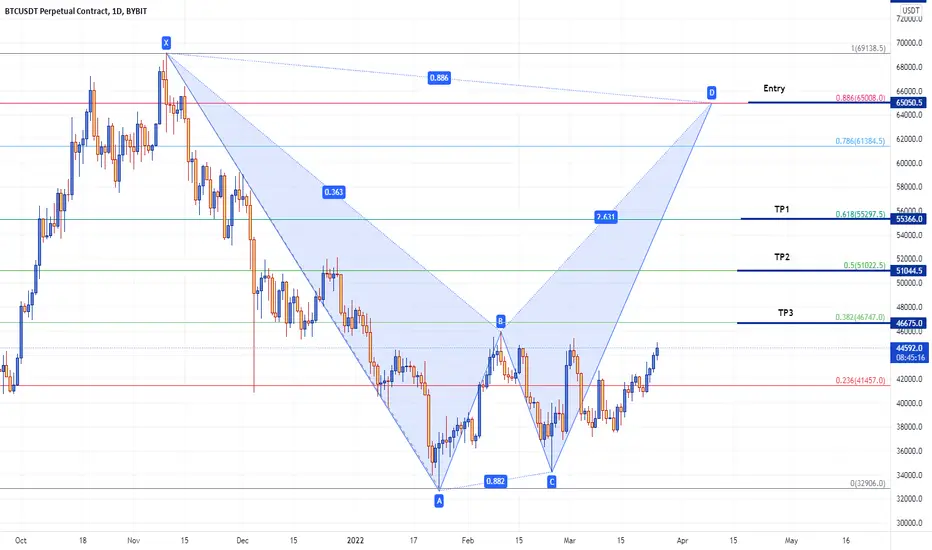
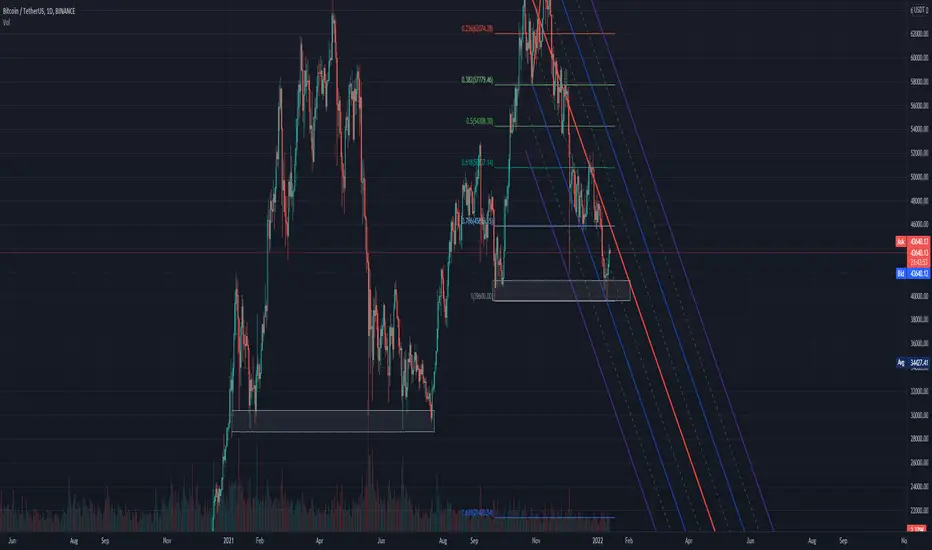
BTC Bearish BAT harmoninc target $65KWe see a bearish bat forming on a daily chart and we can take this as future price projection. I suspect that this pattern will surely complete once 0.382 level is reclaimed.
To add confluence to this analysis, Weekly oscillators are pretty much flipping bullish.
Another confluence is that on 12H chart we see a possible golden cross happening in coming days (Golden cross occurs when 50 days moving average crosses above 200 days moving average) Last time this occurred on 12th august 2021 and price made ATH $69k.
I am biased bullish, Lately I was biased bearish since before November. Capitulation doesn't seem to be happening and it seems that cycle is changing i.e., No more 4 year cycles.
Bearish Scenario : If price goes below $38K level ONLY then it will be total bloodshed.
Bitcoin in Next 10 to 14 Months-I am still very negative about the market.
-Bitcoin is still in a bear market and we will continue to drop.
-Our first target was done at 34, next will be 28 and then 23.
-Invalidation is also there.
-Not financial advice.
#BTC/USDT 1DAY UPDATE BY CRYPTOSANDERS Welcome to this quick BTC/USDT analysis.
Hello members, welcome to the BTC 1day update by CRYPTOSANDERS.
If you have gone through with our yesterday's BTC chart then you will remember, in that chart we mentioned that BTC is looking bullish in long term.
In the current scenario, btc bounced from the upper trend line or the green zone.
Till now btc moved up very well and btc .d also showing confirmation that we can see this uptrend for more upcoming days.
and.
RSI also shows a bullish divergence .
Sorry for my English it is not my native language.
This is not a piece of financial advice.
Thank you.
BTC Descending TriangleWe are seeing a descending triangle (formed by a pitchfork, which has proved to be valid) into an area of support, could be a bullish reversal. I also see that the last time bitcoin hit an all time high it fell back to a major pullback, where we are right now.
DYOR before investing or trading
If you liked this idea please give it a like!
BTC Daily Update for Potential Short! Taking a look at BTCUSD on the daily last time we spoke on this we were trading around the smaller yellow box which is acting like a sort of magnet, price action seems to be always coming back to these levels then struggling to breakout, Since then we have had a strong breakout and pushing up towards our potential short position, we are also trading within a larger sized sideways zone shown by the dashed lines. Now i have changed up the short position a little bit ive adjusted our entry point too the recent high wick above the dashed line, think that a sweep of both of the previous highs is likely, take out some positions and continue for another potential drop back into our zone. now there is another scenario where we don't make it upto the top zone and that is if we create a lower high then chances are likely we will start falling a lot sooner! Now the RSI is bac above the midline which is good for the longer term and for this short i am looking for a push upto the overbought zone which we haven't visited since mid october, due too that we are likely going to face significant bearish pressure upon reaching that point. Now with the MACD we were coming down where is appeared our bullish cycle was coming too an end, but we are seeing a significant tick up for todays bar, seeing an increase shows a rise in bullish momentum that could lead too one more pump up before coming back down! Not financial advice just my opinion!

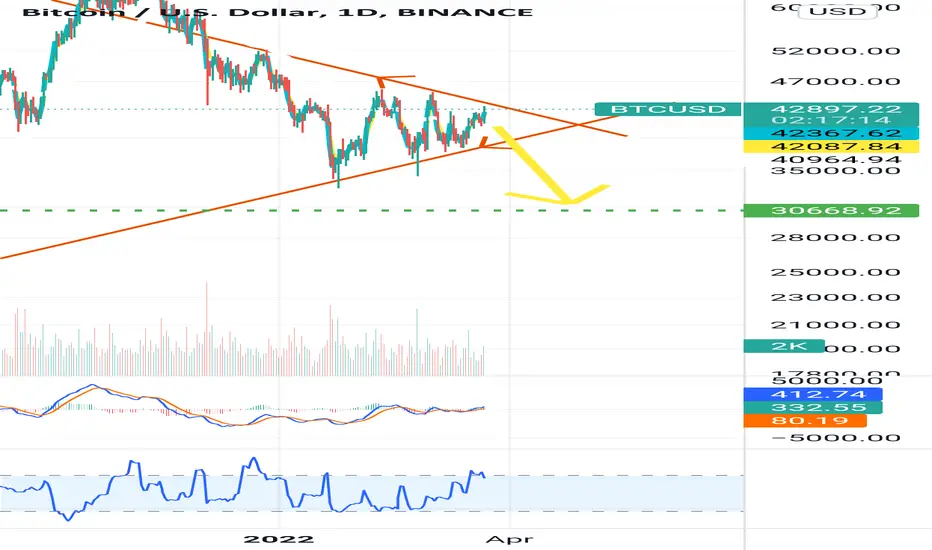
BTCUSD Hi,
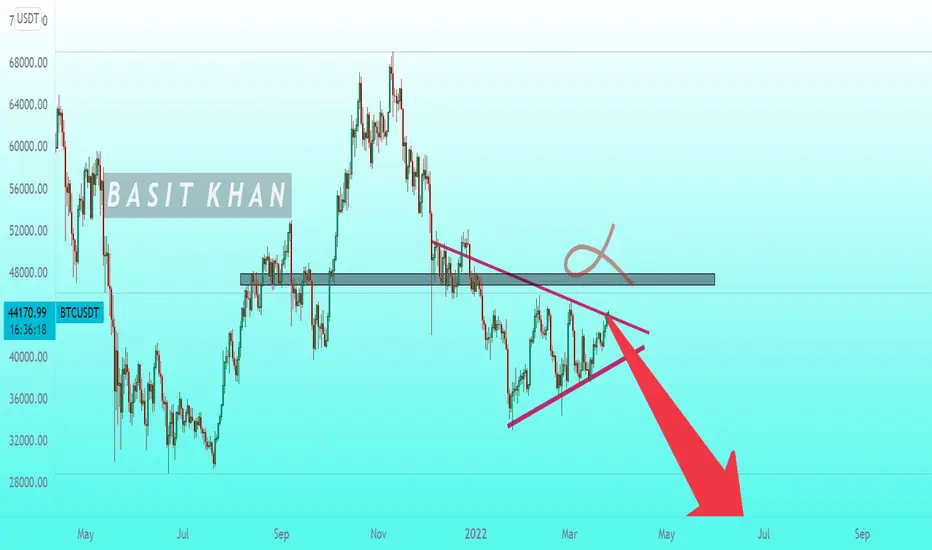
As can be seen in the chart a bearish triangle is forming and $BTC Is due for another major correction IMO.
The world now is full of uncertainty and in this situation people's risk tendencies decreases and put q selling pressure in the market and historically speaking $BTC didn't go through major correction this time and i Think it's healthy for $BTC price to go through correction(under $34k)phase in order to flipping aways sellers from new spirit buyers.
Note this is the work of private trader and is not a financial adivise.
BTC/USDT 4HOUR UPDATE BY CRYPTOSANDERSWelcome to this quick BTC /USDT analysis.
Hello members, welcome to BTC 4 hour update by CRYPTOSANDERS.
If you have gone through with our yesterday's BTC chart then you will remember, in that chart we mentioned that BTC is looking bullish in long term.
In the current scenario, btc bounced from the upper trend line or the green zone.
Till now btc moved up very well and btc.d also showing confirmation that we can see this uptrend for more upcoming days.
Sorry for my English it is not my native language.
This is not a piece of financial advice.
Thank you.
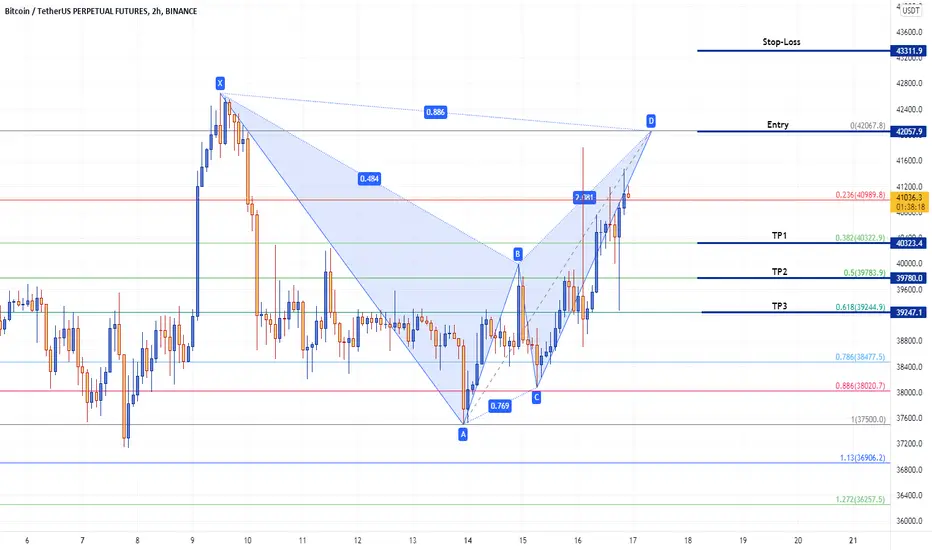
BTC bearish bat target $42,057Price action is attempting to form a bearish 🦇 on 2 hourly. Completion of this harmonic will be at $42,057, Invalidation of this will be $43,311. FOMC news had a very temporary effect on price action and afterwards we were bombarded with good news for future of crypto which pumped the market back up almost in an hr. Now we are back at R/S game. Bearish trend is still intact until we take over $46k on weekly.
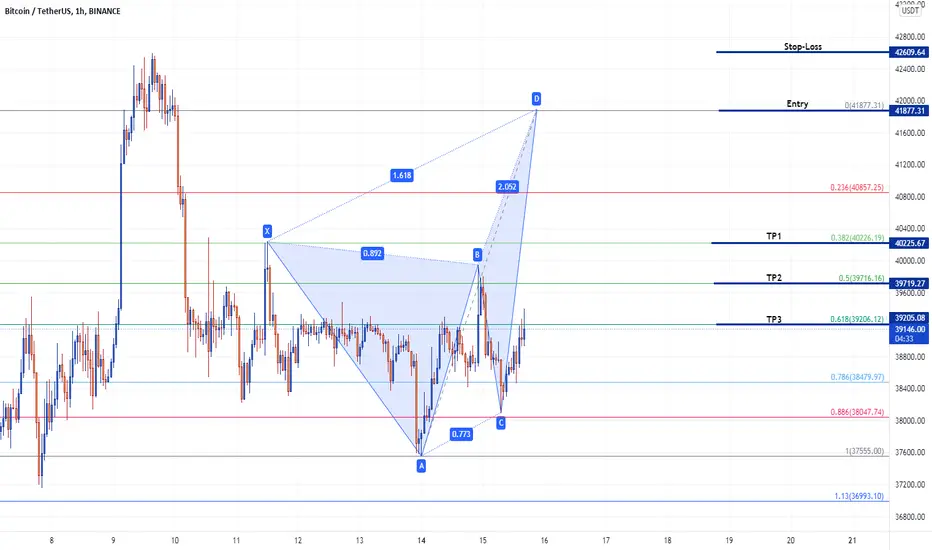
BTC Deep Crab Target $41,877BTC is in process of developing bearish deep 🦀 harmonic, Completion of this will be at $41,877. We have bullish divergence of RSI and VWMACD on daily chart which if plays out then chances of hitting $41k are quite high. Now fundamentally, We have FOMC meeting tomorrow regarding interest rate hikes so we may see volatility today/tomorrow.
Bitcoin Trend line is broken. Is it a start of Up trend? Bitcoin Trend line is broken. Is it a start of Up trend?
Did u open a trade?

BTC- My Analysis.HAHA,, From the last 5 months, our analysis went really well. This time still I am negative about the market overall.
This is not a piece of financial advice.
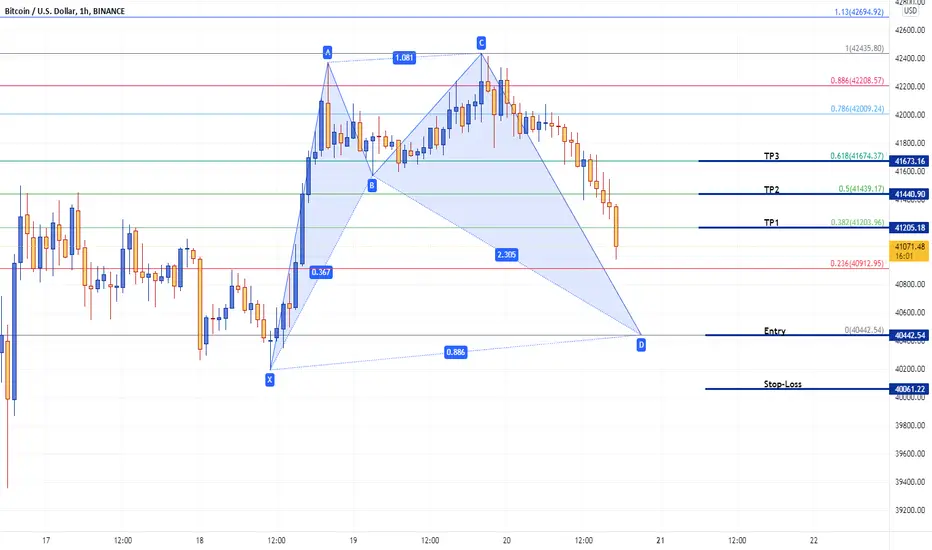
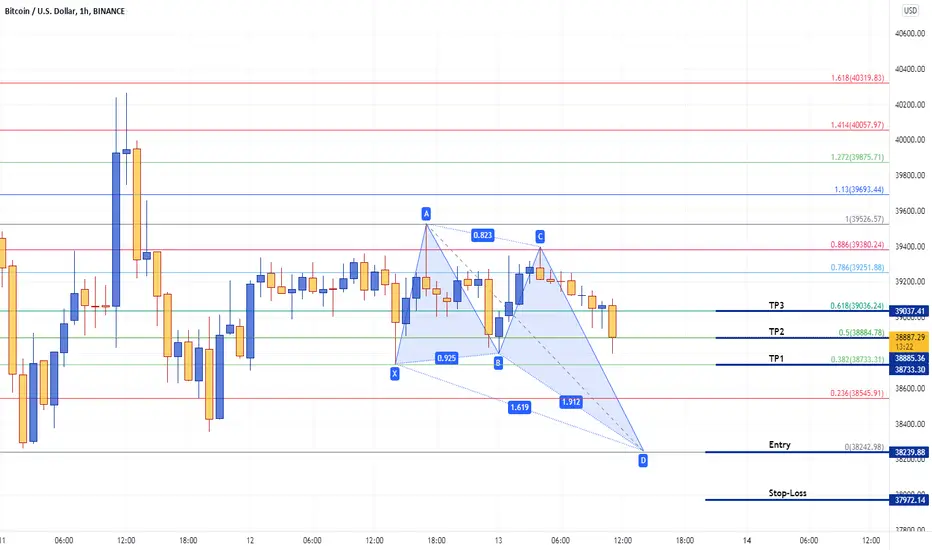
BTC bullish shark completion at $40,442Price action on 1H timeframe is in development of a bullish shark harmonic, Completion target is $40,442, Invalidation target $40061. If price does not bounce from from $40,442 then possibly we will see a retest of $39.5k level. We will see a choppy next week if price does not close on weekly candle $41,600 to $42,300 levels.
BTC/USDT 4HOUR UPDATE BY CRYPTOSANDERSWelcome to this quick BTC /USDT analysis.
Hello members, welcome to our BTC/USDT quick update
As we mentioned in our previous chart that BTC was trading inside the triangle pattern and if breaks the green MA then we will be able to see the triangle break out also.
Till now BTC moved in the right direction.
According to the current scenario, btc is on the way to retesting the upper trend line which will be the confirmation for an uptrend move.
In another frame, if BTC brakes the upper trend line and moves back into the triangle pattern then this chart will be invalidated.
Sorry for my English it is not my native language.
Thank you
Happy trading.
Bitcoin is in a middle of the rangeBitcoin is in a middle of the range
Best time to wait for clear pattern

Bitcoin - Price is in a RANGE. DO NEXT!Bitcoin - Price is in a RANGE. DO NEXT!
Price did double trap

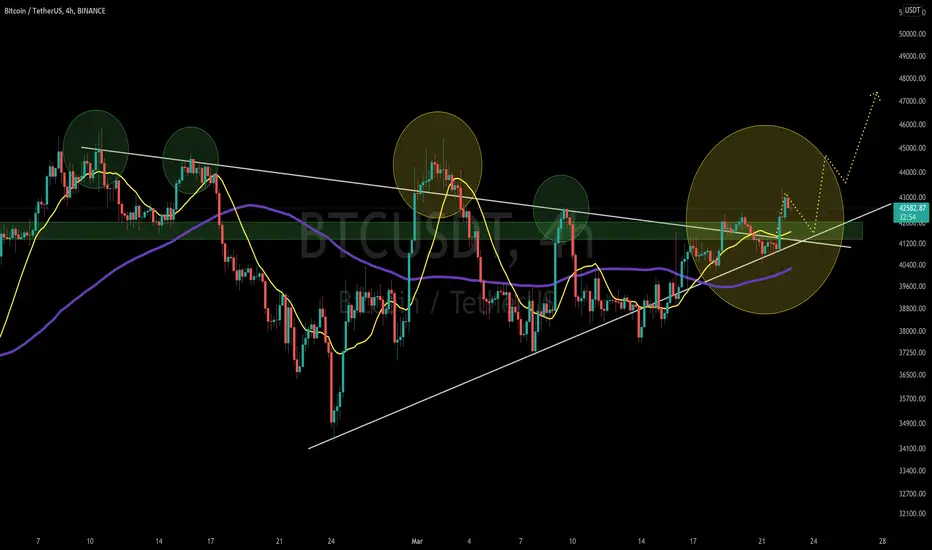
#BTC/USDT 4HOUR UPDATE BY CRYPTOSANDERSWelcome to this quick BTC /USDT analysis.
I have tried my best to bring the best possible outcome in this chart.
Hello, members
Welcome to our BTC /USDT quick hourly update.
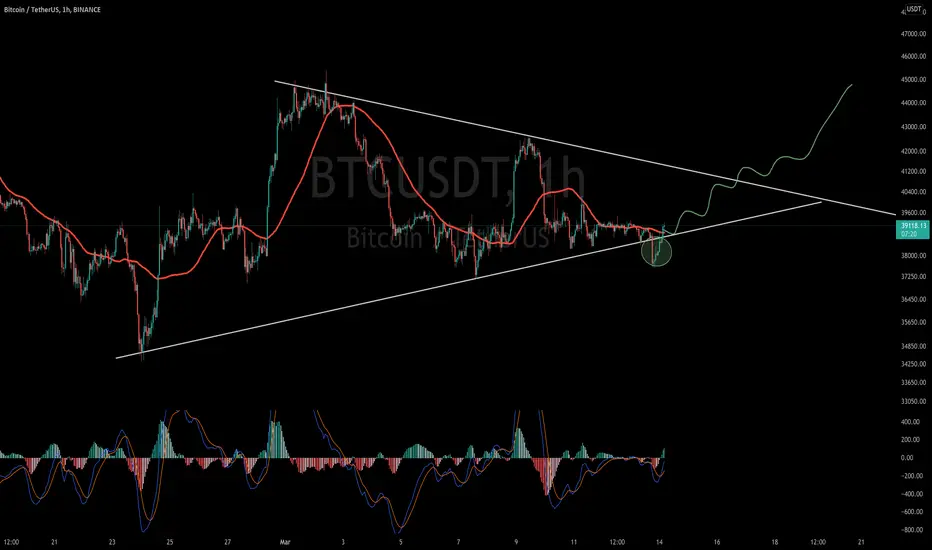
As we can see in this chart BTC is currently trading inside the symmetrical triangle pattern which is a bullish pattern.
In the current scenario, BTC strongly holds the yellow 21MA (moving average) which is near the $38770 mark.
Whenever BTC holds the yellow 21 MA BTC it becomes bullish.
If BTC breaks the down trend line then this chart will be invalidated.
This is not a piece of financial advice.
Sorry for my English it is not my native language.
Do hit the like button if you like it and share your charts in the comments section.
thank you.

BTC Daily TA, Sideways movement before taking off!!??Hope everyone enjoyed! Leave a like, follow and let me know your opinions down below!

BTC/USDT 1HOUR UPDATE BY CRYPTOSANDERSWelcome to this quick BTC/USDT analysis.
I have tried my best to bring the best possible outcome in this chart.
Hello, members
Welcome to our BTC/USDT quick hourly update.
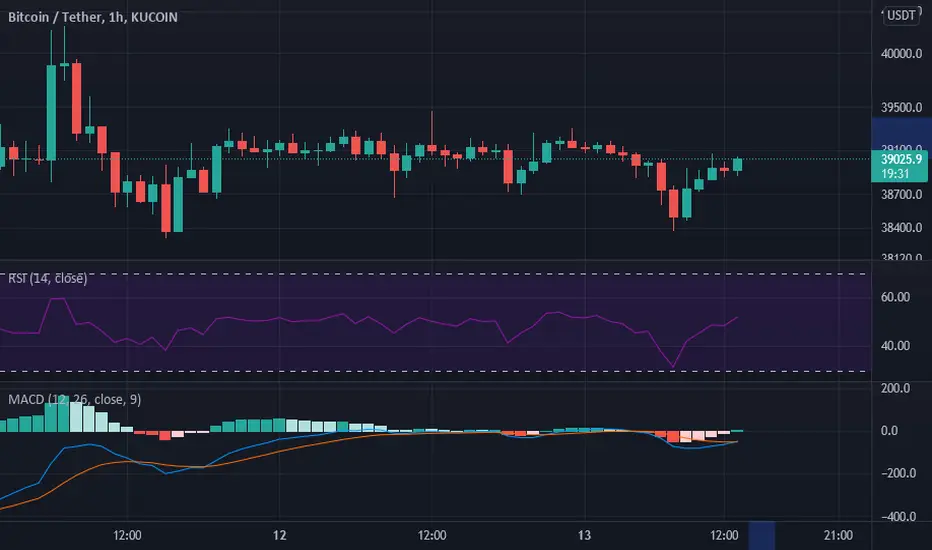
As we can see in this chart BTC is currently trading inside the symmetrical triangle pattern which is a bullish pattern.
In the current scenario, BTC strongly holds the red MA (moving average) which is near the $39200 mark.
Whenever BTC holds the red MA BTC it becomes bullish.
MACD (moving average convergence divergence) also shows bullish crossover.
So we can say that we can see some green candles in the next few hours.
If BTC breaks the red ma then this chart will be invalidated.
This is not a piece of financial advice.
Sorry for my English it is not my native language.
Do hit the like button if you like it and share your charts in the comments section.
thank you.
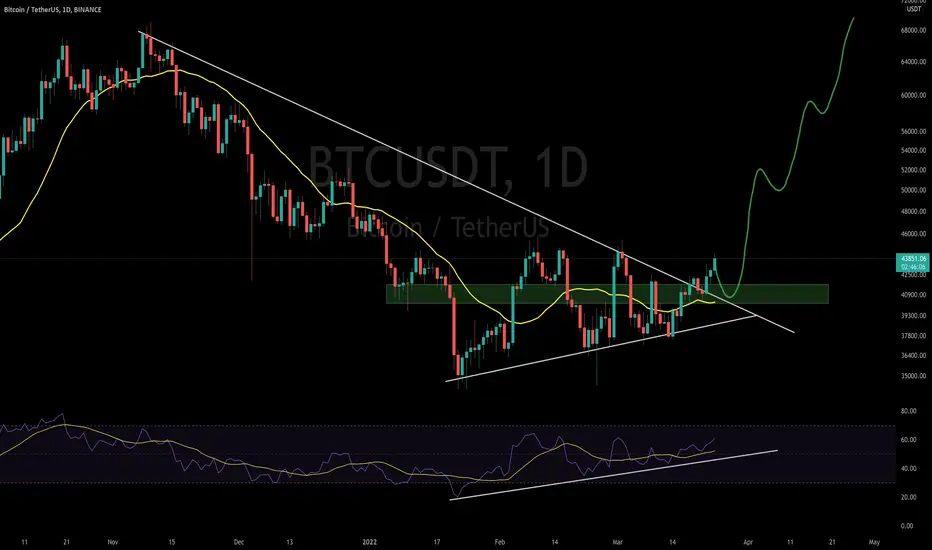
#BTC/USDT WEEKLY UPDATE BY CRYPTOSANDERSWelcome to this quick BTC/USDT WEEKLY analysis in the chart
I have tried my best to bring the best possible outcome in this chart.
Hello folks,
Welcome to our Btc /Usdt weekly update, as we can see a rising wedge pattern create that from 15th March 2021 to 10th May 2021 btc was in an uptrend and from 10th May 2021 to 12th July 2021 was in downtrend.
After that Btc bounced on 19th July and moved up till 8th November 2021.
After that, we saw some correction in the market and a downtrend till 17th January 2022. After the 17th Jan market is still in a sideways move.
According to the current scenario, I think Btc will move in a sideways trend till 21st March 2022.
After that, we can see bullish movement which can continue till 11th July 2022 according to this chart and also can claim the new ATH.
As we all know that in 2024 btc halving is going to happen. so we can assume that the market will bounce on the 3rd week of March and we can see a good rally.
This is not a piece of financial advice.
Sorry for my English it is not my native language.
Do hit the like button if you like it and share your charts in the comments section.
thank you.

BTC is making bullish DEEP CRAB!!!BTC is in the process of developing bullish deep crab harmonic on hourly. This is somehow in confluence to bullish butterfly harmonic from yesterday which completes at $35,707. So we can possibly see some bearish price action before a leg up. We have weekly closure in 12hours from now so further development in price action will be shared upon closing of candle.
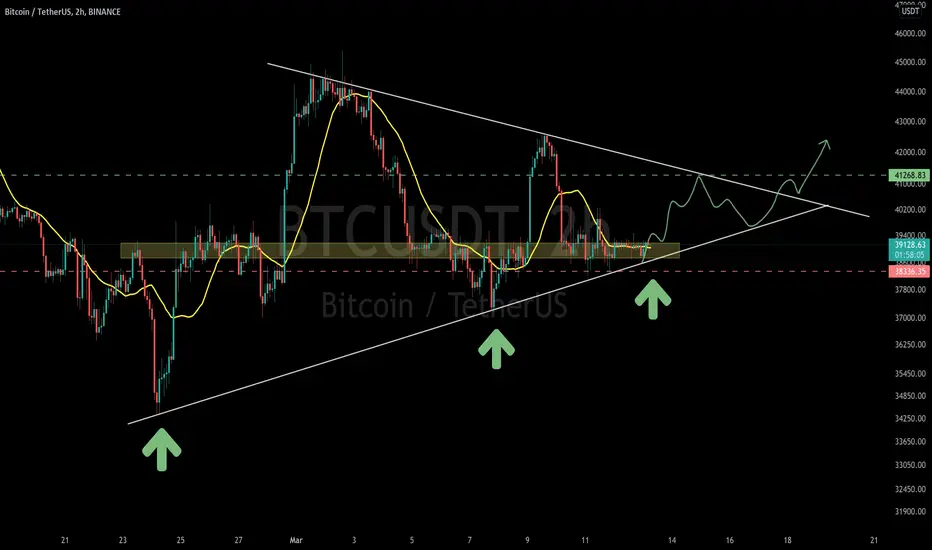
BTC/USDT 2HOUR UPDATE BY CRYPTOSANDERSWelcome to this quick BTC/USDT analysis.
I have tried my best to bring the best possible outcome in this chart.
Hello mate you guys know that btc got pumped about 30% when 24fab bounced as trade line and on 7th mar when sam trade line bounced got pumped 15% so we assume that btc is still on 13march we can be pumped around 7% to 8% .
Hello Friend
Two we can make BTC long and trade by putting stoploss, must follow and like for updates.
Thank you.
For more such latest updates follow our channel and comment below.
This is not a piece of financial advice.
Sorry for my English it is not my native language.
Do hit the like button if you like it and share your charts in the comments section.
thank you.