#BTC really bullish today in 2hour update by cryptosandersWelcome to this quick BTC /USDT analysis in the chart
I have tried my best to bring the best possible outcome in this chart.
Hello folks,
Welcome to our Btc update
But looking at this chart I think btc may once again touch the $38.7k level ( support level ) and if there is a bounce off this level then we can open some long positions.
In other ways, if BTC breaks
$38.7k level then we can see a dump
$37.5k towards
BTC could pump around 21% if BTC bounces off the $37.5k level
For more such latest updates follow our channel and comment below.
Thank you.
This is not a piece of financial advice.
Sorry for my English it is not my native language.
Do hit the like button if you like it and share your charts in the comments section.
thank you.
Btcforecast

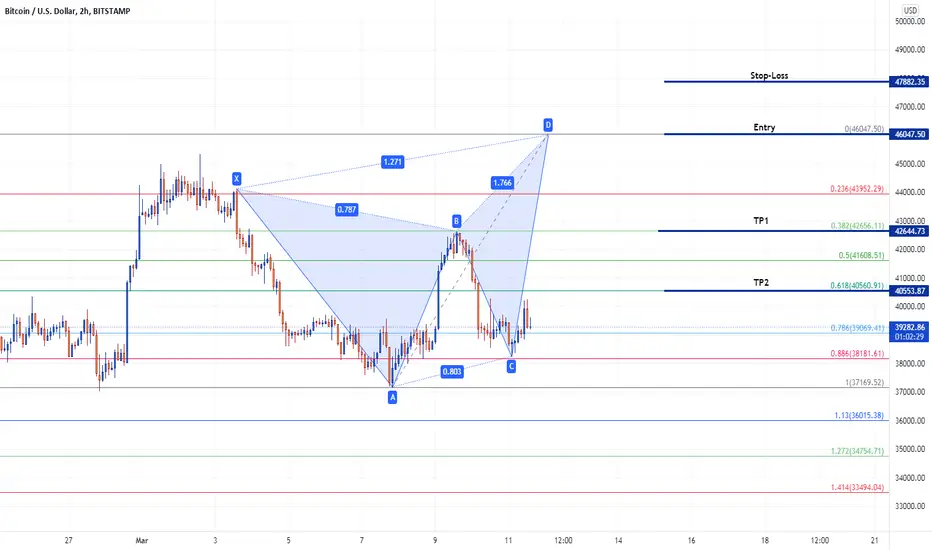
BTC bearish butterfly touchdown $46KBTC is in the process of developing a bearish butterfly pattern on 2 hourly, If you look at the pattern entry point, That level is a strong supply zone and we will most likely dump down from that level towards $40k. I do have a speculative theory though I really don't believe on speculations AT ALL but my speculative theory has some reasoning to it. From November until now the lowest price BTC touched was $33k afterwards next support was made at $36.8k. Moreover we made another support at $37.5k and now we are in the process of making $39k a strong level and next in line would be $40.5k which is TP2 of this harmonic. These supports are already there but my point is that every time a lowest point was touched, It would not repeat again. We saw $34.4k wick on 24th feb but that end up closing at $38.4k. This is just a mere speculative theory so don't take that as a universal truth :)
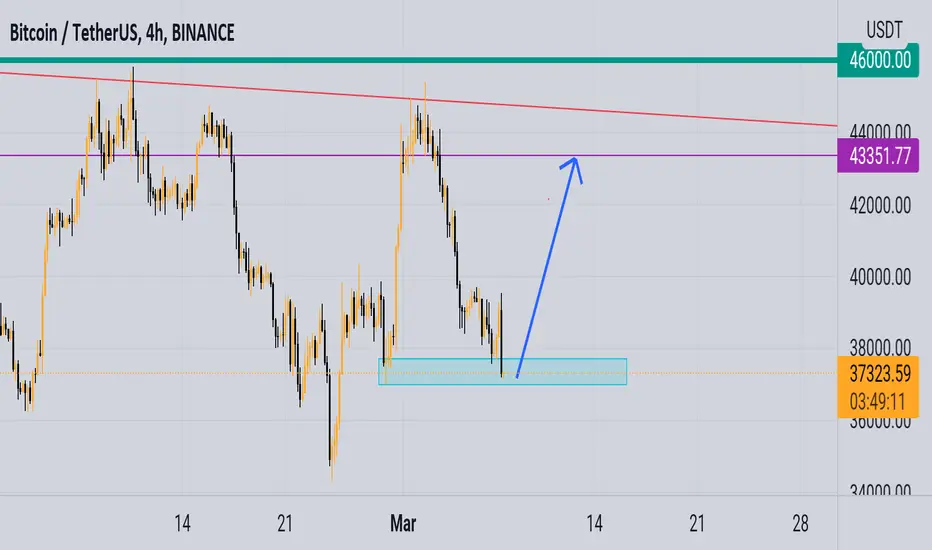
BTC/USDT 4HOUR UPDATE BY CRYPTOSANDERSWelcome to this quick BTC /USDT 1day analysis in the chart
I have tried my best to bring the best possible outcome in this chart.
Hello folks,
Welcome to our Btc update
But looking at this chart I think btc may once again touch the $37.9k level ( support level ) and if there is a bounce off this level then we can open some long positions.
In other ways, if BTC breaks
$37.9k level then we can see a dump
$35.5k towards
BTC could pump around 31% if BTC bounces off the $35.5k level.
For more such latest updates follow our channel and comment below.
Thank you.
This is not a piece of financial advice.
Sorry for my English it is not my native language.
Do hit the like button if you like it and share your charts in the comments section.
thank you.

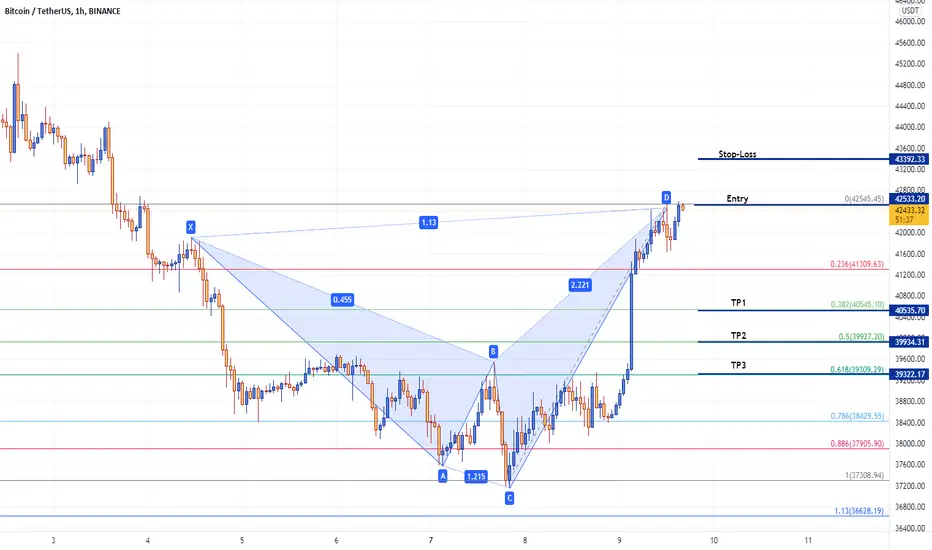
BTC making Bearish Shark on hourly!!!BTC / USDT (Interval 1H)
We have a bearish shark pattern on hourly chart, Everything is self-explanatory, Invalidation of this harmonic will be $43,392. We are still biased bearish till $45k is not fully reclaimed on weekly chart. BTC will continue to range between $37k to $44k till we have a breakdown or breakout on either side. Right now on higher time frame we are getting buy signals but on lower time frame we are getting mixed signals. Again $45k level needs to break out or else we will continue to range for some time.
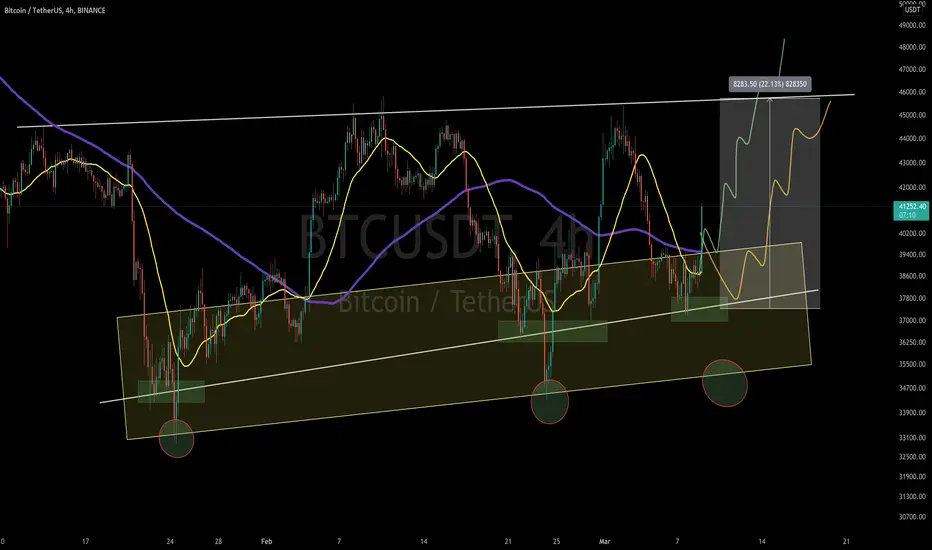
Bitcoin trend line break up patternBitcoin trend line break up pattern
Open a trade after squeezing up

Bitcoin - break up pattern is our last chance. Bitcoin - break up pattern is our last chance for rise
If price faile to build it - we turn into bearish.

#BTCUSDT looks prime for 130% Rally in the BTC/USDT 1day chart!Welcome to this quick BTC/USDT 1day analysis in the chart.
I have tried my best to bring the best possible outcome in this chart.
Reason of trade:-#BTC/USDT looks triangle pattern create and 130% Rally confirms and long term hold!
Entry:-$36.8K
$40.2K
Target:-100% TO 130%
Stoploss:-$32.9K
With leverage 3x to 5x
And long term hold and good profit 😉🙂😊✈️✈️
Q:-What do you think about this?
Do you think we will see a new ATH of BTC in the next quarter?
Share your views in the comment section.
Remember:-This is not a piece of financial advice. All investment made by me is under my own risk and I am held responsible for my own profit and losses. So, do your own research before investing in this trade.
Happy trading.
Sorry for my English it is not my native language.
Do hit the like button if you like it and share your charts in the comments section.
Thank you...

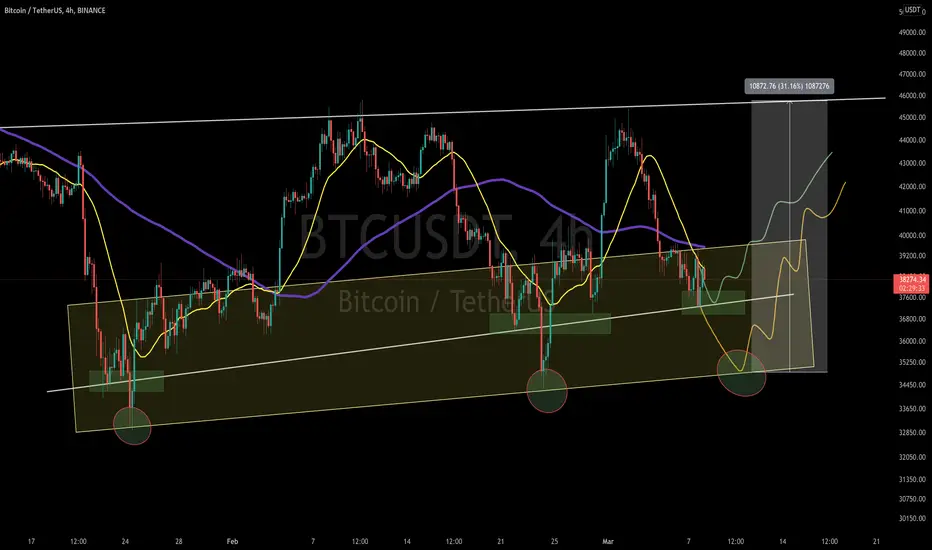
BTC/USDT 4HOUR UPDATE BY CRYPTOSANDERSWelcome to this quick BTC /USDT 1day analysis in the chart
I have tried my best to bring the best possible outcome in this chart.
Hello folks,
Welcome to our Btc update
Yesterday our few trade call got all targets done and it feels good to earn some good to others.
But looking at this chart I think btc may once again touch the $39.5k level (support level) and if there is a bounce off this level then we can open some long positions.
In other ways, if BTC breaks
$39.5k level then we can see a dump
$37.3k. towards
BTC could pump around 22% if BTC bounces off the $37.3k level.
For more such latest updates follow our channel and comment below.
Thank you.
This is not a piece of financial advice.
Sorry for my English it is not my native language.
Do hit the like button if you like it and share your charts in the comments section.
thank you.
BTC TA + 3 Potential Trading plays!!NOT FINANCIAL ADVICE!!!! My apologies for the scratching noises not too sure what that was, my mic wasn't working so audio was recorded through laptop! Anyways hope everyone enjoyed, leave any questions, comments, opinions below! Like and Follow!

Bitcoin, Price didn't confirm global Uptrend yet. Our next move Bitcoin, Price didn't confirme global Uptrend yet. Our next move is
We wait for clear patterns

BTC/USDT 4HOUR UPDATE BY CRYPTOSANDERSWelcome to this quick BTC /USDT 1day analysis in the chart
I have tried my best to bring the best possible outcome in this chart.
Hello folks, welcome to our Btc update as we all saw tomorrow some manipulation in Btc. Due to this pump and dump our few calls got Stop loss hit.
But looking at this chart according to me btc one more time can touch the $37.4k level (support level) and if bounces from this level then we can open some long position.
In other ways, if btc breaks the $37.4k level then we can see a dump towards $35k
If btc bounces from the 35000 level then btc can pump almost 30%.
For this kind of latest update follow our channel and comment below.
Thank you.
This is not a piece of financial advice.
Sorry for my English it is not my native language.
Do hit the like button if you like it and share your charts in the comments section.
thank you.
Btc updateHead and shoulder failed and didn't happen. This area is the next best area for reverse. Remember there is a gap in 43k that has to be filled. Also the next target after that is 52k. For now.
btc predictionbtc needs to fill the gap at around 43k . it is probably going to shape a reversal head and shoulder. and candles are really bullish too. just giving you some insight

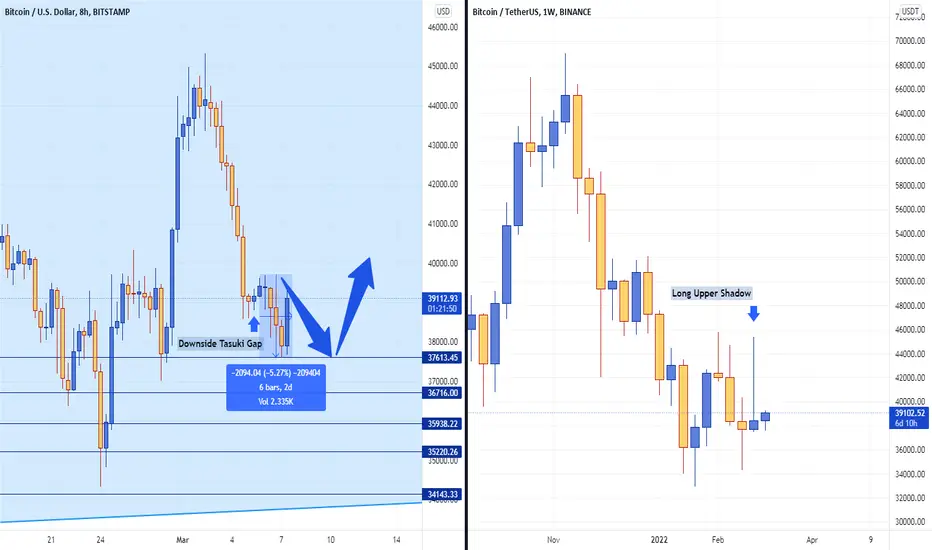
BTC / USD - Update - (Interval 8H/W)Bearish candlestick played out and price tested the support with a wick and bounced back. So far it is following our price projection but weekly closure was with long upper shadow candlestick pattern so we may possibly test $36.7k and $35.9k support in coming days, We are seeing a bounce as according to our projection because 4H chart oscillators are way over-sold afterwards we will dump back from $39.5k-$40k levels which are strong resistances at the moment.
Head & Shoulders Look on pic.
All info provided on my desk.
It is no advice just for your refernce !
I wish luck for everyone!
BTC/USD: Russia to Regulate Crypto, Dispelling Fears of Ban. It seems a bit unethical that BTC is falling during the Russia-Ukraine war. Cryptocurrencies history says it might be supported during crises like USD because there is a similar movement we found before like USD.
But this time, the BTC isn't getting benefits like USD. But very soon, we may see a big buy as Russia to Regulate Crypto, Dispelling Fears of Ban.
The government's plan to license exchanges and tax large transactions has the central bank's support, which previously wanted to outlaw mining and trading.
As SWIFT bans many Russian banks, there is a chance that Russia may rush to cryptocurrency, especially to the crypto king BTC and Chinese SIIPS.
Mexico already accepts BTC as payment, and El Salvador makes BTC their national currency. Many countries may jump to BTC to avoid economic sanctions seeing Russia.
Technically $37000/34000 is a support zone. So, I am expecting a pullback from the strong and trendline support zone.
$45500/45800 has created a strong resistance zone. Several times BTC was unable to break above the strong resistance zone. So, if BTC pulls back from the support zone, our first target should not be above the $45800 price zone.
We may see a long-term bullish trend only after breaking above the strong resistance level of the $45800/46000 price zone.
BTC / USD Before analyzing, please do not forget to like and follow me
Everything in the characteristic chart...
Good luck

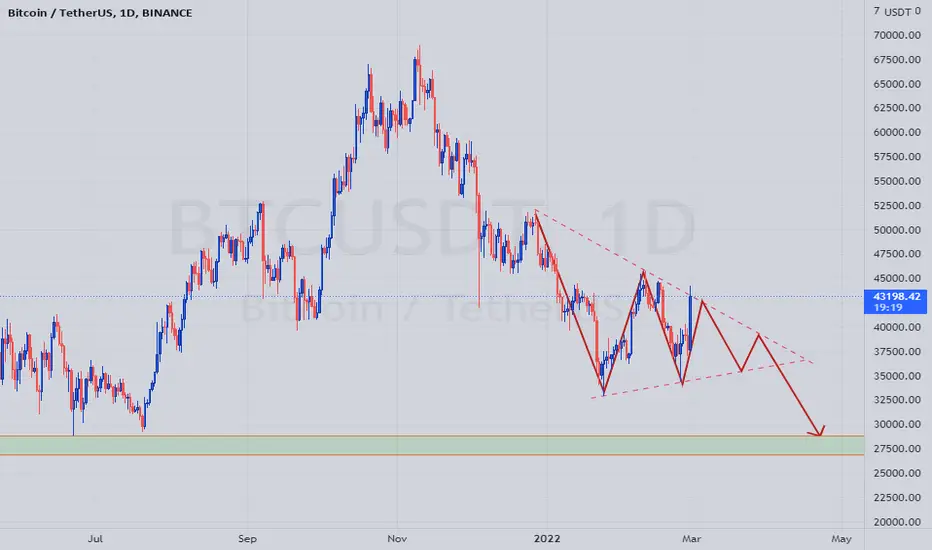
BTC / USDTHere we see a very beautiful pattern that continues the trend.
Take care of your capital.
Every bitcoin wave is an opportunity to withdraw smart money.
I'm still waiting for Bitcoin to fall below $ 31,000
Good luck
Follow me for more analysis
BTC / USDT Before analyzing, please do not forget to like and follow me
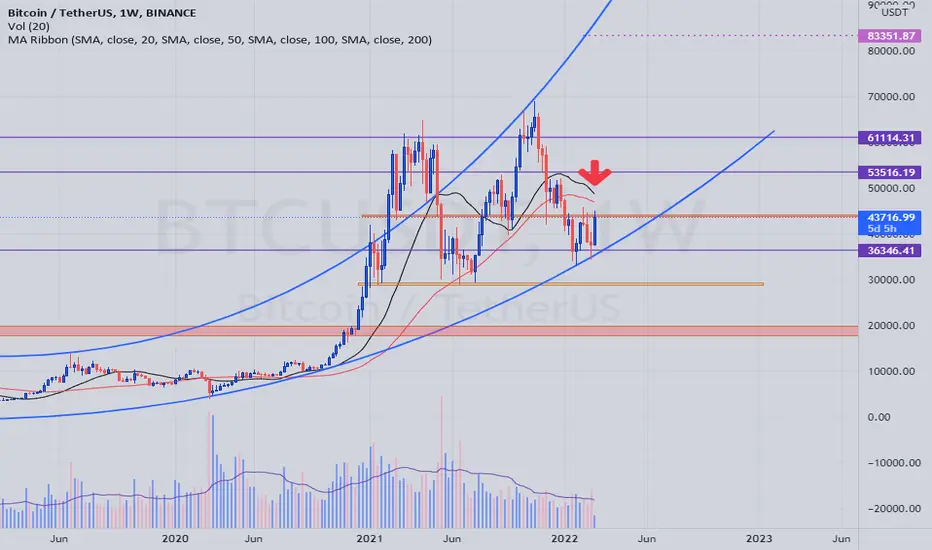
In this analysis, we examine bitcoin in weekly timeframes
As you can see, we have identified important levels
These levels are equal to Fibonacci levels
And most importantly, we are seeing the average price of the last 20 weeks approach the last 50 weeks
If bitcoin is rejected from the $ 45,000 area.
We're waiting for the $ 36,000 and $ 30,000 area reactions to reconsider the situation at that time.
Good Luck..
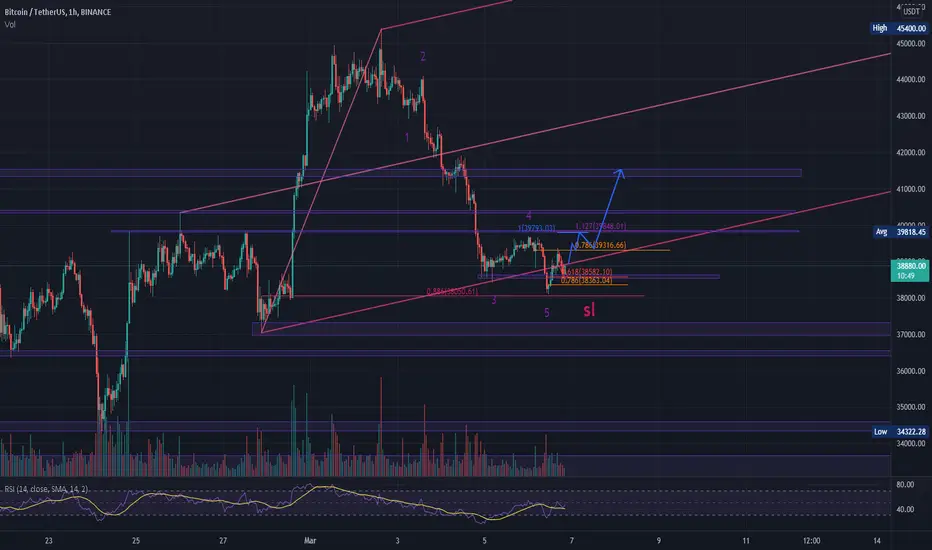
BTCUSDTI know that nobody expect BTC to move up at least while there is a war going on But I personally believe that BTC is about to grow but we can not expect it to pump.
Therefore we can go long and put the stop loss level at around 38050.61 and we may expect a harmonic pattern which is a butterfly so we could put our first tp at around 39793.03 and since the price has touched the the lower line of the pitchfork we could expect it to move to the mid line.
.
what is your idea about BTC?
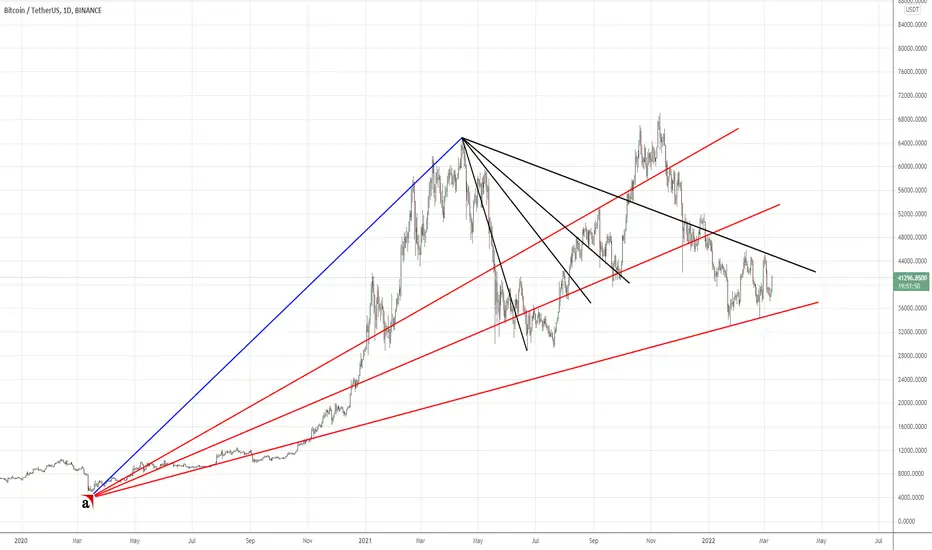
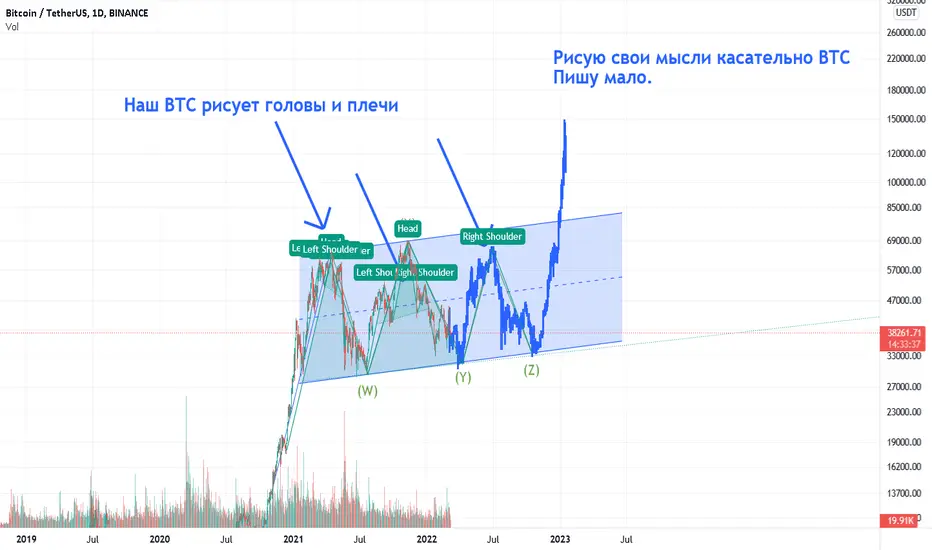
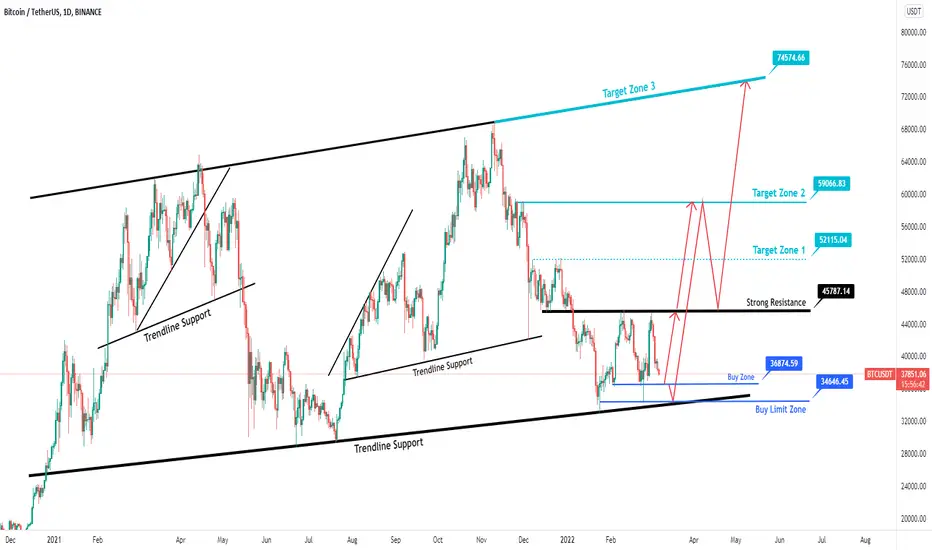
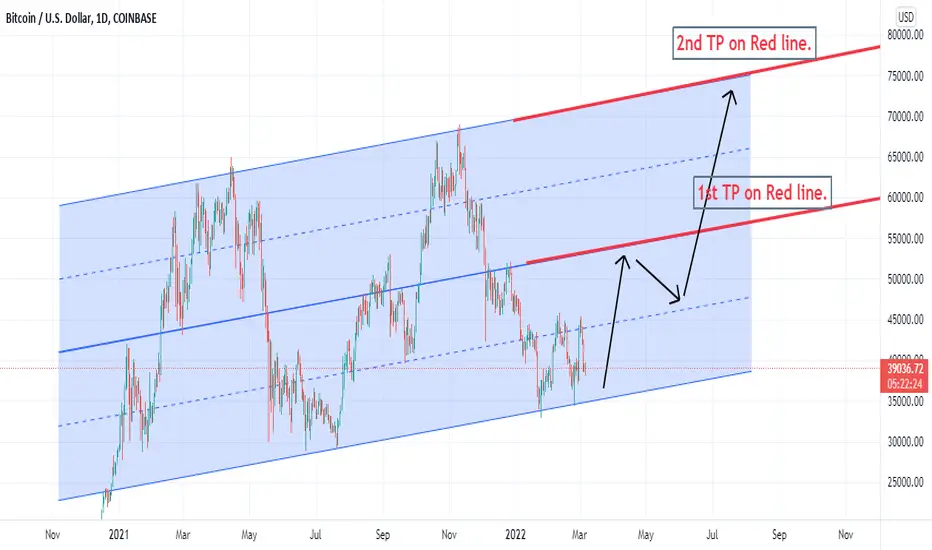
According to Bitcoin analysis,it can have a target of 75k to 85kMy opinion as an analyst is that currently Bitcoin will fall to around thirty-three thousand dollars and will get energy, then in the first part it will have a growth up to around fifty to fifty-five thousand dollars, and again because it can not cross that point. The fall will be around the price of forty-five dollars and then at that point, with the formation of an inverted head and shoulder, it will move strongly towards the second target and break the first target, the second target can be around seventy-five thousand and above around eighty And five thousand dollars.
This is my opinion and it can be wrong. Please do not buy or sell on this analysis.
Bearish Bat on 4H chart of BTCWe have a bearish bat pattern and this is a worrying factor, Invalidation of this pattern will be $47,348. If you look at geopolitical issues, They seem to be escalating rather de-escalating so this can certainly effect the global financial markets. We do have news that in Russia people are buying BTC by paying premium of over $20k which is a bullish factor whereas recent remarks of FED chair Powell regarding crypto were not good plus he's inclined to impose 0.25% interest rate hike in March so these factors can have a negative impact on crypto. We are bullish on BTC at invalidation point of bat
