BTC - 7 Day forecast - What to expect?Hey everyone. I've been wanting to make another GOOD chart for you guys for a while now. Lately I've been so busy working and just too tired to go all out and publish charts as frequently as I would like. I've been trying to at least post quick market updates and important levels to watch via Twitter to hold you over. Anyways, hopefully everyone is well and getting one step ahead of the market! IT'S VERY HARD to do. I get so upset sometimes seeing people on YouTube posting elementary level analysis and they have thousands of gullible followers getting liquidated over and over. I get it, if they're that gullible and want to watch YouTube videos thinking they've found the key to financial freedom well then lets just say they have A HARD LESSON to learn up ahead. I always advise anyone and everyone to learn about cryptocurrency. Yes it takes quite a while to just TRULY UNDERSTAND it and compare it to todays financial systems but it's worth every single second. In other charts I've mentioned that understanding the fundamentals will really give you an edge in the markets especially in times when a reversal may be likely coming. In those rare moments, the fundamentals out-weigh the technical analysis. Those are the moments where the technical analysis looks very bearish and may be showing further downside potential BUT bulls step in and say "enough is enough!" "I personally value this coin (BTC, ETH, ADA, DOGE, SHIB, ect...) more than its current price." YOU NEED to completely understand the technology and potential it has in order to put a price tag on it. What is it worth to you? Without looking at a chart at all, WHAT are you willing to pay for a certain crypto/stock/gold/house? I encourage anyone and everyone to dive in. You'll just end up going deeper and deeper down the rabbit hole exploring and learning. PERSONALLY, I ENJOY IT! I also have a strong passion for helping people. I honestly am seeking a job in the cryptocurrency field. Whether it's as a journalist writing articles, a crypto market analyst, or even helping companies by creating a system for their business to accept cryptocurrency as a payment, I LOVE EVERY BIT OF IT! Mark Twain said "Find a job you enjoy doing, and you will never have to work a day in your life". I find this quote to be very true. Well, that's enough for the long introduction. Lets go over the chart below.
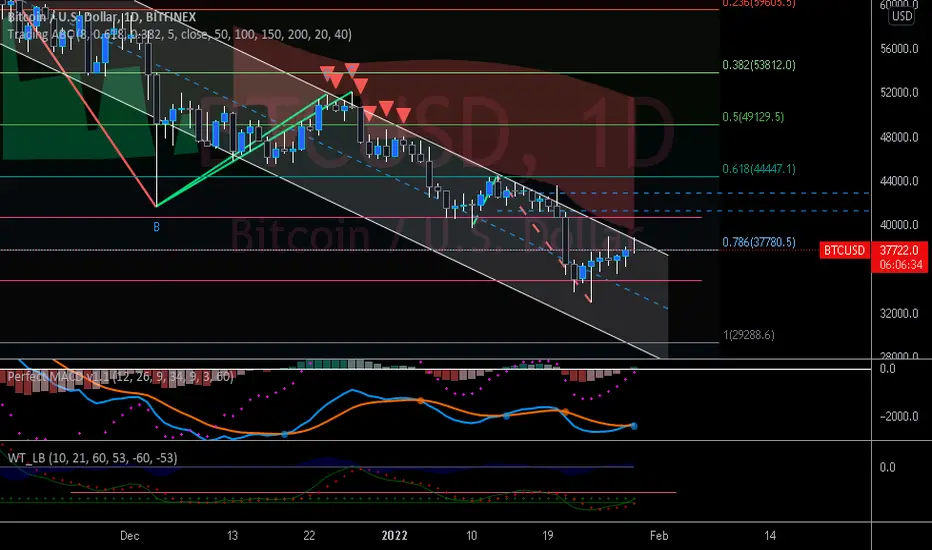
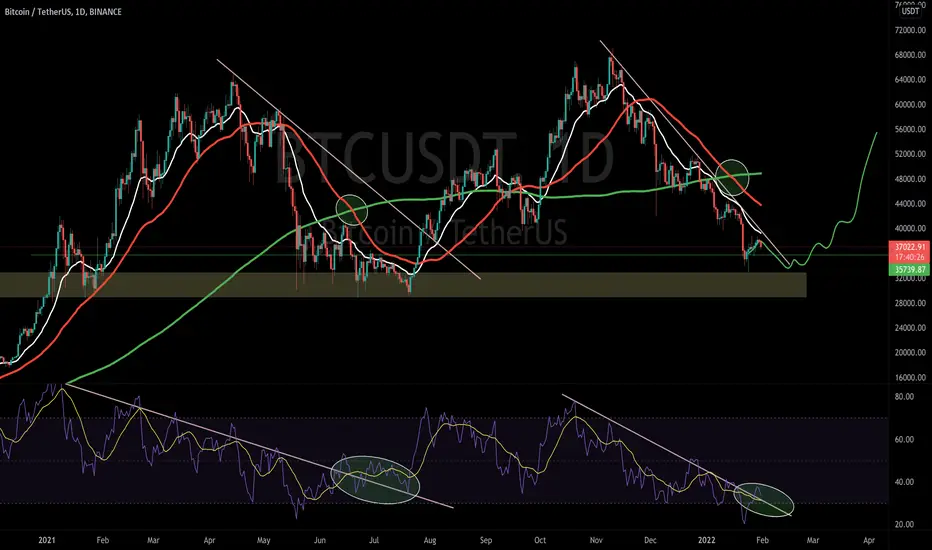
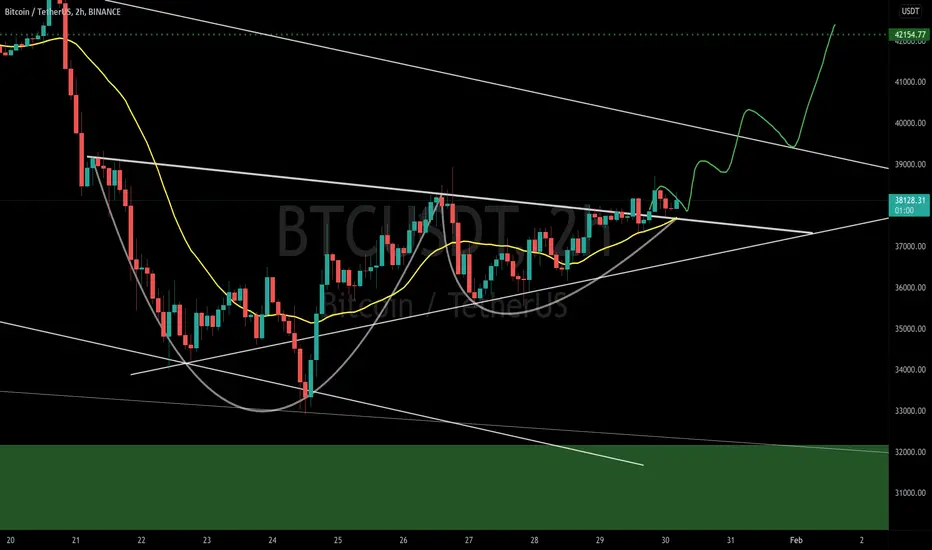
As you can see, bulls have been struggling to get above this resistance area (the 0.5-0.618 fibonacci retracement level from the 43.5K drop) Take note of the RSI and the fact that It's not yet in the "overbought" area. This suggests that bulls CAN still push above the resistance before a pull back. Personally, I don't think that is the most likely scenario though, although it remains in the cards as a POSSIBILITY.
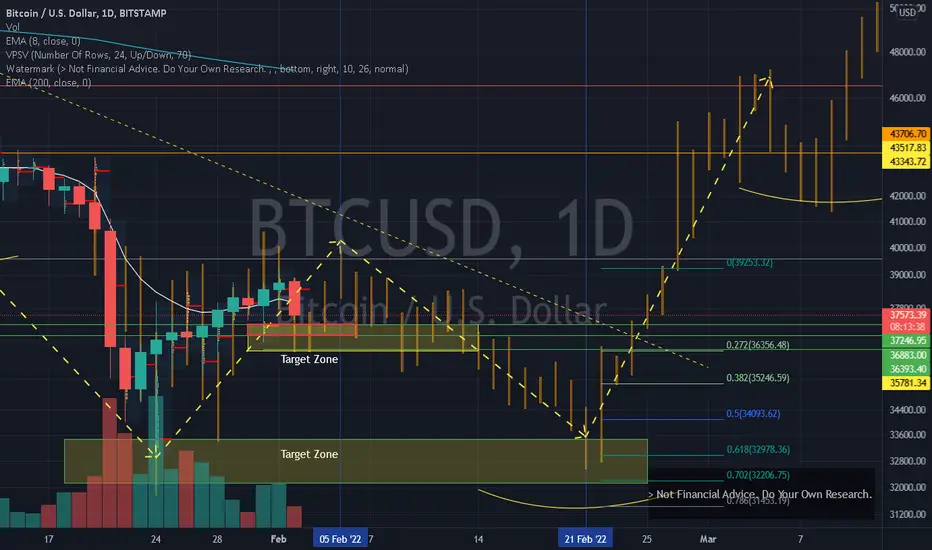
To the left you'll see a "fibonacci key" which basically shows you how I identified BTC's current support levels. If BTC does pull back, we would look for support at these levels. The higher the better! Most recently, BTC bounced off of the 0.618 level where the potential "left shoulder" is marked. This is generally a good thing. ( the 0.786 is the best level {not shown}, the 0.5 is OK, and the 0.382 is basically the last support for an upside continuation). Looking at these levels, we can see that BTC has plenty of room to pull back while still being able to continue the overall upwards move. The yellow line is an idea I think could play out and It would likely give bulls the strength needed to get above the resistance area, and hopefully turn it into support. If this Idea does start playing out, It would potentially create a "head" to go along with the "left shoulder". After that, the potential Inverse H&S will become more obvious to a lot of traders and I'd say there's a better chance of it playing out completely at that point. It's very common to see an inverse head and shoulders pattern near a bottom/trend-reversal area and that is why I'm looking for one as I think in one way or another, it's very likely. If BTC does manage to create a VALID Inverse H&S pattern, I think it would very likely get us above the resistance! This is the path I prefer
If BTC does pull back and somewhere along the way drops below the 0.5 fibonacci support level, then bulls will be in a bit of trouble. A quick-wick down is ok but any type of lasting move downwards below the 0.5 support level would be a sign of weakness. There is still the 0.382 support level technically but usually if BTC bounces off the 0.382, it's very short-lived and gets back above the 0.5 rather quickly. the 0.382 is good for a quick wick but not for long lasting support. The red line shows a situation like this playing out where BTC drops below the 0.5, tries to bounce back above it once or twice but overall bulls would be very weak here and this would suggest that BTC will head down to the previous low near 33K to retest the area! If bulls do manage to bounce at the same level as the previous low, it would create a double bottom. A double bottom is a very good pattern to trade and usually signals at least a temporary bottom for a relief rally, OR POTENTIALLY a macro bottom where bulls take over and a macro trend reversal takes place. That situation would likely lead to new all-time-highs or at least a test of the previous all-time-high.
To confirm a major trend reversal, first BTC must break above the resistance area and create a "higher-high". Then when BTC pulls back we need to see the previous resistance turned into new support. This would create a "higher-low" to go along with the "higher-high", confirming at least a temporary trend reversal.
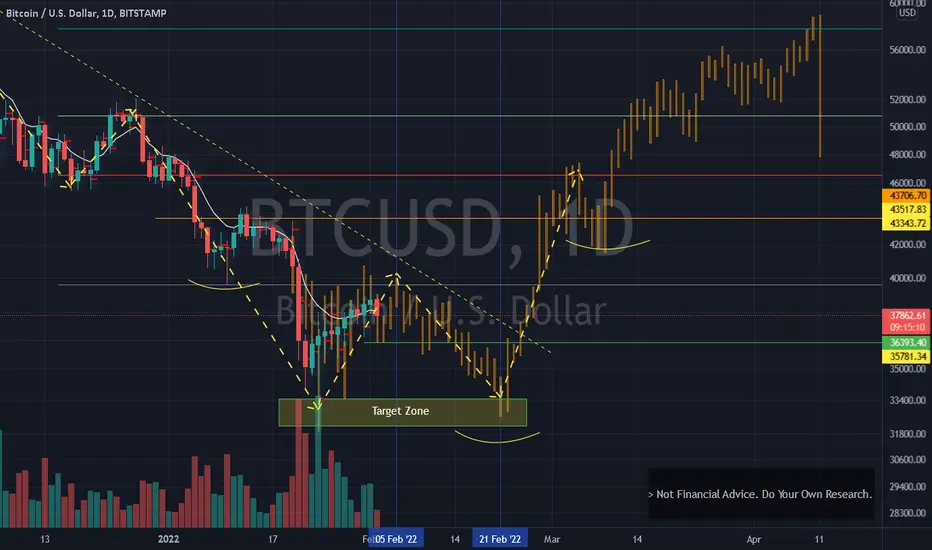
This chart shows what I BELIEVE is the more likely set of scenarios that could likely end up playing out over time. (the next week or two) There ARE OTHER possibilities though that you should be aware of. Instead of an inverse head & shoulders bottom, We could see a "bump-and-run" type situation play out. This would be my 2nd pick for the most likely situation to play out. A bump-and-run would likely require BTC to make a lower-low, probably even below 30K! A bump-and-run starts with a very sharp drop followed by a big bounce. The bottom does not get retested and there are no major pullbacks but instead, price climbs up higher and higher, eventually passing the area of the original drop. If you'd like to see an example, look at the "COVID dump" from March 2020 to middle of MAY 2020. In previous BTC charts I've published, (I'll leave links to them below) you can see that I've been showing the possibility for BTC to drop down to the 20K area. AS OF RIGHT NOW, I don't believe those situations are as likely HOWEVER I CAN NOT rule them out completely. I feel that this is a good area for at least a temporary bottom as BTC hit the downside targets shown in my "wolf waves" analysis. (link below) I've also had my eyes set on the 34.5K area for months now as my loyal followers know. I APPRECIATE ALL OF YOU GUYS!
A major news story can absolutely turn the tides either way. An extremely bullish news story could potentially blast BTC back up to 60K in a matter of days! The opposite is also true where an extremely negative news story could cause BTC to drop to 20K or even below 20K in a matter of days! THIS IS WHY STOP-LOSS ORDERS ARE EXTREMELY IMPORTANT. I can never say that enough... STOP LOSS ORDERS ARE EXTREMELY IMPORTANT!
Well, that'll be it for this analysis. I hope you guys like it or at least find it interesting. I do it for you guys, and everyone/anyone who's willing to look and read a bit. It's what I enjoy doing and I honestly have put in countless hours, days, months of research to learn many of the things I share with you guys. Honestly, I wish I had more free time to make even more but eventually we'll get there!
If you enjoyed this PLEASE LIKE, FOLLOW, and SHARE. I want to help more people if I can so sharing is VERY APPRECIATED. I really do appreciate everything including COMMENTS. Please feel free to COMMENT. Sometimes I may not be able to respond right away but I always do update my charts (especially in relevant situations where the market can potentially shift) so be sure to check for updates I've posted
***THIS IS NOT FINANCIAL ADVICE! This is an just an idea and speculation based off of my experience researching cryptocurrencies. I Always recommend doing your own research before trading or investing in anything.***
Btcforecast

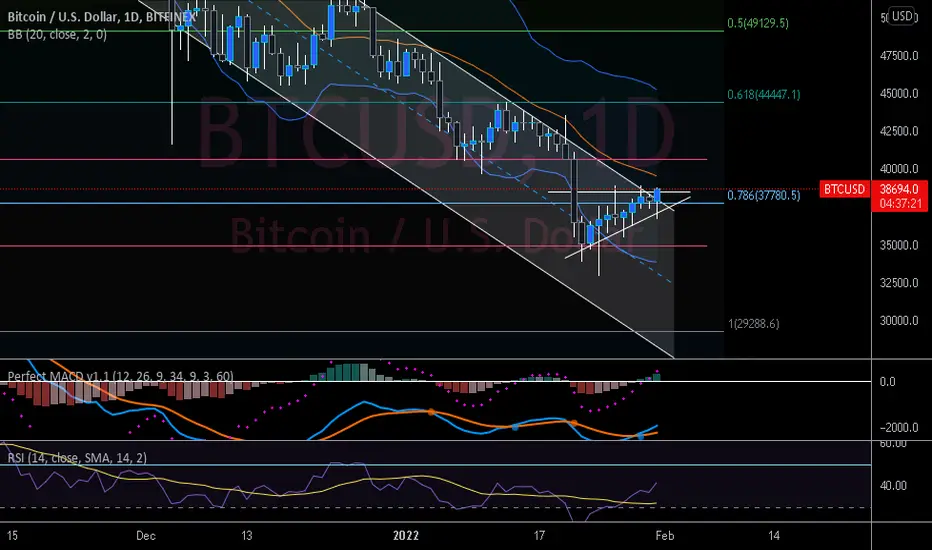
BTCUSD: Feb 3 update & Feb 4th + 5th ProjectionI am an amateur technical analyst. This is not financial advice. You should always do your own research. Consider this post as entertainment. I'm simply sharing what I see in the charts and always welcome collaboration and feedback.
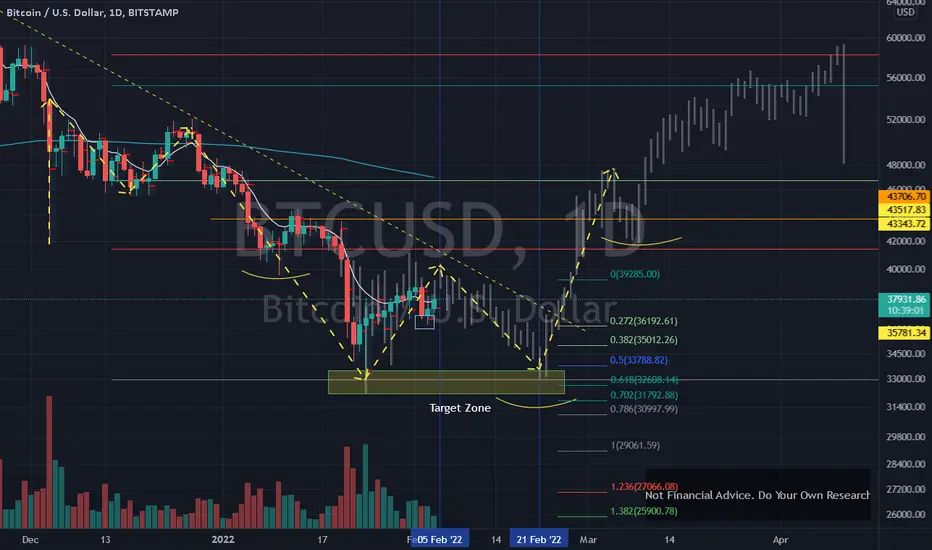
Updating my previous post of Feb 3rd. BTCUSD stayed within the fractal and yesterday went the full depth of the fractal bar. So far, the fractal remains intact as the market continues to work within the pattern of the May '21 fractal.
Based on the fractal pattern, today and tomorrow should be up days. There's a possibility that we reach as high as 41,250, which is the upper trend line above the pattern, and would be slightly above tomorrow's daily bar. After tomorrow, the pattern indicates a gradual decline until Feb 21st. Feb 21st then offers the opportunity for a reversal and potentially the launch pad for ALT season.
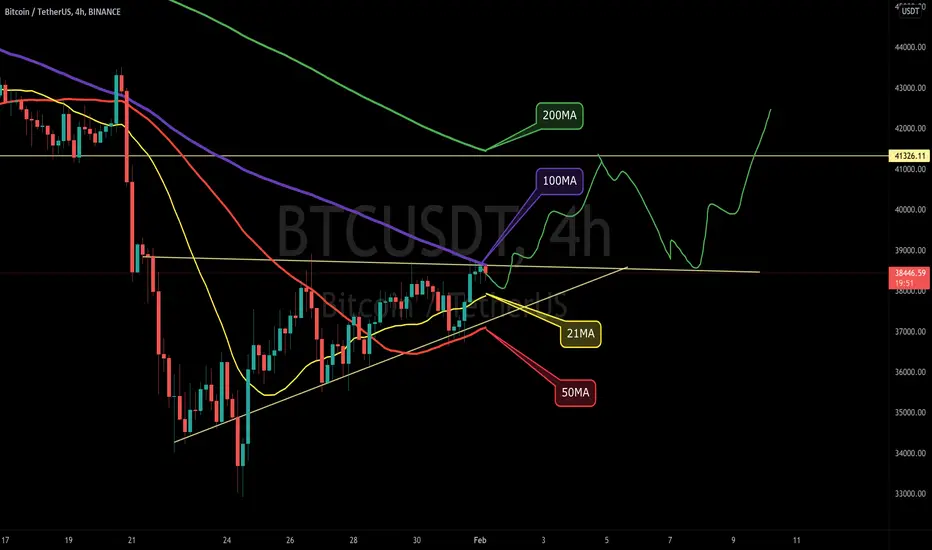
BTC/USDT 2HOUR UPDATE BY CRYPTOSANDERSWelcome to this quick BTC /USDT analysis.
I have tried my best to bring the best possible outcome in this chart.
Hello friends
As I mentioned in the previous chart, BTC may reverse from here
BTC has bounced to 21ma which can only come once for 21ma retest and BTC retest confirms Done thanks
As I mentioned, btc has bounced from here and it has pumped altcoins in USD pair as well.😊😊😊
This is not a piece of financial advice.
Sorry for my English it is not my native language.
Do hit the like button if you like it and share your charts in the comments section.
thank you.
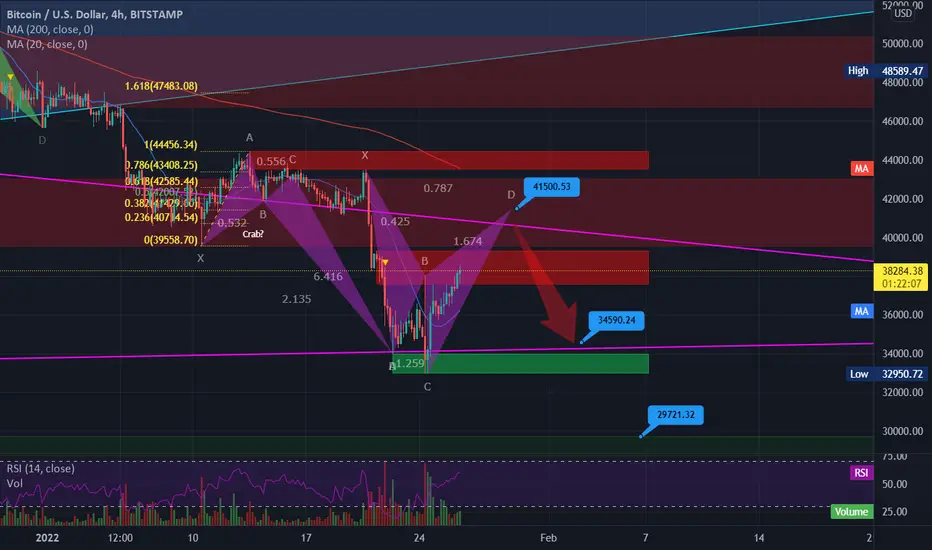
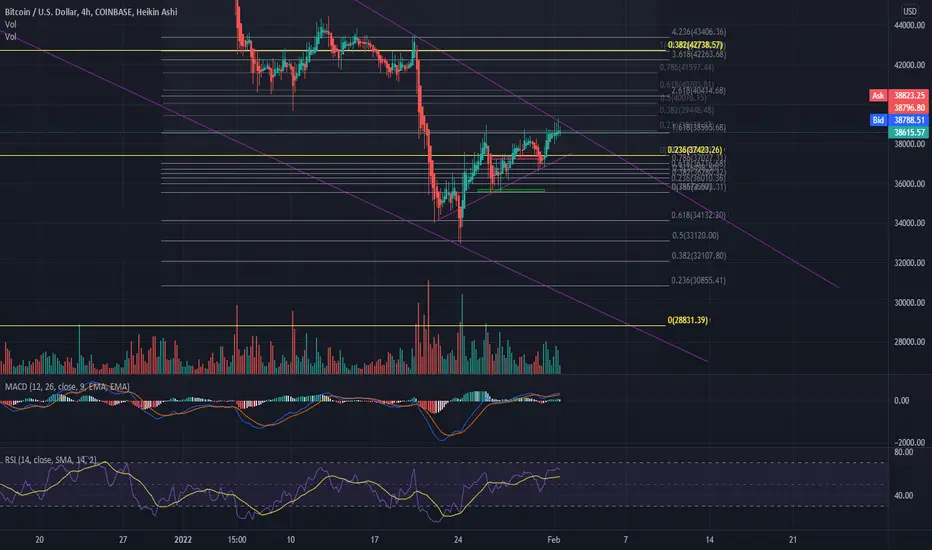
Bitcoin Bull TrapLooking at this 4hr chart it looks to me like BTC is forming a bearish Cypher harmonic pattern.
My whiskers (and the chart) are telling me that we will likely push up towards $41,500 and then break down.
For me, this creates a bull trap scenario. I think retail traders could ape in as we get closer to $40,000 and then that will create
the liquidity that the whales are looking for to dump some more.
When the down trend continues I think we will move to around $34,500.
If we lose this level then we could be seeing a larger bull trap play out as the giant bull flag breaks down.
Further downside targets would be around $29,700 then $20,200.
If these levels break I will have limit buys set between $14,000 and $15,000.
On the upside we could see the Cypher roll over and turn into a bearish Shark. This would put the D up around $47,400, which is also close to the 1.618 ext. of the XA leg of the bullish Crab harmonic that has completed. The upside targets are the X, B, C, A points (of the Crab) and then the 1.618 XA at $47,483.08.
For me, we need to get above $47,500 to invalidate the bearish trend and continue the bull trend. Even then, we will need to push above about $50,400 to get back into the blue ascending channel. If that happens I will be howling for the moon!
What do you think is next?
Owhooooo!
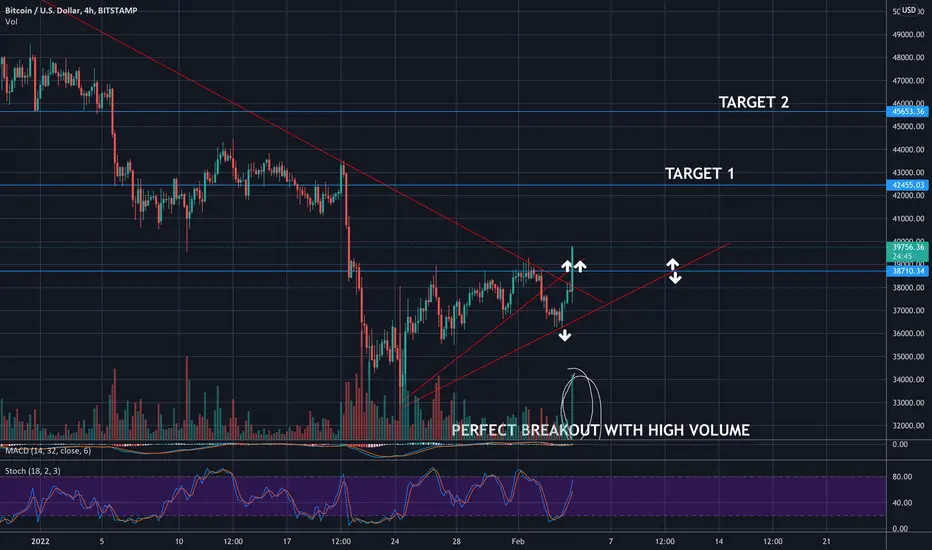
BITCOIN MADE IT - THE ROCKET IS LAUNCHED - BTC/USDNice breakout on BTC/USD chart. Solid Volume. I am entering LONG positions when we have a lower pullback; I will use this opportunity to buy even more.
Bitcoin movement forecast [BTC/USD]The average purchase of bitcoin in 2022 is $ 30,000 and in 2023 it's $ 50,000
BTC/USDT 2HOUR UPDATE BY CRYPTOSANDERSWelcome to this quick BTC /USDT analysis.
I have tried my best to bring the best possible outcome in this chart.
Hello friends
As I mentioned in the previous chart, BTC may reverse from here
BTC has bounced to 21ma which can only come once for 21ma retest and BTC retest confirms Done thanks
This is not a piece of financial advice.
Sorry for my English it is not my native language.
Do hit the like button if you like it and share your charts in the comments section.
thank you.
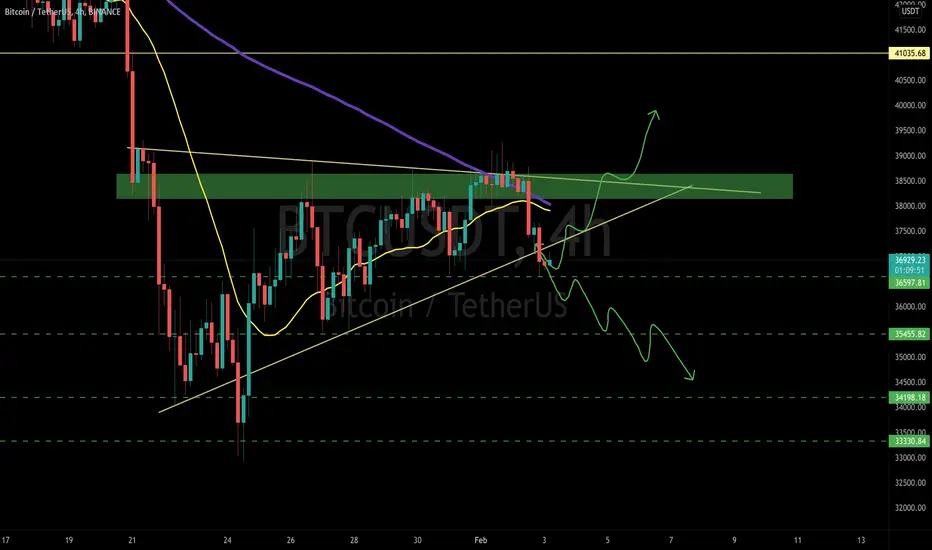
BTC/USDT 4HOUR UPDATE BY CRYPTOSANDERSWelcome to this quick BTC /USDT analysis.
I have tried my best to bring the best possible outcome in this chart.
Hello friends
As I mentioned in a previous chat BTC may bounce from here
BTC has bounced 21ma which can come only once for a 21ma retest and BTC got dumped at k of the bearish moment and now I think BTC will bounce from yah 36500 or break 36500 bit so We can see 34200k yes 33300k at once.
This is not a piece of financial advice.
Sorry for my English it is not my native language.
Do hit the like button if you like it and share your charts in the comments section.
thank you.
BTC May '21 Fractal Tracks to Current BTC Price Action (updated First, know that I am an amateur technical analyst.
This is not financial advice. You should always do your own research. Consider this post as entertainment. I'm simply sharing what I see in the charts and always welcome collaboration and feedback.
Updating my previous post of Feb 2 to add anticipated target zone for the current retracement
BTC: May '21 Fractal Tracks to Current BTC Price ActionFirst, know that I am an amateur technical analyst.
This is not financial advice. You should always do your own research. Consider this post as entertainment. I'm simply sharing what I see in the charts and always welcome collaboration and feedback.
Following up on my Jan 22nd post.
We completed the short formed "M" pattern. We did not hit the absolute low, but we did reach the all important target zone below the 2.702 fib. Coming out of the M pattern, we now look to be forming a 'W" pattern which is bullish, as well as potentially an Inverse Head & Shoulders pattern on the local .236 fib, which will provide the market the push it needs to get up to the .702 fib.
Again, don't trade on this analysis. I'm just sharing the world as I see it today.
BTC/USDT 4HOUR UPDATE BY CRYPTOSANDERSWelcome to this quick BTC/USDT analysis.
I have tried my best to bring the best possible outcome in this chart.
Hello friends
As I mentioned in a previous chat BTC may bounce from here
BTC has bounced 21ma, which can come only once for 21ma retest, and go to 41k btc
I am still bullish on BTC.
Thanks to all of you.
This is not a piece of financial advice.
Sorry for my English it is not my native language.
Do hit the like button if you like it and share your charts in the comments section.
thank you.

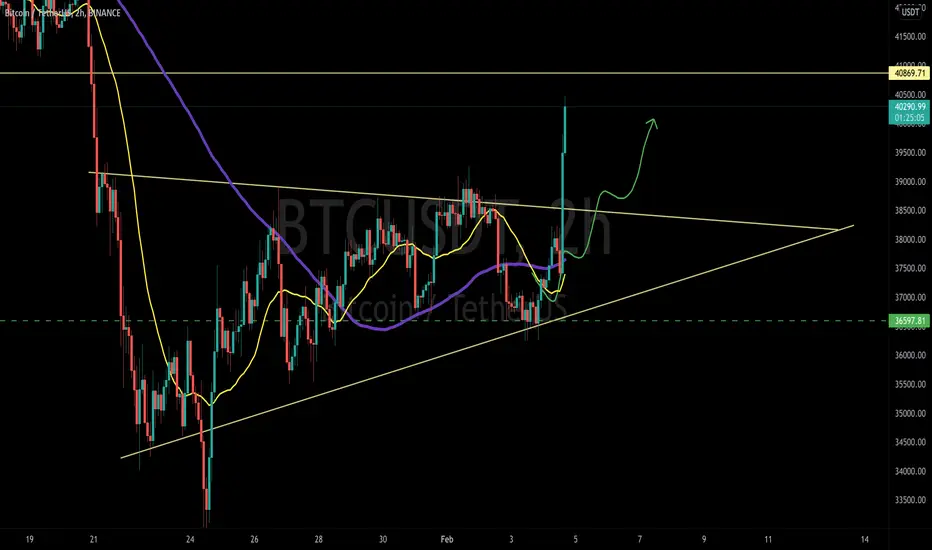
BTC Bullish Triangle Breakout!Doing a little update from yesterdays TA and ill keep this one a little shorter! We have successfully broken out of the bullish triangle we talked about, keep in mind there is always the chance that we reenter this pattern before the real breakout happens, but either way we are looking strong, we have been steady rising for over a week now and we have taken out some important levels on the way like the 0.7 FIB and the top of this triangle, now we are looking at holding above here and our next goal is going to be reclaiming our midline on the bollinger bands, we need to get into the upper half as the midline will then be support and we have the opportunity to make a run for that top band! After the midline on the BB's we are looking at an absolute key level that is.. the pivot point sitting around 39.8K, reclaiming this level will definitely add a ton of bullish momentum, not only is just the current pivot point but is just below 40K and as we all know that is a must reclaim zone at some point sooner than later. The Wavetrend is looking good aswell we are rising still and not showing virtually any signs of slowing up just yet, we had a strong rebound coming out of the buy zone and we are about halfway to that midline, of course a run above this midline would be very ideal but in this wave i don't know if thats going to be the case, none the less if we do see a little drawdown it wouldn't be unhealthy to do so, we will likely catch some support on the way down before hopefully making our way back up and going for that midline and beyond! Not financial advice just my opinion!

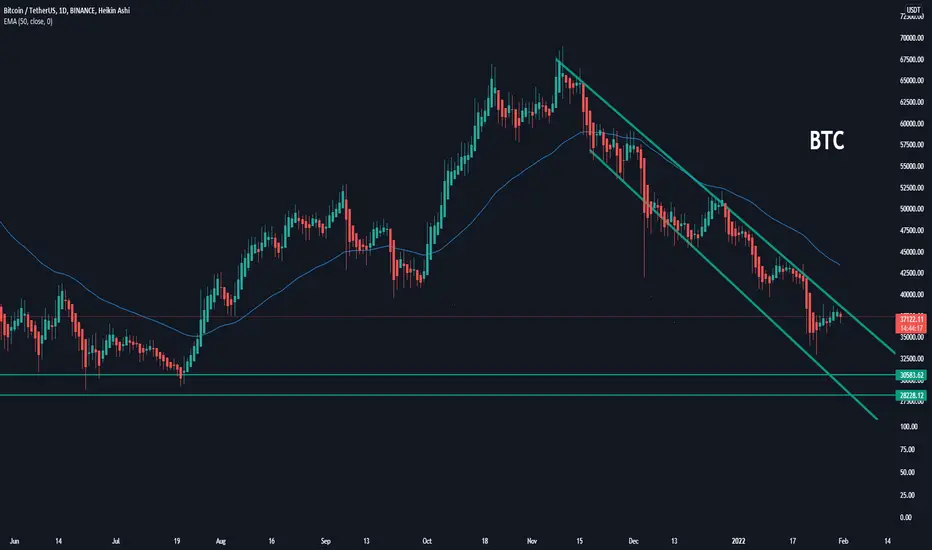
BTC - 2/1/2022Sort of a continuation on the last BTC idea I posted. Based on the channel BTC looks like it's in, I think shortly we'll see a drop in price.
Idea for current supports and resistances of BTC .
As of right now, btc seems bearish and I feel is likely to test support levels at 35.5k to 34k.
I do feel like this downward trend will be short-lived, but depending on how much selling activity happens on the way down, we may very well see a test of support at 29k , but is unlikely.
These are just ideas, not FA. Do research for yourself and don't just take my word for it.
Happy trading and good luck!
BTC/USDT 4HOUR UPDATE BY CRYPTOSANDERSWelcome to this quick BTC/USDT analysis.
I have tried my best to bring the best possible outcome in this chart.
Hello friends
In 4 hours update, BTC may turn bullish after 21 ma retest
This is not a piece of financial advice.
Sorry for my English it is not my native language.
Do hit the like button if you like it and share your charts in the comments section.
thank you.
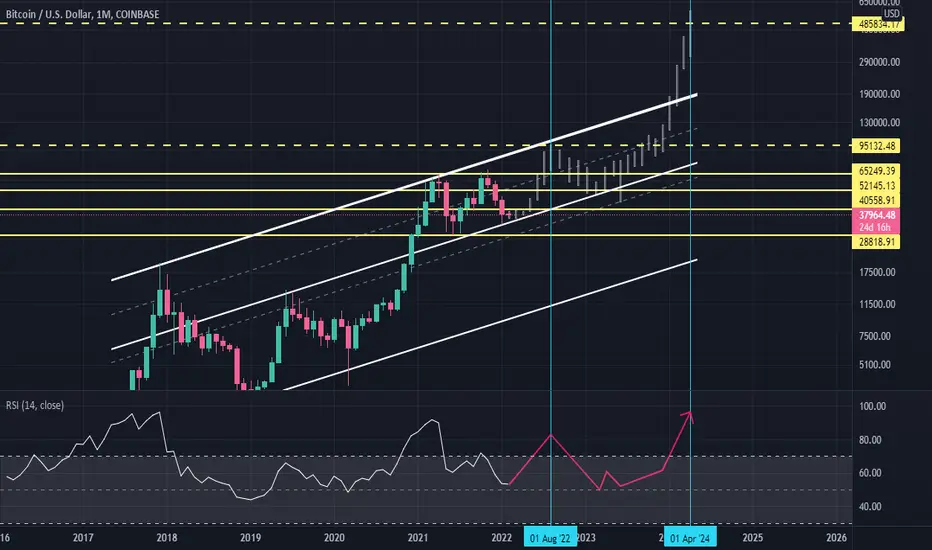
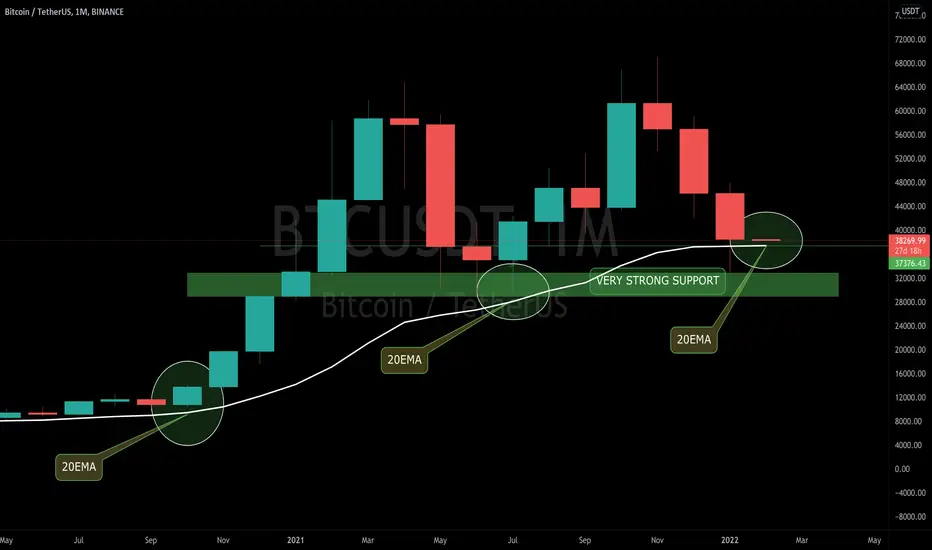
BTC/USDT MONTHLY UPDATE BY CRYPTOSANDERSWelcome to this quick BTC /USD analysis.
I have tried my best to bring the best possible outcome in this chart.
Hello friends
The monthly close of btc which is btc which I think is a bullish trend from here, the green box is acting as strong support on the downside
Because on 1st October 2020 20ema which btc bounced was a jump of 42% pumped
2nd bounce on 1st July 2021 20ema for btc bounce 46% 20ema is covering support bounce, so we can assume 20ema a 45% pump in 1st fab 2022 btc to btc at list $50k
This is not a piece of financial advice.
Sorry for my English it is not my native language.
Do hit the like button if you like it and share your charts in the comments section.
thank you.
BTC Breakout!!When we last talked about BTC we were looking at a couple key areas we needed to breakthrough in order for us to continue moving to the upside, those levels were the 0.7 FIB, the top of the descending channel and the top of the bullish triangle, we are looking solid here we have taken out the 0.7 FIB and the top of the falling channel, all thats left in our current spot is the top of the bullish triangle! Keep in mind guys we need all of these to confirm after our daily close tonight at 7PM EST. A breakthrough of all of these levels or even the current 2 is going to be significant and the chances of us seeing some big bullish momentum significantly rises. The level we would be looking at after these 3 is the midline on the bollinger bands, which currently acts as resistance as of right now, flipping this level not only gives us a cushion of support but opens the door for a run at that top band. Historically closing ontop of the top band leads to explosive price action to the upside, not always but a majority of the time we see this happen, same thing applies to the downside. Looking at our MACD we look good here, we are beginning to see nice separation between the MA's which is always a good thing, this makes it more difficult for the bears to trigger a bear cross. Not only that but on our histogram we notice that our green bars are rising day by day showing an increase in bullish momentum, we want to see this continue moving forward and keep in mind if we start to flatten out or decrease the bullish MACD cycle is likely coming to an end in the short term. Now the RSI looks good aswell, we are still stuck in the bottom half below the midline which means a confirmed downtrend, but the good news is we have flipped the SMA to support and we are on our way up, the main goal here is simply getting above the midline and holding above, this puts us back into a confirmed uptrend and relieves a lot of bearish pressure! Not financial advice just my opinion!
BTC will NOT retest 20/30k. Triple Support consolidationBTC is consolidation phase for next 2 candles i.e. 6 days,
Strong EMA 200 support offset shown converging with primary demand level of 32k
Interestingly this is the same point it will enter the 3D oversold position giving a perfect boost to bounce back to 40k.
Not a financial advise.
Any feedback would be appreciated.

Will BTC try the following levels ... below?If we take into account the technical analysis, the amount of liquidity in the 28-30k range, the global geopolitical situation, the global economic crisis, the huge inflation in the USA ... then BTC has real chances to reach the 28-30k areas as well. .
This is not investment advice!
BTC/USDT 1DAY UPDATE BY CRYPTOSANDERSWelcome to this quick BTC /USD analysis.
I have tried my best to bring the best possible outcome in this chart.
Hello friends
btc 1 day update btc trend line is going down continuously btc retest trendline if seen again and again friends, the pattern rsi is also something like this
BTC is trending down, when BTC touches the trendline, downwards, same pattern is seen in RSI
BTC 1 day update. We were looking at that moment. In RSI also we can see that the trend line is moving up and once it crosses above the trendland the market is dumping and then the market turns down but once again the market may be in BTC could bounce or if it is going to be bullish then BTC could bounce from here.
This is not a piece of financial advice.
Sorry for my English it is not my native language.
Do hit the like button if you like it and share your charts in the comments section.
thank you.
BTC/USD WEEKLY UPDATE BY CRYPTOSANDERSWelcome to this quick BTC/USD analysis.
I have tried my best to bring the best possible outcome in this chart.
Hello friends
btc weekly update Looks like it is in a bullish trend and the may bounce from here.
This is not a piece of financial advice.
Sorry for my English it is not my native language.
Do hit the like button if you like it and share your charts in the comments section.
thank you.

Bitcoin, Trend line break up could start a new BULL cycle. Bitcoin, Trend line break up could start a new BULL cycle.
Best confirmation, additional SL hunt with HUGE VOLUME AT LOW

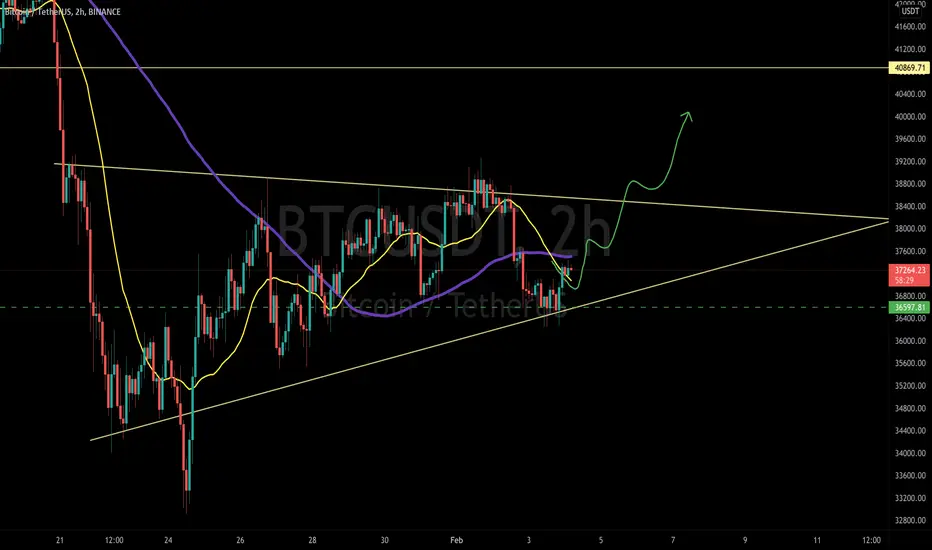
BTC/USDT 2HOUR UPDATE BY CRYPTOSANDERSWelcome to this quick BTC /USDT analysis.
I have tried my best to bring the best possible outcome in this chart.
Hello friends
btc has created a cup and handle on 2 hours and retest is also happening with 21 ma happening btc can go up but today is of the closing month but update saying 2 hours
This is not a piece of financial advice.
Sorry for my English it is not my native language.
Do hit the like button if you like it and share your charts in the comments section.
thank you.
BTC Looking For an Upside Break!!?Bitcoin id looking to break up and above the 0.7 FIB level which also has over hanging resistance coming from the descending channel, we wicked all the way up and above both these levels but have since come back down, what im looking for tonight on our daily close is a push up and close atleast above the 0.7 FIB! This opens the door and allows us a better chance at making a push to breakout of this descending channel, as for another level of resistance we will face is the 40k-40.7K zone, breaking above 40K and holding it is going to be a very bullish sign. Looking at our automated ABC pattern detector we are currently forming the C structure with a target of about 41.2K - 42.8K, if we can successfully complete this pattern we will be ending up in a very good spot above some major resistance levels. One thing that is crucial for PA going forward is that we need to break the current downtrend we are stuck in, that starts with all the breaks of resistances i was talking about but also making that C run complete and from there continuing to move up. A good way you can keep up with the current trend is looking at the RSI, being below the midline like we currently are confirms a downtrend, we need to break above the midline and hold above to see a confirmed uptrend come into play. Looking at our MACD we notice that we actually just got a bullish cross, now don't jump to conclusions too fast, we need this to confirm first, our MA's are tight together and as you guys know this allows for a quick reversal and bearish cross. What we want to see going forward is these MA's start to move apart creating space between eachother making it more difficult to trigger a bear cross, another important thing we want to watch is the histogram, we are currently on our first green bar which is a great sign but moving forward we need to see these green bars continue and we gotta see an increase day by day showing an increase in bullish momentum. Now the Wavetrend, we are looking very good here overall, we bottomed out in the buy zone and we seem to be reversing very nicely, our wave has crossed over the red crosses and is beginning to move to the upside, we have been trending down for quite awhile now and haven't seen a significant bullish wave so thats exactly what im looking for here. Keep in mind the wavetrend is a slow mover and rarely ever has jagged turns and moves, we see smooth transitions between waves, the one key level we need to break above to really confirm a strong bullish wave is the resistance level coming from the last peak from the 15th of January! Not financial advice just my opinion!