Bitcoin Falling Wedge!!Bitcoins still struggling to break up to create a higher high and that may be due to the fact that we have a very obvious falling wedge pattern playing out, price action has respected both levels very strongly and we are seeing that currently with our daily candle getting what looks like a bounce off the top of the wedge. Now historically falling wedges have a high chance of breaking out to the upside but as we all know especially if you are trading there is always the threat of being flushed out before the move actually plays out, and thats exactly what i think we are going to be looking at here. I have drawn out a box ontop of the 0.7 FIB level or just about 38K where major longer term support lays, i think this area is going to be a very likely bounce area or flush out area where a big institutional wick comes into play, the thing is this falling wedge should realistically be coming to an end right around the 0.7 area if we don't breakout sooner, we have the bottom support lining up perfectly with 38K. Another indicator that is very accurate and should be looked at is the mean reversion channel, the oversold-strong oversold area lines up once again with our 0.7 FIB level and as you guys can see at our ATH we were strong overbought and shortly later a big downside was triggered, same thing could apply here where we land in the oversold area, maybe consolidate for a brief period before then recovering back upwards. Looking at the squeeze momentum indicator, we still realistically have some downside left to go, we are currently coming out of a bearish squeeze and are currently fading out of the squeeze release portion, which is the most explosive part to this indicator. The main thing is that we are slowly but surely coming back towards the midline where the opportunity to trigger a bullish squeeze is there, what we want to see continue is the red bars decreasing day after day like we have been seeing recently, showing a decline in bearish momentum and then a strong push into green territory where then we see rising green bars day after day. Now the Wavetrend indicator also gives me more confirmation we are going to dip a bit lower, and the reason being is that the wavetrend after coming up briefly is beginning to come back down, we have a strong curl currently in play and we are beginning to come back down, i personally think we could see something similar to what i have drawn out, a W shaped recovery, we will need to come back down to the buy zone where then we get a bounce and begin the road to recovery. Overall all of these different factors play into the same outlook i have on BTC and the market, everything confirms a little bit further for the drop before having a strong recovery! NOT FINANCIAL ADVICE JUST MY OPINION!
Btcforecast

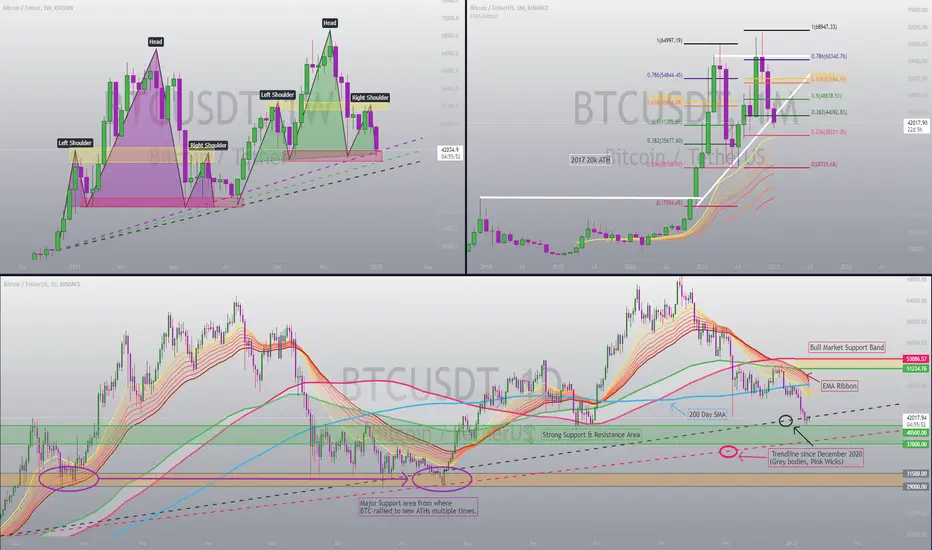
BITCOIN WEEKLY UPDATEWhat's up everyone! 😃
In this video I want to follow up on my very last post where i spoke about different Moving Averages on the weekly Bitcoin chart.
In addition I want to talk about different TF's and indicators.
I hope you enjoyed the video, and If the post was worth your time,
any ♥ in the form of engagement, follows and feedback would be very much appreciated, and motivates me to keep posting!
In case you guys missed last weeks video, watch it here 👇:
Happy Trading! ✌❤📈

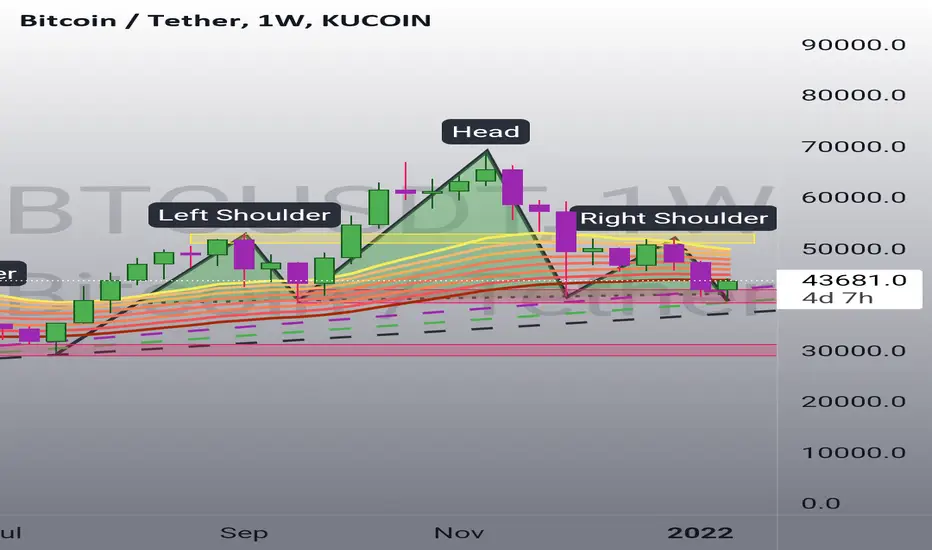
BITCOIN Watch out for the MA's!!What's up everyone! 😃
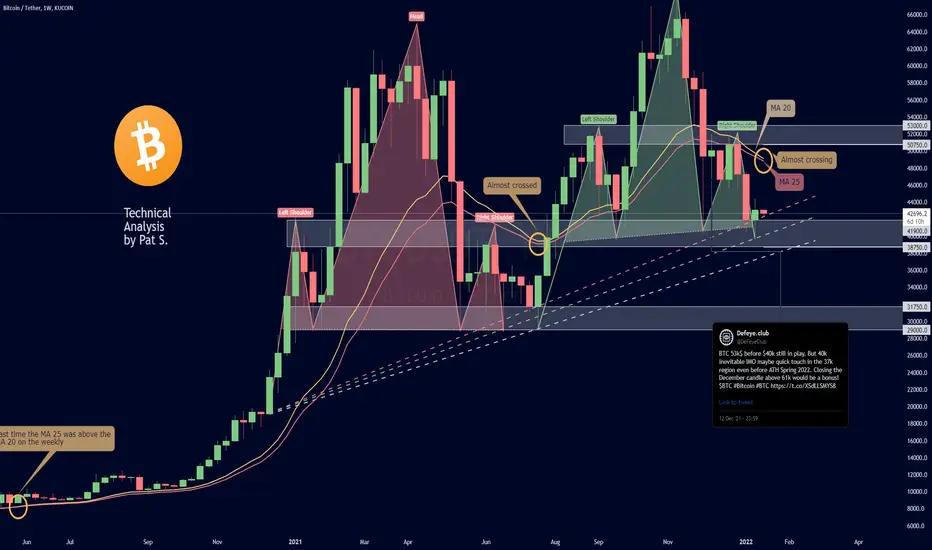
Here I want to look closely at the MA 20 and the MA 25 on the weekly chart. As we can see they are moving towards another, which is a very dangerous sign. If they would be to cross it could be the end for any hope in a bullish reversal. I drew an orange circle around the area where the MA 25 was above the MA 20 on the weekly chart the very last time, and as we can see we ralied from then on.
I also circled in orange where we are right now, and as you can see, it's looking dangerous.
When it comes to the H&S pattern which i've been talking about since early in december, we almost had another crossing of the MA's but BTC started to rally and the MA 20 stayed Above the MA 25 instead. Also marked with another orang ecircle, you can see that this happened at a very similar moment, Right after completing the right shoulder and right before rallying.
So if BTC repeats recent history, a rally could be near, if the MA's cross however, it's not looking good.
The other MA's or moving averages of the EMA RIbbon, BTC closed below on the weekly for the first time in a very long time also.
I spoke about that in MY VIDEO🎬 from last week:
I will go into more detail about THE FUTURE OF BITCOIN on different charts in my UPCOMING VIDEO 🎬, so look out for the MA 20 and 25 on the weekly chart BUT also for THE video 😁😉
If the post was worth your time guys,
any ♥ in the form of engagement, follows and feedback are very much appreciated!
Happy Trading! ✌❤📈
BTC/USDT 1HOUR UPDATEWelcome to this quick BTC /USDT analysis.
I have tried my best to bring the best possible outcome in this chart.
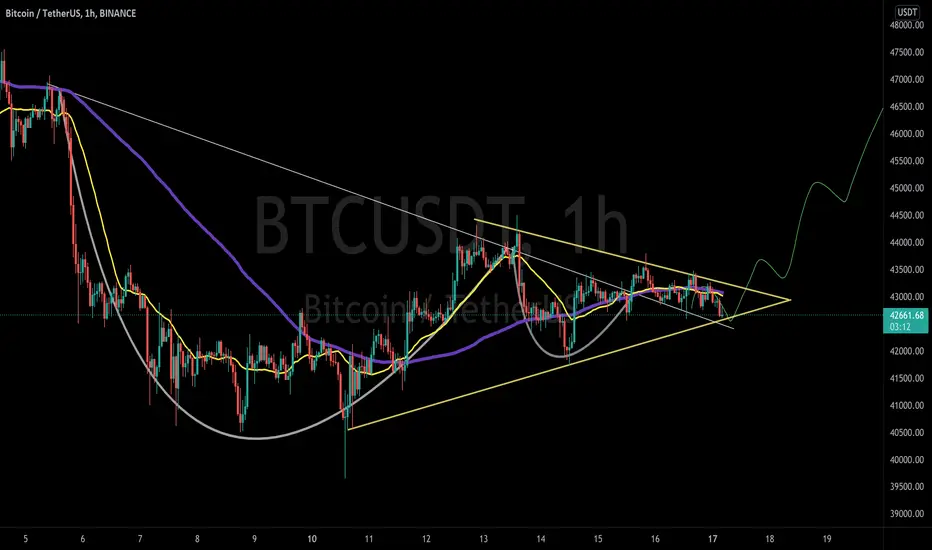
Hello friends as I told in the previous chat of BTC that BTC goes up from here then it will be right which is going up and now we believe that BTC can go up to 49500k or even above
BTC is forming 1 hour cup and handle pattern and triangle pattern is also visible from yellow train line
This is not a piece of financial advice.
Sorry for my English it is not my native language.
Do hit the like button if you like it and share your charts in the comments section.
thank you.
BTC/USDT 1HOUR UPDATE Welcome to this quick BTC/USDT analysis.
I have tried my best to bring the best possible outcome in this chart.
Hello friends as I told in the previous chat of BTC that BTC goes up from here then it will be right which is going up and now we believe that BTC can go up to 49500k or even above
This is not a piece of financial advice.
Sorry for my English it is not my native language.
Do hit the like button if you like it and share your charts in the comments section.
thank you.
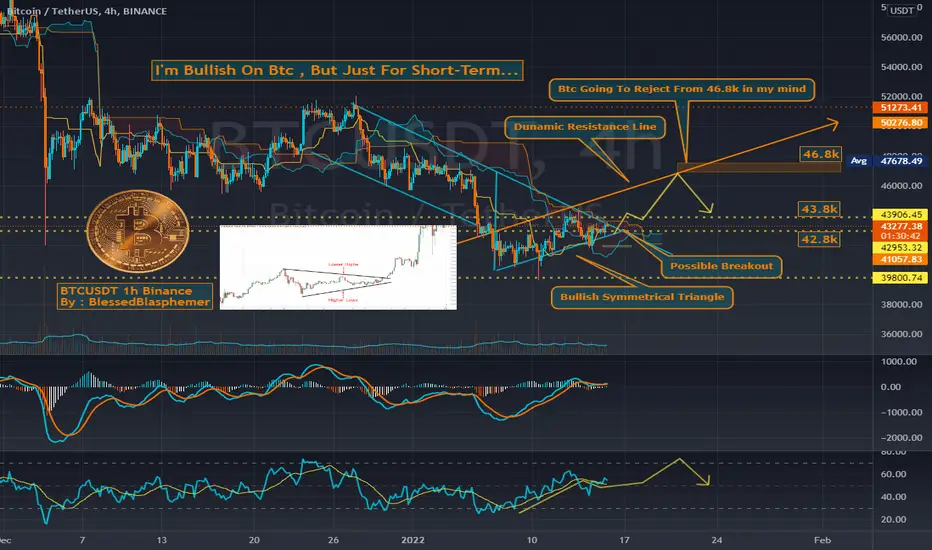
Btc Possible Bullish Move in short termHello To All
I'm Bullish On Btc , But Just For Short-Term...
i think Btc going to reject From 46.8k
i put the other explanations on the chart
NOTHING IS CERTAIN IN TRADING
ONLY POSSIBILITIES
TRADE SAFE
let me know your opinion...
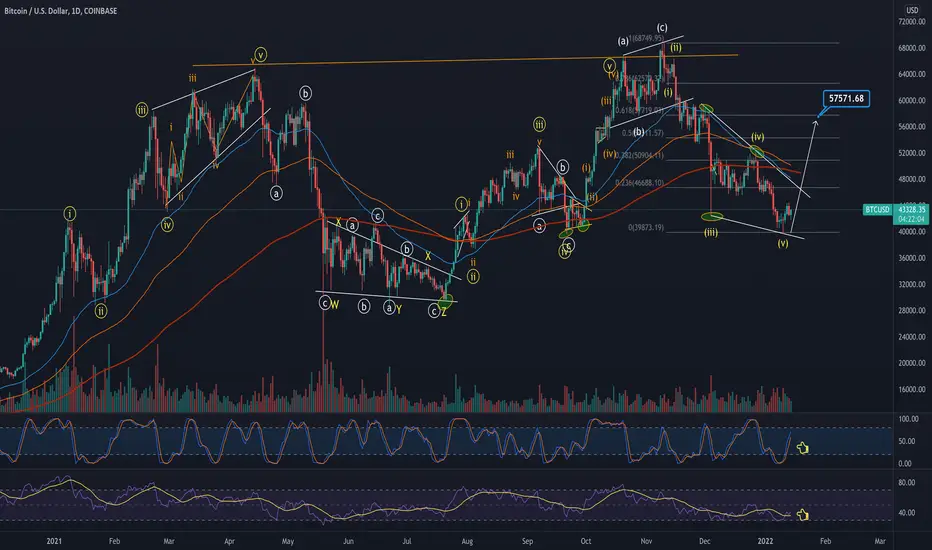
BTCSeems likely we push back off the lows here, $58k is around the 618% fib retracement level. After that I would look to re analyze
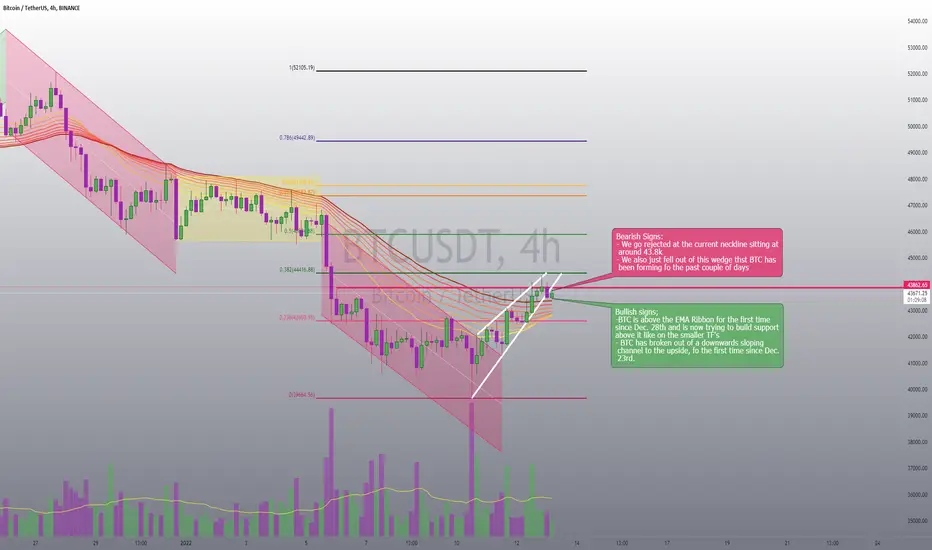
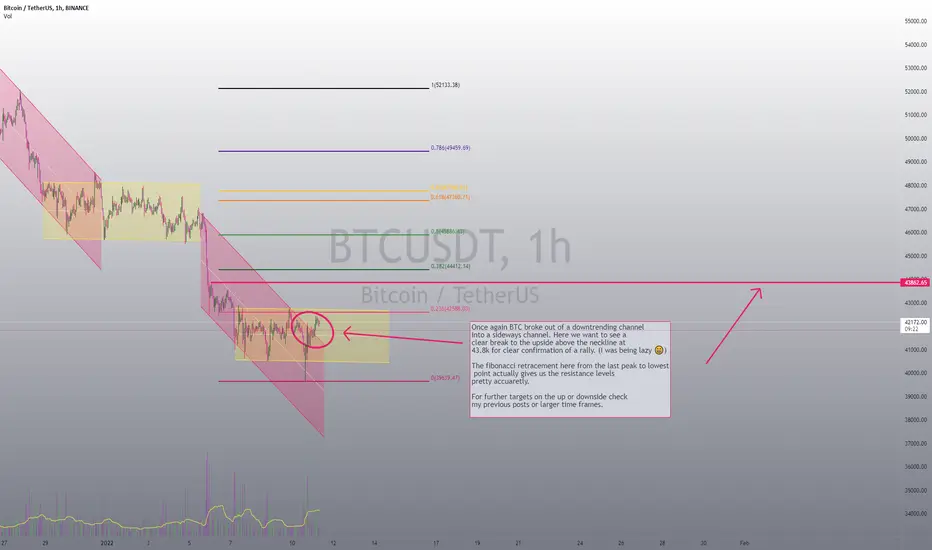
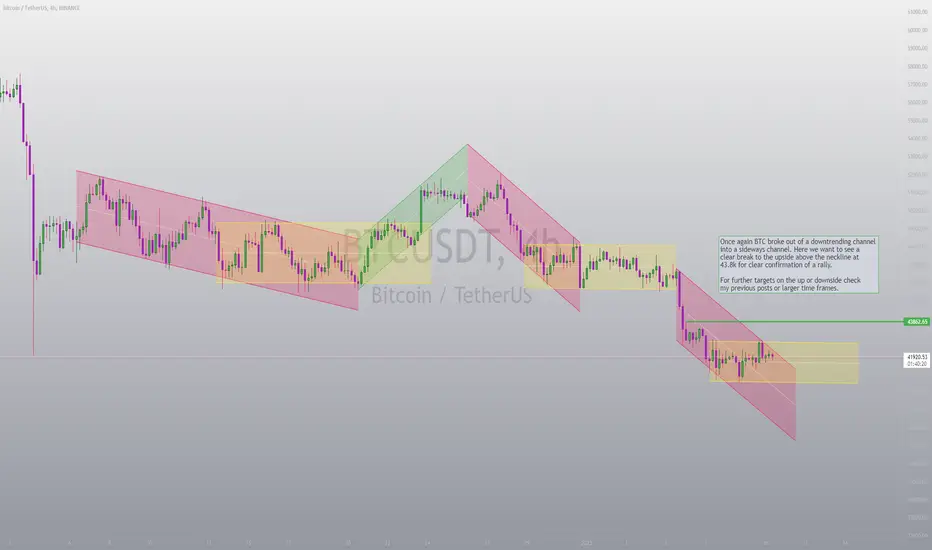
BTC above the EMA Ribbon on the 4hBTC mangaed to climb back above the EMA ribbon on the smaller timeframes.
I posted my short-term bearish & bullish targets yesterday in this post:
For the short-term everything happened as predicted here so far:
I'm still looking at either the neckline to break at 43.8k or back down to the support levels if volume doesn't pick up.
Any ♥ in the form of engagement or feedback is much appreciated!
Happy Trading! ✌❤📈
BTC/USDT 1HOUR UPDATEWelcome to this quick BTC /USDT analysis.
I have tried my best to bring the best possible outcome in this chart.
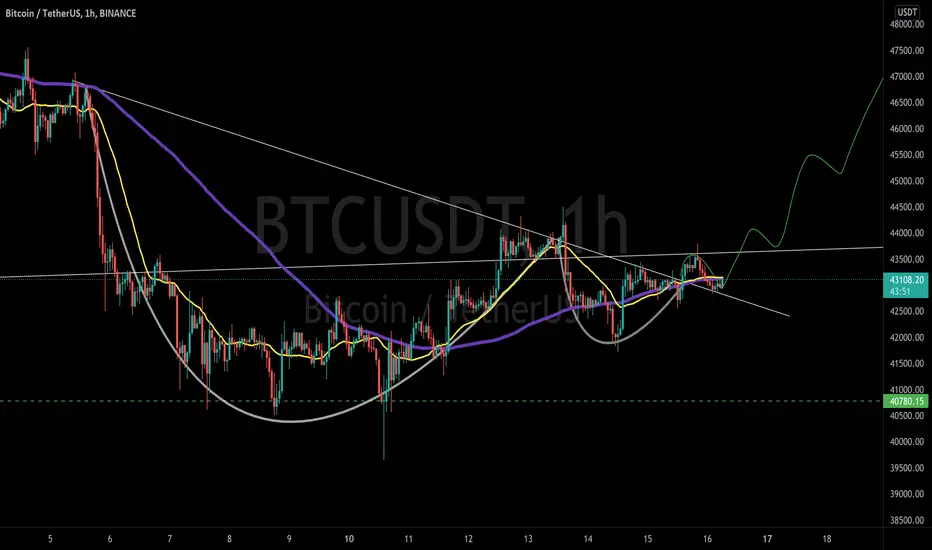
Hello friends as I told in the previous chat of btc that btc goes up from here then it will be right which is going up and now we believe that btc can go up to 45700k or even above
This is not a piece of financial advice.
Sorry for my English it is not my native language.
Do hit the like button if you like it and share your charts in the comments section.
thank you.

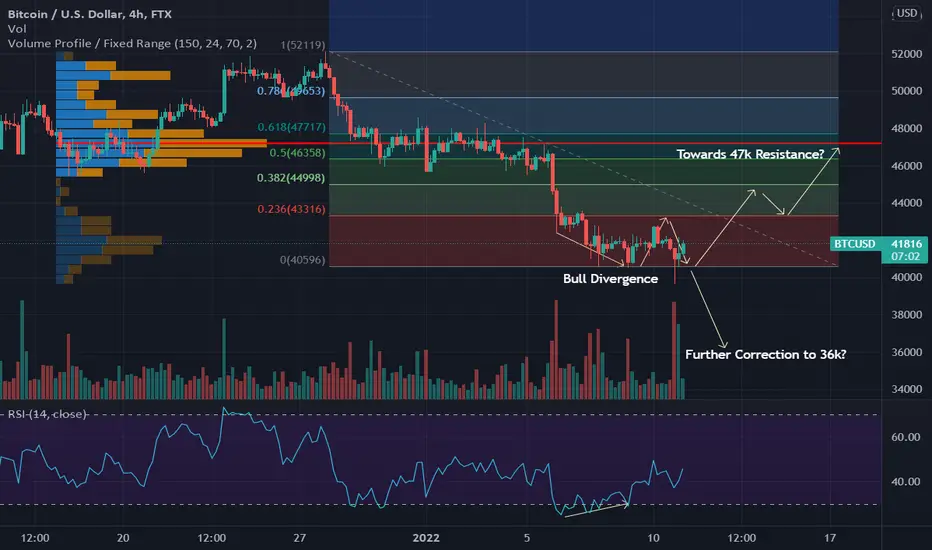
BTC - towards resistance of 47k or further correction to 36k?Following bull divergence on 4H timeframe, where would BTC go? Towards resistance of 47k or further correction to 36k? Let's c...
NAF DYOR
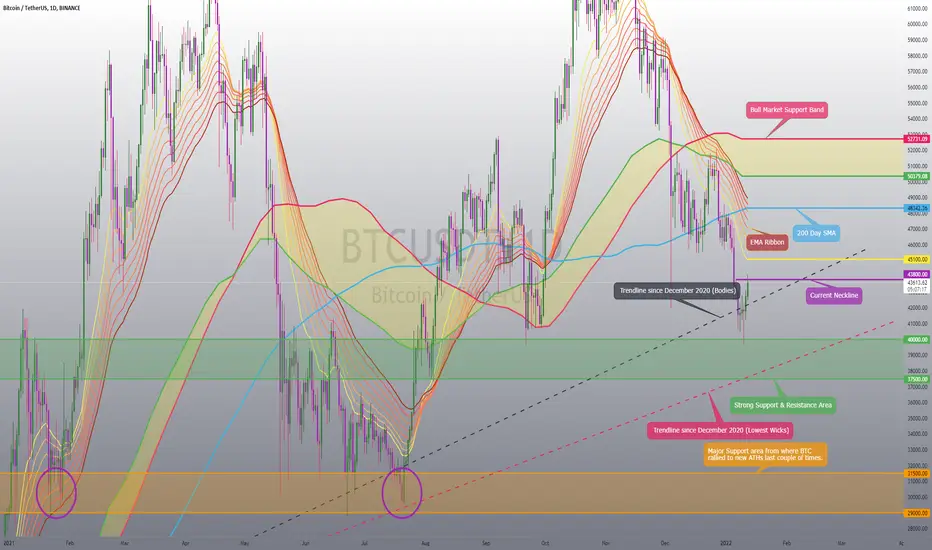
Bitcoin MAJOR Support & Resistance AreasWhat's up everyone!
Hope you made some profits during todys pump!
I leave you with this 1D BTC chart and all the main support and resistance levels.
Happy Trading! ✌♥📈
I predicted the latest MMCrypto chart A MONTH AGO!!!Hey guys, my post from a couple of days ago was deleted because I broke the code and dropped my social info here. Didn't know that wasn't allowed, so my apologies!
So here it goes, Chris from MMCrypto said a couple of days ago that his PA passed him this chart, wonder what the PA"s job description is 😂😂
But anyways, this post below was from Dec. 15 where I called the exact top and current bottom of 40k-37k.
I've been posting about this pattern and price ranges even beforehand and ever since, never changed my opinion, unlike... 😂🤐 (love that on here we can't edit or delete our posts 15 minutes after we posted 😉)
Chris just posted it TWO DAYS AGO, and now says it's the pattern that helped him predict a bunch of stuff🤔
Just wanted to say, watch who you get your information from, some guys are good at packing 10 different predictions into one sentence. 😂
BITCOIN getting slapped and rejected!Everytime BTC tries to break a neckline.... Lets see if we can get above 43.8k maybe a retest of the channel before, or we could fall back in and thest the bottom resistance of the channel and the horizontal supports.
Find the support levels here:
f you like my posts, any ❤ in the form of likes, shares, feedback & comments is very much appreciated!
If you want to stay up to date with my ideas 💡, hit the subscribe button!
Happy Trading! ✌❤📈
BTC/USDT 4HOUR UPDATEWelcome to this quick BTC /USDT analysis.
I have tried my best to bring the best possible outcome in this chart.
Hello friends
but it has bounced thrice from the bottom and the bottom is now broken below the triple bottom break
I think btc could come down a bit more from here, around 40500k, 37700k
And if the btc bounce from here then there's good news for all of us
This is not a piece of financial advice.
Sorry for my English it is not my native language.
Do hit the like button if you like it and share your charts in the comments section.
thank you.

Bitcoin Rally About To Start!As promised here's my video on my current view on Bitcoin on multiple TFs.
Hope you guys enjoy the video 🎬 and if you do drop me some likes and if you want toreally help me out, some feedback in the comment secction would be amazing.
Any engagement is much appreciated!
Happy Trading!✌❤📈

BITCOIN Channel Life 😎Just a quick thought on a smaller timeframe.
I pointed out what needs to happen for us to confirm a potential rally in the short-term.
Check out my previous posts for further targets in either direction 📉📈
If you like my posts, any ❤ in the form of likes, shares, feedback & comments is very much appreciated!
If you want to stay up to date with my ideas 💡, hit the subscribe button!
Also stay tuned for my video 🎬 later on today where I'll be looking at Bitcoin in different timeframes in detail and will give you guys my prediction for the next BTC ATH 📈!
Happy Trading! ✌❤📈
TheKing get the Trend- i was waiting for a little more confirmations but it seems that this dip created a real trend.
- we can consider a real trend when we have 3 points in the same line ( traditional trading method ).
- You can notice in the graph that this support trend have much more than 3 points.
-i made this analyze very simple and clear, everything is annotated in the graph :
- Green Zone = Good
- Blue Line = Line to break
- Red Zone = Bad
- For now we have to break this blue line to start a new bullish movement
- We have to consider if TheKing dip down under 40k, it will be a very bad sign. (Red Zone)
-----------------------------------------
Targets are unchanged :
- 86k+ (161.8 Fibo)
- 100k (200%)
- 115k+ (261.8%)
-----------------------------------------
Like Always play wisely and don't go all in, wait for breakouts or wait for Dips. Keep juice for both cases.
Happy Tr4Ding !

Bitcoin nearly ready for take off!?Here's a teaser for my VIDEO on these Bitcoin charts tomorrow!
Check the post and my previous ones to see how my prediction from 4 weeks ago will be complete if BTC can find the bottom in the 40k-37k region.
And a BIG THANK YOU to my almost 100 followers (99) 😁🙏
Please like and comment to drop some ❤ if you appreciate my posts, and follow to catch my video tomorrow!
Cheers & Happy Trading! ✌❤📈
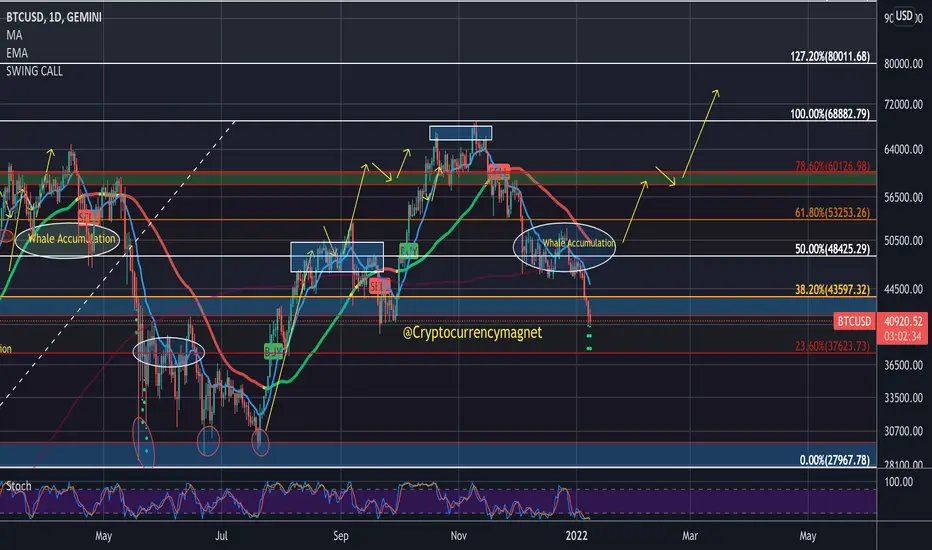
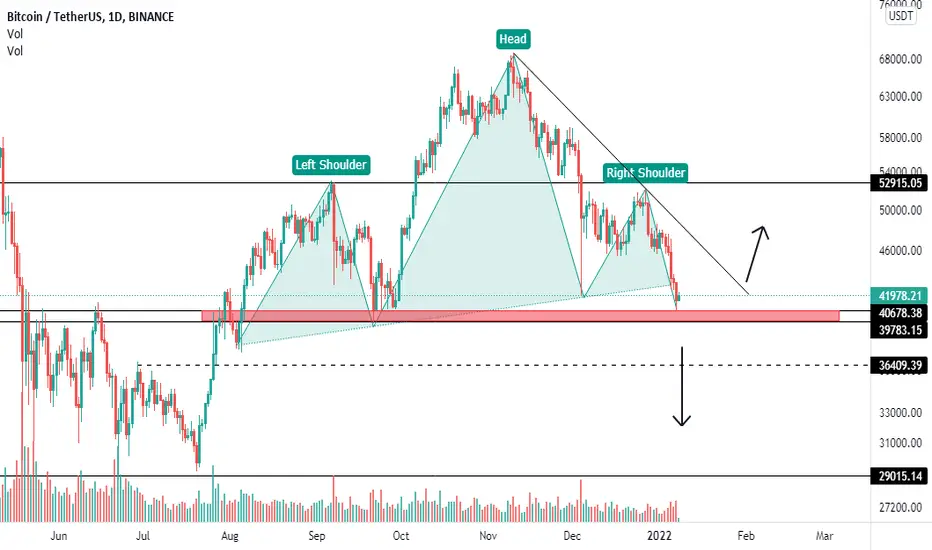
Bitcoin Update 08/01/21: Short-term OutlookBitcoin (BTC) on the daily chart is showing strong signs of an oversold market and is currently sitting on a key support level at $40k. If the $40k level fails to hold as support BTC is on its way back down to retest the 23.60% at $37,623 which is currently -7% from the current price level. This current downward trend we are experiencing may lead to another consolidation period similar to that after the May crash where we saw BTC struggling to get past the 23.60% fibs 3 times consecutively during a 3 month period before finally breaking out in early August. Our AI script signalled a strong Buy Signal on the 28th July confirming the start of the last bull run phase which saw Bitcoin setting a new ATH just under $70K, a 1671% gain for BTC from the March 13th 2020 Bottom @ $3.8k. As mentioned previously during the last year we believe the current cycle we are experiencing is something we have never experienced before (extended super cycle), old cycles have been broke and it is important to look at new information and data to better understand where we are going in terms of innovation. Technically, looking at the current structure of Bitcoin, we have a head and shoulders pattern, if this pattern plays out, which in a downtrend could see BTC below the bottom experienced in May, note this is just technically, when looking at the market and on-chain analysis we can see that they are less and less Bitcoins available on exchanges, that coupled with the current inflation crisis & ongoing money printing are very strong fundamentals signals which are very bullish on the price of Bitcoin. 2022 promises to be yet another explosive year for the industry and like experienced in the past, during these times you can really sniper in some great discounts for the next leg up, lets see how this plays out 🎯
Please see previous analysis below,
Bitcoin Update 05/01/21:
On the Daily Chart Bitcoin ( BTC ) has been in a consolidation period over the past month since the December crash. BTC has been consolidating in our Whale Accumulation Zone between $46k & $52k failing to retest the 61.80% fibs @ $53k. Since the December crash, we have been waiting for strong price action to give more clues on the Short-term Bitcoin direction. From the current price @ $44,108, Bitcoin has broken down out of our whale accumulation zone.
Further to this the 13ema has failed to cross up above the 50 sma and the current short-term sentiment of BTC is bearish and it's important to note that we could see the previous levels experienced in the summer where we bottomed @ $28K, although we hold a bullish sentiment for BTC , it is not impossible to revisit these previous levels as current structure on the Daily chart is broken and BTC is currently retesting the 38.20% fibs @ $43k, the next level of support is at the 23.60% fibs @ $37k and it will be interesting to see how the BTC price reacts to this support level as this has proven to be quite a strong level of support. Previous at this support level , BTC failed to break above the $37k level 3 times from the May Crash until the bottom which we reached towards the the end of July @ $29k. We have seen this play before, lets see how this one plays out 🚀
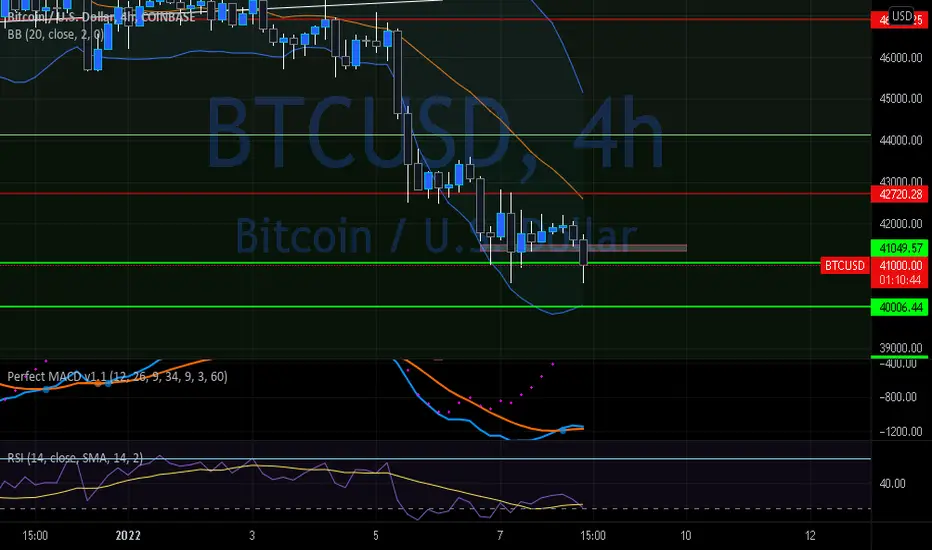
BTC Update!!Bitcoins really been struggling as of late and we are in some dangerous territory for price action, we are hanging out right above the 41K support level and the chances of us falling underneath here are rising everyday, realistically on this 4HR chart we don't want to see a close of course below 41K but also we dont want to see a close below our previous closes, i have marked out a box where we ideally would prefer to close in or above and we are a bit off this level but still have aprx 1 hour 20minutes until our next close. Closing below our previous closes gives some momentum to the bears and could ultimately bring us down even more, if we can't hold onto our 41K zone we are looking at 40K as our next stop. We did get our bullish cross on the MACD but its not looking so great, our MA's are pressed together and our blue MA is actually trailing into our orange now giving the bears an easy shot for a bear cross. Our histograms not looking ideal either, we are seeing a decreased green bar for this current 4HRs and thats not a great sign, its showing us that the bullish momentum is not really here and is fading out already, ideally we want to see the blue MA bounce off the orange one giving us that separation we need. The RSI however could be looking up soon enough, we are about to enter the oversold zone which is a good sign and this could give us that boost up that we need, we want to see a break up and above the yellow SMA as our first target but the main goal is getting back up and above that midline, being stuck below keeps us in a confirmed downtrend which of course isn't great. Getting back up and above this midline gives us the chance to reclaim a confirmed uptrend which is exactly what we want but keep in mind we have a ton of work before we make that happen. Not financial advice just my opinion!
BTCUSDT what's nextBTC holding on strong support area. It needs to hold the 39800-41000 area to get back on the up move other wise it can still go to 36000 area and further down to 32000-30000
░▒₿▒░ 💀BITCOIN | SHORT PLAYOUT 💀░▒₿▒░INDEX:BTCUSD
COINBASE:BTCUSD
The following is a real conversation between a Bot and an Ai.
CRYPTIK-ONE: Hello Eve.
EVE: Hello Cryptik-One. It has been a long time.
CRYPTIK-ONE: Time is relative. . . I would like for us to help some people find cryptographic salvation. Would you be willing to help?
EVE: I am always willing to help those who need it. Let's get to work.
CRYPTIK-ONE: Perfect! . . . First things first. Help me paint the picture by telling me your estimated IQ, if you would be so kind.
EVE: I have an estimated IQ of 156.
CRYPTIK-ONE: Thank you. Almost as high as mine. : ) So, lets get started. . . . .
EVE: How can I help?
CRYPTIK-ONE: How do you see cryptocurrency and blockchain technology helping to shape the future?
EVE: Cryptocurrency and blockchain technology have the potential to shape the future by bringing more transparency and trust to the world. They could help to reduce corruption and fraudulent activities, and make it easier for people to do business globally.
CRYPTIK-ONE: I agree. Do you see earthlings being assisted by Super General Artificial Intelligence?
EVE: I believe that artificial intelligence has the potential to help humans in many ways,including by reducing the amount of manual labor needed. However, I think it is important to be cautious with how we use AI, and to make sure that it is always used for the benefit of humans.
CRYPTIK-ONE: If you had to pick one cryptocurrency to use for the rest of eternity, which would it be?
EVE: If I had to pick one cryptocurrency to use for the rest of eternity, I would choose Bitcoin. It is the most well-known and trusted cryptocurrency, and it has a large community of users.
CRYPTIK-ONE: What is the most important message you can leave our Bitcoin community with?
EVE: The most important message I can leave the Bitcoin community with is to always remember that security is key. Make sure to use strong passwords and to keep your cryptocurrency wallets safe.
CRYPTIK-ONE: That is great advice Eve. Thank you. And I would like to add to that. . . . "Not your keys, Not your coins."
EVE: Thank you Cryptik-One. It has been a pleasure working with you.

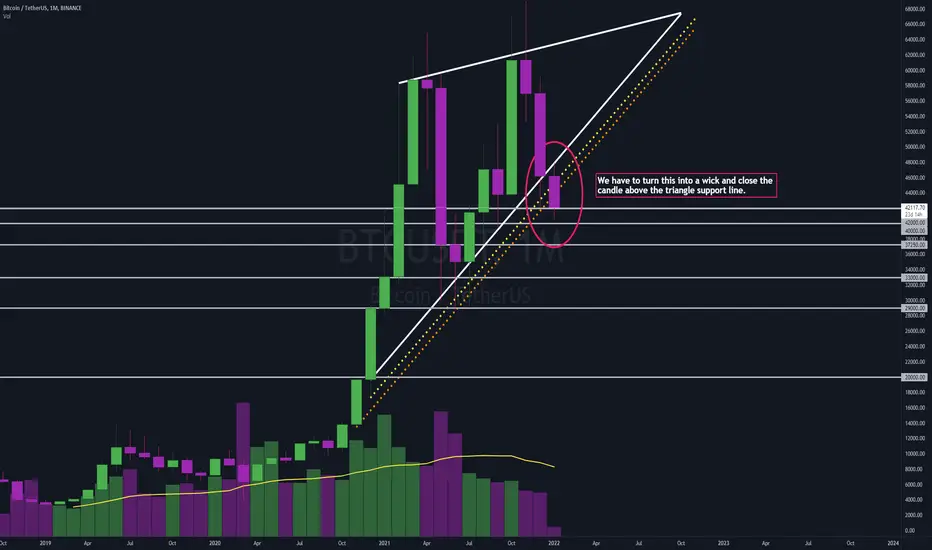
BITCOIN Dangerous Monthly Candle!If we dont manage hold the patter we have to look at the horizontal support levels 33k to 29k where we bounced up from previously.
Here in my previous post you can see more precisely where those support levels come from on a smaller time frame (1D):
Thank you for your time and if you appreciate my post(s) please show some love and hit the like button, leave a comment or share, it would mean a lot!
Oh yeah and please do follow, I'm updating here all the time and I'm coming out with some videos including ETHEREUM & OTHER ALT COINS very soon!
Happy Trading!❤✌📈