BTCUSD Long with 2 confluences
List of confluences: With more to form in the coming days.
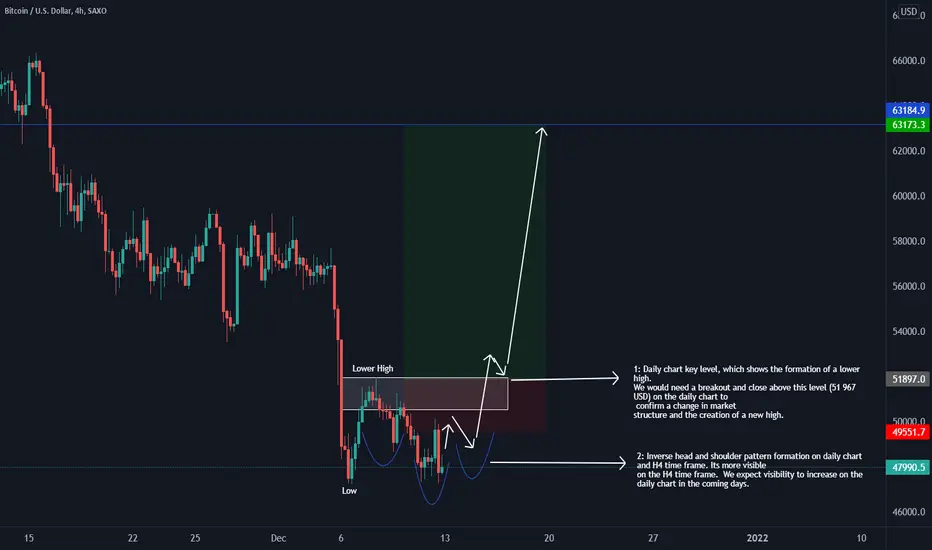
1: Daily chart key level, which shows the formation of a lower high. We would need a breakout and close above this level (51 967 USD) on the daily chart to confirm a change in market structure and the creation of a new high.
2: Inverse head and shoulder pattern formation on daily chart and H4 time frame. Its more visible on the H4 time frame. We expect visibility to increase on the daily chart in the coming days.
Summary:
When we look at the BTCUSD weekly chart, we can clearly see that BTC remains bullish. The manner in which price behaves in the next few weeks going into the new year will give an indication whether BTC is starting a bear market or remains bullish.
Moving onto the daily chart, the trend is over extended remains bearish. We can see some buyers trying to enter the market, with the creation a lower high formed around the 7 and 8 of December. This shows possibility of the trend turning bullish, which would be in line with the trend on the weekly chart, making for some explosive moves to the upside. The target would be in the region of 68 100 dollars. Targets are set using fibs. We only looking to trade about 60 - 65% of the move with a decent risk reward as there is higher probability of our target getting reached. We do not want to stay in trades too long as anything can happen at any time
Btcforecast
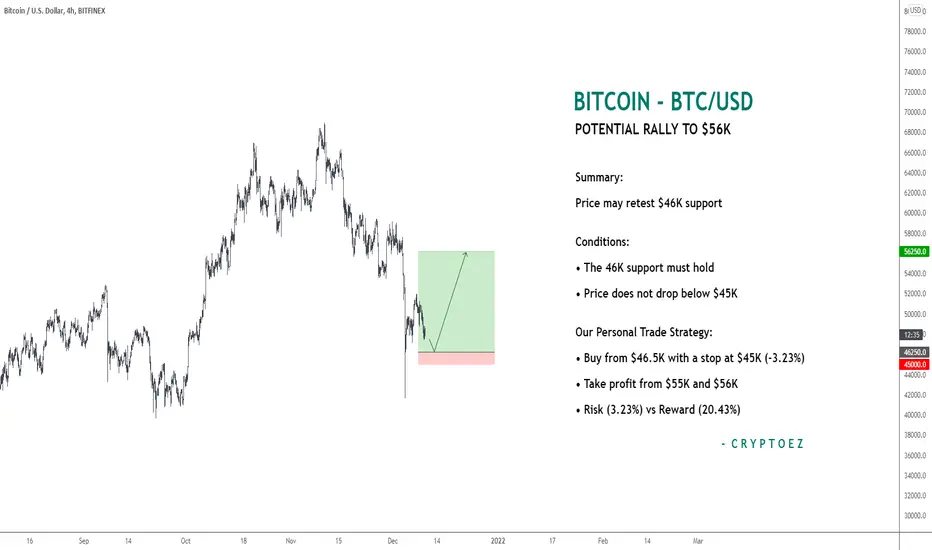
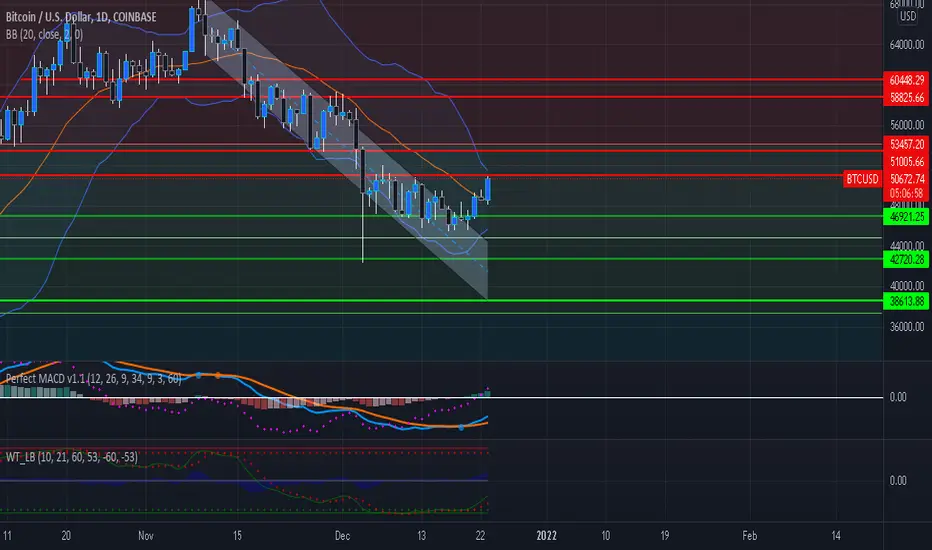
BITCOIN - Trade Opportunity with Good Risk vs RewardWe decide to openly share our personal trade strategy to show everyone how a good trade is made even in an uncertain market. That said, we want to remind everyone that no trade is without any risk, which is why we should only take trades where the reward is greater than the risk.
From a technical standpoint, the lack of money inflow may probably cause the BTC market to extend lower over the very short term. We also see that a support structure near $46K has been formed and therefore, if the market has sufficient buying interest to keep price afloat this price level long enough, then buyers are likely to reverse the short-term trend. A rebound from $46K would most likely retest the nearest resistance that has formed around $56.5K.
Given this reason, we decide to personally open a long position from $46.5K with a stop loss set at $45K. We plan to exit our long position from $55K and $56K with a profit ranging between 18% and 20%. However, if the price does not drop to our buy level or perhaps exceed our stop loss level, then we would skip the trade entirely or exit our trade with a small loss of 3.23%, respectively.
Please like and share this post if you find value in our personal trade. Thank you.
BTC/USDT 1DAY UPDATEWelcome to this quick BTC /USDT analysis.
I have tried my best to bring the best possible outcome in this chart.
Hello friends
BTC Weekly Candle Close & Bullish Signal BTC One Day Chart Analysis Bullish BTC once more 48500k close is a strength and from here btc will trend bullish from here to break its all-time high
Sorry for my English it is not my native language.
Do hit the like button if you like it and share your charts in the comments section.
thank you.

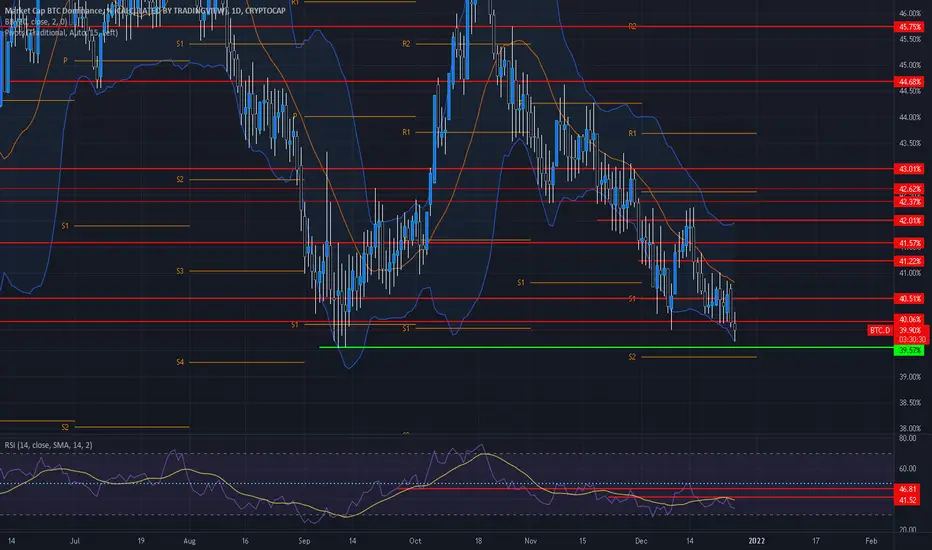
Altseason Almost Here!!!Taking a look at our bitcoin dominance and we have just recently broken right through that crucial 40% mark and that is a huge deal for the altcoins, realistically we should start seeing some explosive price movements going forward across the board. We definitely want to see our daily candle close below the 40% line as it would be very bearish and with that bullish for altcoins. A close here opens up the door for a breakdown to our first support at aprx 39.5% and then our S2 support which comes afterthat, either way any price action going forward that continues to drop is very positive for the alts! The bottom band on the bollingers as you can see is just below us we actually wicked onto it, the door is open for us to grab onto here and to see a big fall in domiance, historically closing ontop of this bottom band leads to explosive bearish price action just like we want! The RSI is getting crushed fairly badly and thats another great sign going forward, the RSI getting stuck below the midline signals we are in a confirmed downtrend which of course is positive for the altcoins. The interesting thing here though, is that we have tons of heavy resistance above us and it appears they are going to be pretty tough to breakthrough, we have the SMA which we are now below(BEARISH) and then we have two overhanging heavy lines of resistance that will take quite some time to break i personally think! Overall looking very good for the altcoins and if we see this trend continue moving forward we could be leaping right into altseason where i expect to see some explosive massive gains! Not financial advice just my opinion!
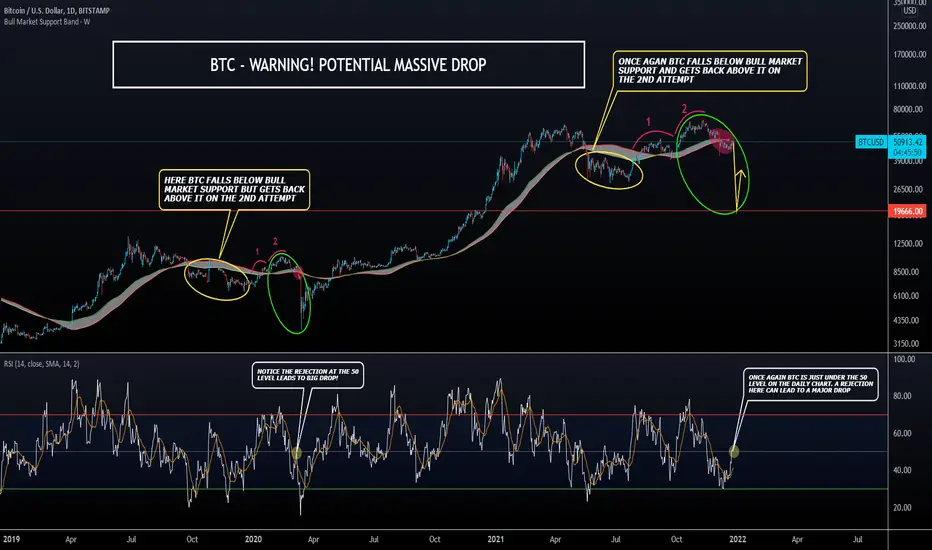
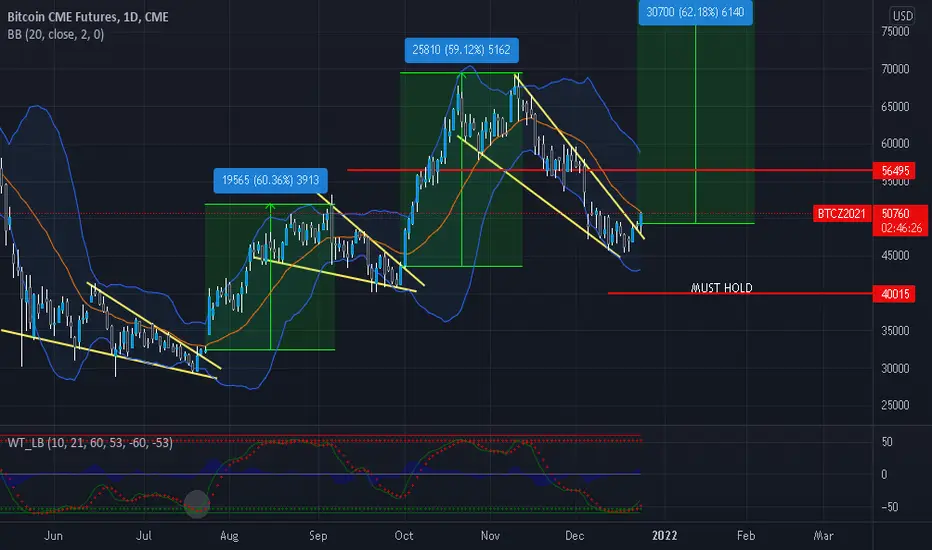
BTC - WARNING! POTENTIAL DROP TO 20K Hello everyone. MERRY CHRISTMAS! HAPPY HOLIDAYS! and I have a chart for you guys. I hope this helps people and stops people from losing money. I had mentioned in a previous chart that if BTC falls below 48K (which it did) I would
turn very BEARISH! I had a very good reason for that, and that is because BTC fell below the bull market support band (21W EMA + 20W SMA). BTC IS STILL BELOW this support band and I DO EXPECT MAJOR RESISTANCE HERE and I DO THINK bears are very powerful here and are setting up a NASTY BULL TRAP. DON'T BE A VICTIM. Lets look at the indicators on the chart.
There are MANY MANY youtubers, and other people on social media saying "the bottom is in" and all that good stuff. Everyone points to how it is technically a HIGHER LOW but EVERYONE IS FAILING TO REALIZE THAT BTC FELL BELOW THE BULL MARKET SUPPORT LEVELS. Don't get me wrong, IT DOES look like a bottom however there is SO MUCH RESISTANCE ahead and UNLESS there's some MAJOR CATALYST WHICH BLASTS BTC ABOVE 60K again, then I don't think bulls have enough strength here.
The chart is pretty much self explanatory. Notice how on MARCH 8TH 2020, BTC dropped below the bull market support band (BMSB). It is very similar to the recent DECEMBER 4TH drop! It even played out a similar pattern (shown in the YELLOW OVALS) before jumping back above the BMSB.
Now look at the GREEN OVALS... This is where BTC starts its downtrend. You can see previously BTC fell below the BMSB yet again, then attempted to jump back above BUT GOT REJECTED RESULTING IN A MAJOR DROP! On the RSI, you can see that rejection happened at the 50 level.
BTC IS IN A SIMILAR SITUATION RIGHT NOW! It has fallen below the BMSB and is currently trying to get back above it. NOTICE THAT BTC IS IN A VERY DANGEROUS POSITION ON THE DAILY RSI RIGHT NOW! It is at the 50 level!
Nothing is certain however I do believe in wyckoffian logic and it makes perfect sense here. The "composite man" has SO MANY people right where he wants them! Everyone is distracted. BTC put in a "higher low" so everyone feels comfortable buying in... Like I said, this could end up being a NASTY BULL TRAP! Either way I made this chart just so you can be prepared and understand that a 20K BITCOIN IS ABSOLUTELY STILL IN THE CARDS and very possible!
There are other indications that are in line with this idea! The daily and weekly RSI shows the DECEMBER 4TH drop as a "LOWER LOW" and NOT a "higher low" reflected by price action. This creates BEARISH DIVERGENCE on the RSI. Also BTC could possibly form a very BIG head and shoulders pattern here very soon which would have very low targets depending on how you position the neckline. The Weekly MACD crossed down and looks pretty bad IMO.
This is also in line with my previous BTC chart which I'll leave a link to so you can see even more evidence that a 20K BTC is VERY MUCH POSSIBLE.
Well that's what I have today. Hope everyone is well. I WISH YOU ALL A MERRY CHRISTMAS, and HAPPY HOLIDAYS.
Take Care.
* This is NOT financial advice. This is just an idea based off my experience. Please do your own research before investing or trading.*
BTC/USD: A Christmas Weekend Study FUNDAMENTAL BACK-DROP
*Imho, if there was ever a time to expect fireworks, it's right now.
*Weekend trading session for the next ~2 days. Institutions and majority of players are offline for Christmas day and/or weekend. Perfect environment for fuckery.
*US holidays, and Christmas in particular, are proven to be powerful market events. (Often see pivots in price/sentiment through these windows).
*"Buy when it snows, sell when it goes." - it's that time of year!
**Recent CME event (listing ETH micro futures ) on Dec. 6
**Positive reaction from most recent FOMC meeting on Dec. 15
**Recent full moon phase change on Dec. 20
LOWER-TIME-FRAME TECHNICAL ANALYSIS
*Structurally, price is trading within a megaphone pattern (making higher highs and lower lows). This implies high volatility in both directions until the megaphone is resolved.
*Certainly trading against some key highs right now (top end of the range). In good shorting/selling location right now for people who think this rally into Christmas is bulslhit.
HIGHER-TIME-FRAME TECHNICAL CONTEXT
*Price is coming awfully close to triggering a major double bottom , drawn off the 1D chart. (The counter-trend rally high following Dec. 4 liquidation cascade).
*$51,995 is the level to watch. I'm officially "uber-bull" if we start closing above this level.
*Bullish momentum divergence confirmed ( MACD ) and continuing to build on the 1D chart.
--
LIKE THE ANALYSIS?
Send me a DM . I'd like to build a community of half decent traders and technicians.

BTC CME FUTURES FALLING WEDGE PLAYING OUT!!!Bitcoin has had a beautiful breakout to the upside of this falling wedge i was talking about last time, previously we saw 2 other falling wedges with the exact same setup as we currently have, a breakout to the upside of these wedges lead to some serious price action of about 60% gains. Due to the market correcting pretty heavily over the past month i expect this falling wedge to play out the same as the previous ones, could be a little conservative on this price predicition but i think the 80K mark is very doable by the end of this pattern playing out. a big confirmation that we need is a push up and above the midline on the bollinger bands with a daily close above, aswell as a daily close above of this wedge but thats looking like its going to happen today regardless. Looking at our last run up we saw a big climb up the top band on the BB's and thats exactly what im thinking is going to happen once we move further up, a break of the midline opens the door for that climb up! A look at our wavetrend we have bottomed out in the buy zone and check out the last time we had a bottom out at this level, right before we had the first run up from the falling wedge the wavetrend bottomed out and we haven't seen that since until now! We are getting a nice curved reversal and keep and mind that this indicator makes smooth transitions rather than jagged reversals and judging just off the recent bottom we had and the beautiful reversal we are currently seeing i think we are due for a masssive run to the upside! Not financial advice just my opinion!
BTC Ready To Move Up!Bitcoin has been moving pretty nicely the past few days, we are pushing up and above the midline on the bollinger bands and its looking like we are gonna get a for sure close above here which is a bullish sign and we are approaching the 51K level, if we can get a push up and above here and get a daily close at some point we are going to be really looking good! Another great thing if we closed up and above the 51K is that we would end up directly ontop of that top band on the bollinger bands, this i personally think will spark a massive run to the upside and bring us some much needed momentum. on the MACD we just recently had a bullish cross and we are looking great, seeing growing separation which is perfect, it lessens the chance of us having a near term bearish cross and also gives us some breathing room, what i mean by that is we can afford to have a down day or two without triggering a bearish cross. the wavetrend has seemed to bottom out in the buy zone and we are now starting the push back upwards, due to us being way down in the buy zone for quite awhile i think its pretty likely we are going to see very bullish wave going forward, likely an extended bullish wave before resetting with a small dip, on everything we got a ton of room to move to the upside and i think we are getting set for our next leg up in this bullrun! Not financial advice just my opinion!
BTC/USDT 4HOUR UPDATEWelcome to this quick BTC /USDT analysis.
I have tried my best to bring the best possible outcome in this chart.
Hello friends.
btc update told in the previous chart it could jump from $46000 to $49500 as it happened now I think btc will test again on 21ma from here to $47500 and from here btc from 58k to 65k again Could jump to 85k, take new all-time high
Thank you
Sorry for my English it is not my native language.
Do hit the like button if you like it and share your charts in the comments section.
thank you.

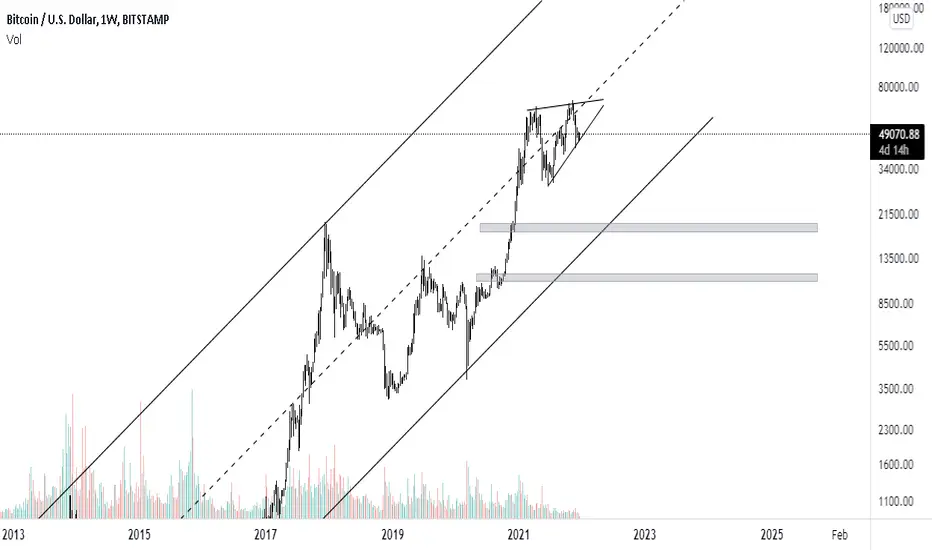
BTC: Probably the bearish market is not finishedThe BTC is in it's sixth main touch with the 8 year ascending channel. As we can see on the chart, the price is reacting intensely to the midline of the channel. Also, from my point of view, the market can form an ending structure. There is a less chance that the BTC can reach the upper edge of the channel, therefore, the descending path may be inevitable!
Good luck!
Bitcoin nearly reached trend line. Will it break it this time? Bitcoin nearly reached the trend line. Will it break it this time? Or False break out will happen?

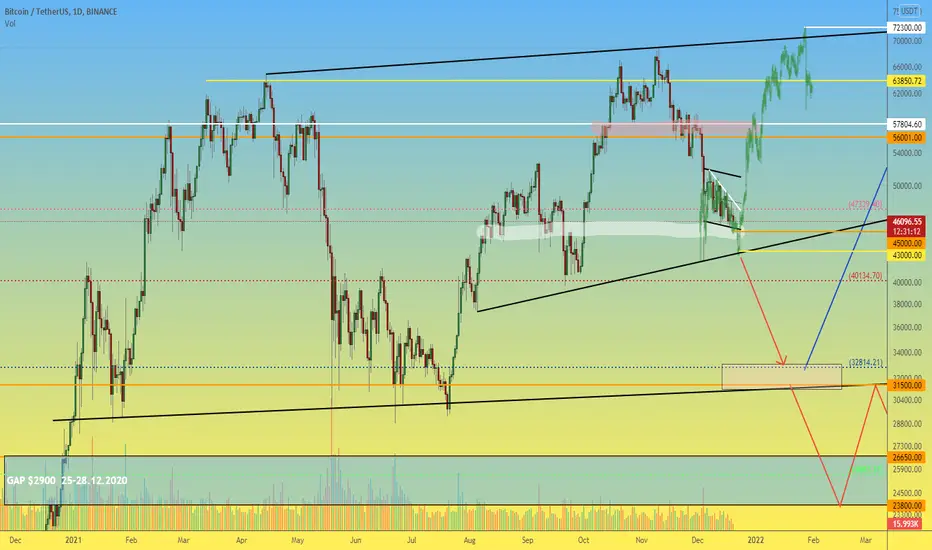
BTCUSDT 1D When can and should go long?A lot of inquiries came from you about what's going on with Bitcoin and altcoins right now? , so we'll write a few words with our thoughts and try to answer them.
Constructive dialogue is also welcome in the comments under the idea.
This idea will be a complement to our recent BTCUSDT idea with the title: "This is what it takes to start the alt season"
So, this idea is on, only a few remarks to it will be written below:
1. Sellers may try to hit the stops below $45300 today, but at all $45000 is a good wall to buy.
2. If they break $45000 down, the price of BTCUSD may fall to $43000 on torn down stops, but without updating the previous low below $42000.
In such a situation, the green fractal may begin to work out, and with it the minimal, but still the alt-season will begin.
3. Below $42000 there will be a lot of negativity, and consequently the targets for the fall in the area of $32000. More detailed thoughts on this scenario are described in the idea below:
To sum it up: today/tomorrow, you have to be extremely careful watching the price behavior near the critical levels we mentioned above to make the right trading
_______________________________
Since 2016 , we have been analyzing and trading the cryptocurrency market.
We transform our knowledge, trading moods and experience into ideas. Each "like under the idea" boosts the level of our happiness by 0.05%. If we help you to be calmer and richer — help us to be happier :)
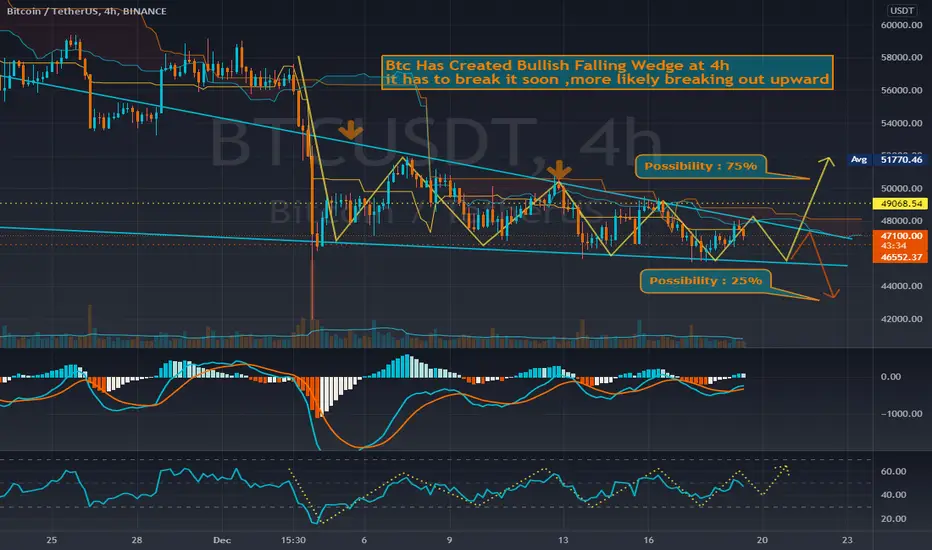
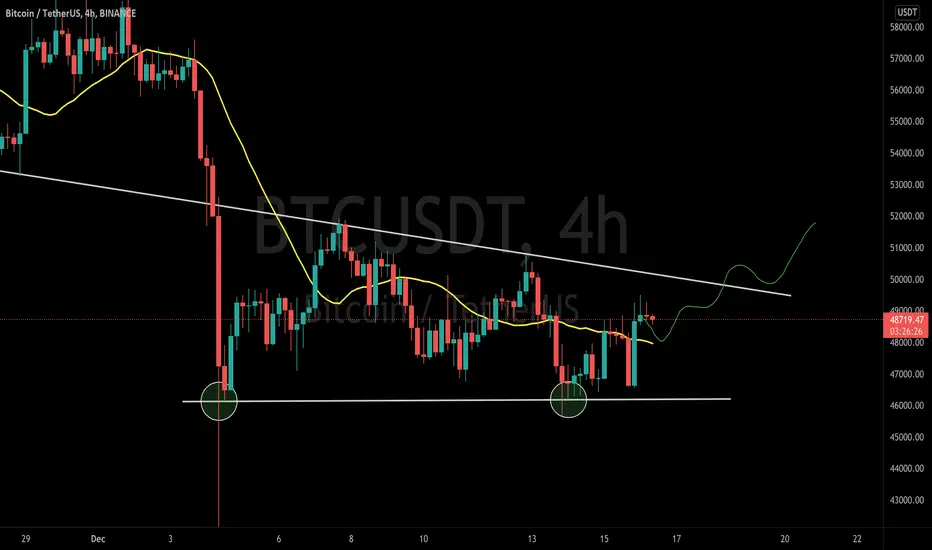
Btc Has Created Bullish Falling Wedge at 4hHello Friends
Btc Has Created Bullish Falling Wedge at 4h
it has to break it soon ,more likely breaking out upward
as we got a monday morning ahead i think the possibility of breaking above is very higher.
NOT A COMMERCIAL ADVUCE
TRADE SAFE ON YOUR OWN RESPONSIBILITY
BTC/USDT 4HOUR UPDATEWelcome to this quick BTC /USDT analysis.
I have tried my best to bring the best possible outcome in this chart.
Hello friends..
BTC update told in the previous chat it can bounce from 46k to 49500 as it happened now i think btc can come to 48000 from here to test again on 21ma which is back a 50k then 51k
Thank You
Sorry for my English it is not my native language.
Do hit the like button if you like it and share your charts in the comments section.
thank you.
BTC CME FUTURES FALLING WEDGE PATTERNS!Taking a look at our Futures for BTC i have noticed something very very similar, a continues set of falling wedges where once we breakout to the upside its explosive and can lead to huge gains. Basically this TA in my opinion shows us how valid the "bullrun" still is, and as ive said before and ill say again, i personally think we are still in a strong bull market, my thoughts are that this recent crash has been a big shakeout putting fear into retail investors and making them doubt about still being in a bullrun, another thought is that exchanges, whales, big money are liquidating overleveraged longs across the board. Lastly in the background i believe there has been massive accumulation going on coming from big money and strong hands, you can see it very clearly on Ethereum, we had a 3 week period of sideways movement and usually the case with that is accumulation and buying going on. Some really key support levels are the S2 at aprx 44.5K, 42-41K and finally the crucial support level of 40K, i would say anything above 40K we are still in a strong bullrun, but i breakdown and a good bit below 40K i would start getting a little worried and where personally i would start to think the bullruns coming to an end. Some key resistance levels are 50K and 51K which we are currently facing right now, ideally we want to break up above and close a couple days above here, the top of the falling wedge is also key too and something we need to breakout of to ignite another massive run. Each time we saw this bullish falling wedge pattern with a upside breakout we saw aprx a 60% move to the upside without much trouble at all, now if we give our current falling wedge the same price increase off of the breakout we are looking at 80K, which is a very doable target i would say, never underestimate the momentum in a bullrun and certainly don't underestimate the power of FOMO, something that drove a good portion of the 2017-18 bullrun. Heres a good example or scenario that is very realistic, say due to this massive shakeout/correction tons and tons of weak hands and newer crypto investors sold thinking maybe this was the end of the cycle, now think about if we started to see a breakout and gaining massive momentum, they are going to get really emotional and feel like they are loosing out, in turn most or all of them jump back into the market at a rapid pace hoping to regain some of the money they may have lost. Then aswell as people who have been on the fence for crypto investing, they see that we are making some massive moves and they also don't want to miss the boat so they all start hopping in! Sounds like a recipe for a huge momentum run and the possibility of a blowoff top! Not financial advice just my opinion!

Bitcoin, i will buy it after clear signal in Footprint. Bitcoin, i will buy it after clear signal in Footprint.
I hope u know what's DOM and footprint
