#Bitcoin Revival, Will BTC Rise above $40.5k?Past Performance of Bitcoin
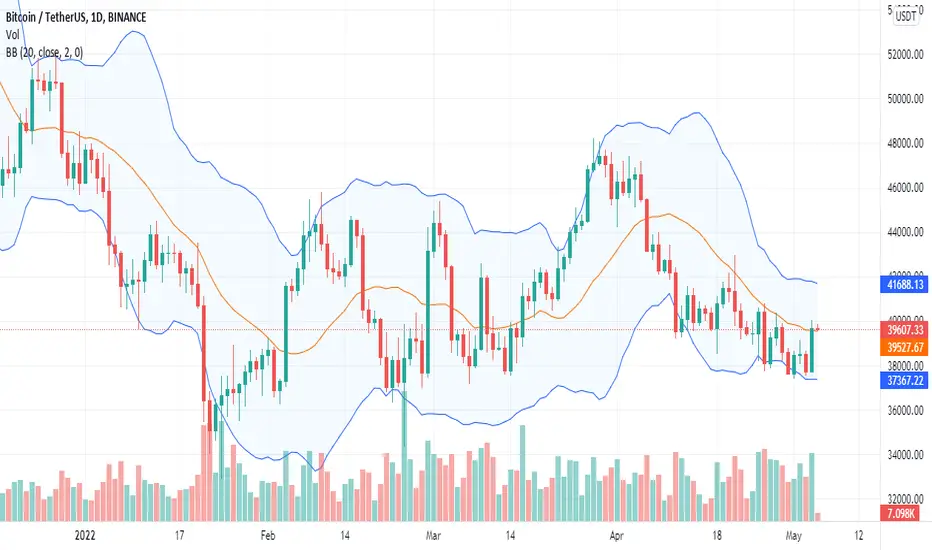
The BTC price is rebounding, lifting the crypto market from the recent doldrums. When writing, BTC prices are relatively steady, in line with the recent gains as buyers appear to be preparing for a leg up. Even despite stable prices and what seems to be renewed confidence, Bitcoin remains in a trading range below the $40.5k resistance level.
#Bitcoin Technical Analysis
Buyers seem to be sizing up as per the development in the daily chart. If buyers take over, BTC would easily expand to $45k in a refreshing expansion. However, the path of least resistance is still southward. This forecast holds even with the bullish engulfing bar of May 4, pushing prices from around the immediate sell trigger at $37.3k. As BTCUSDT remains in a trading range, traders can wait for clear breakouts above $40.5k or $37.3k before committing.
What to Expect from #BTC?
Sellers are still dominant in a bear breakout formation. The sell trigger is at $37.3k—flashing with last week's lows. A dump below this mark could dash bulls' hope, possibly setting the trend for another leg down towards Q1 2022 lows.
Resistance level to watch out for: $40.5k
Support level to watch out for: $37.3k
Disclaimer: Opinions expressed are not investment advice. Do your research.
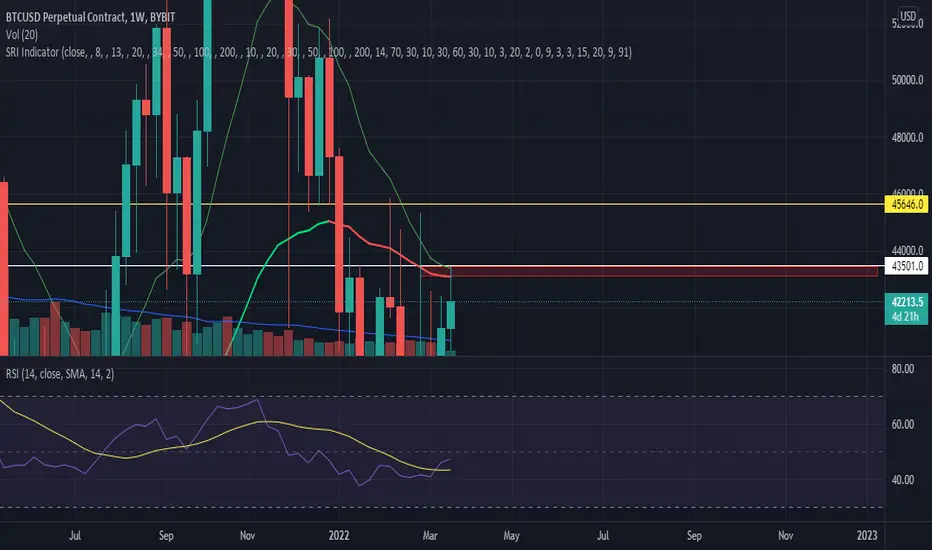
Btcprice
BTC 400% MOVE INCOMING!- As you can see previously BTC consolidated for a while, before it broke out and went up by 450% if the same move occurs we will could see a $320,000 BITCIOIN!
- Short term we could see BTC touch back to $32,000 and then a massive rally to the upside, then when all the whales start to sell their BTC, A LOT of money will flow back into ALTCOINS!
- NOT FINANCIAL ADVICE!
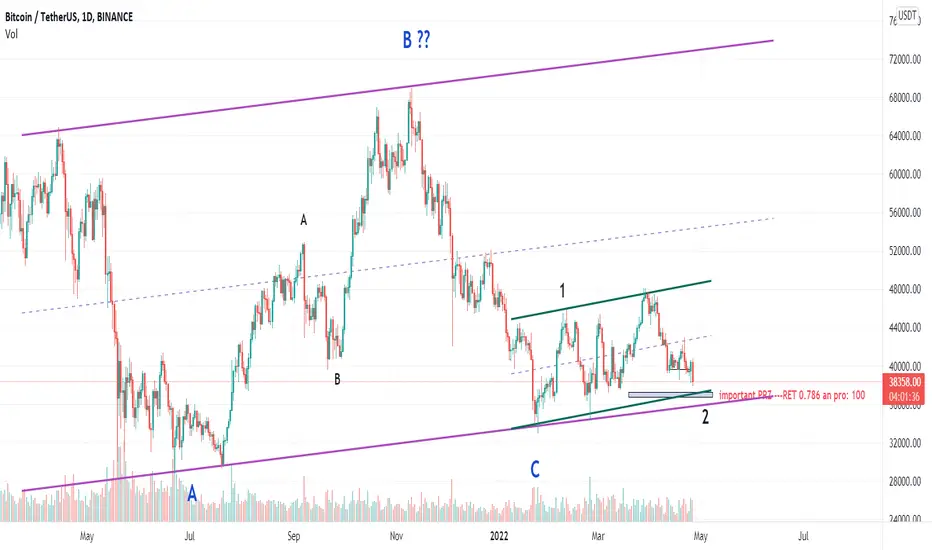
Bitcoin BTC daily we have important PRZ for btc, this is my idea for Bitcoin, if we lost this area, i can see bad senarios
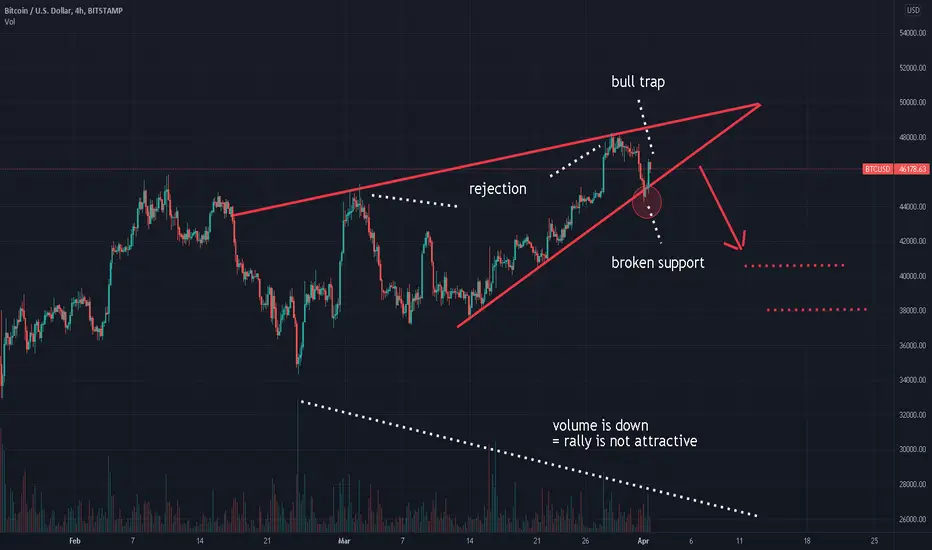
Rising Wedge and Bull Trap on Bitcoin chartRising Wedge pattern on Bitcoin chart.
While price was going up, volume was going down.
So, price action could be printing a bull trap.
The support already broke down once in the Asian session.
You might open a short position.
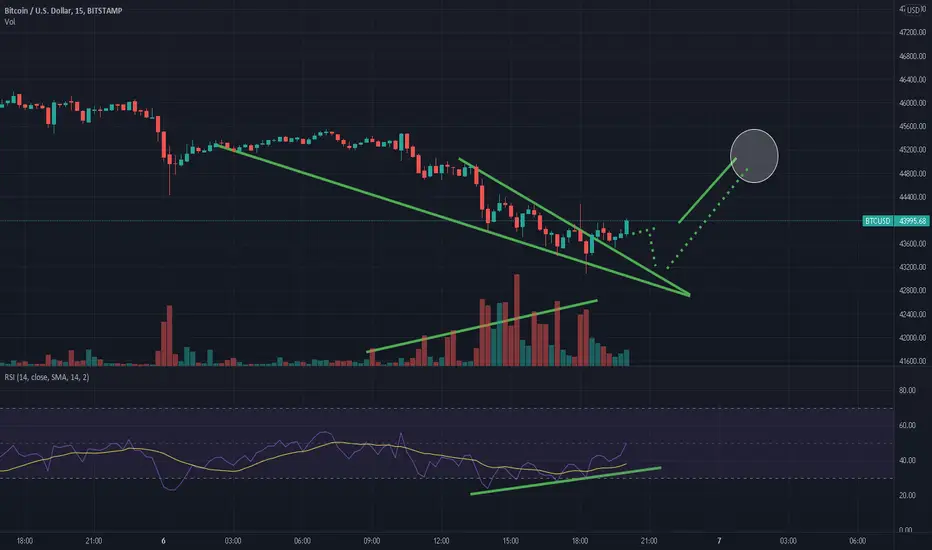
Scalp long on Bitcoin chart.RSI makes higher lows.
Volume rises.
Bullish wedge chart pattern.
AI thinks people bought the dip.
Long is worth a shot.
(Now that our shorts are in profit already :))
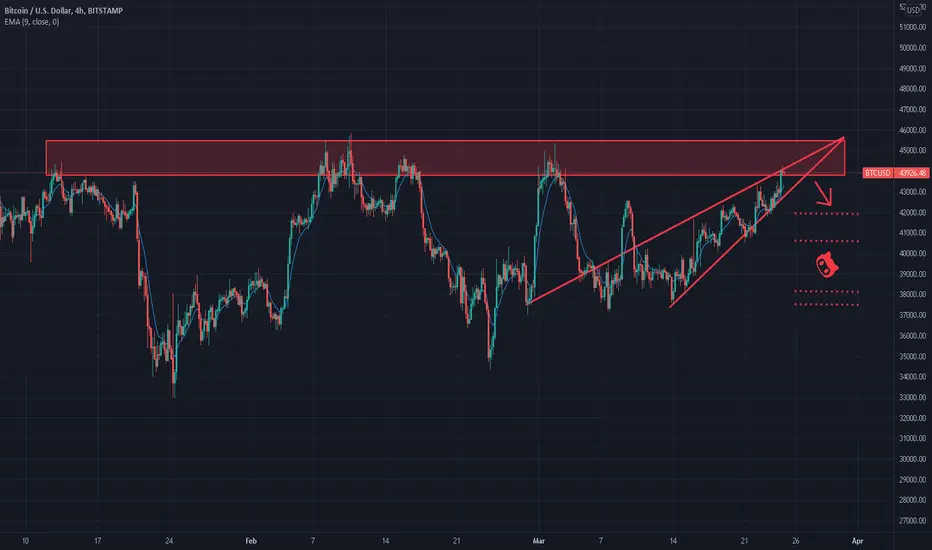
Zone Resistance Bitcoin ShortZone Resistance on Bitcoin chart.
Deep learning recommends short position.
1st Target $41k.
This idea is 100% compatible with our previous wedge idea.
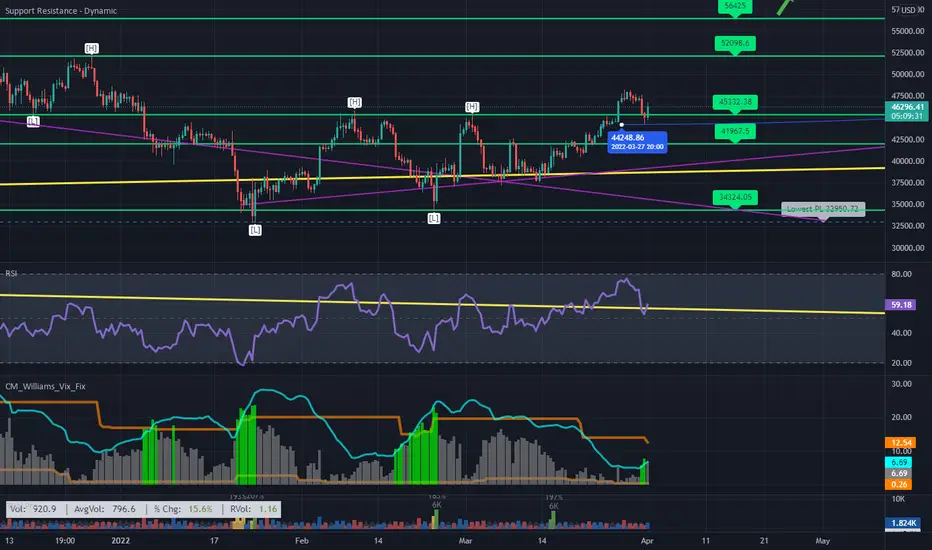
$BTC Bullish after potential breakout and re-testBTC Successfully retested its previously broken trendline on the 12H timeframe. I expect BTC to try for 52K to 55K within a matter of weeks. Powerful reversal bar touching the now broken trendline is bullish IMO.
Both RSI and CM William Vix indicate potential reversals in the market near support zones serving as a signal for potential predicting a market continuation or reversal
*Disclaimer - I do not own or trade BTC personally. I do trade BTC related stocks and alt-coins. This is only my opinion based on technicals I see.
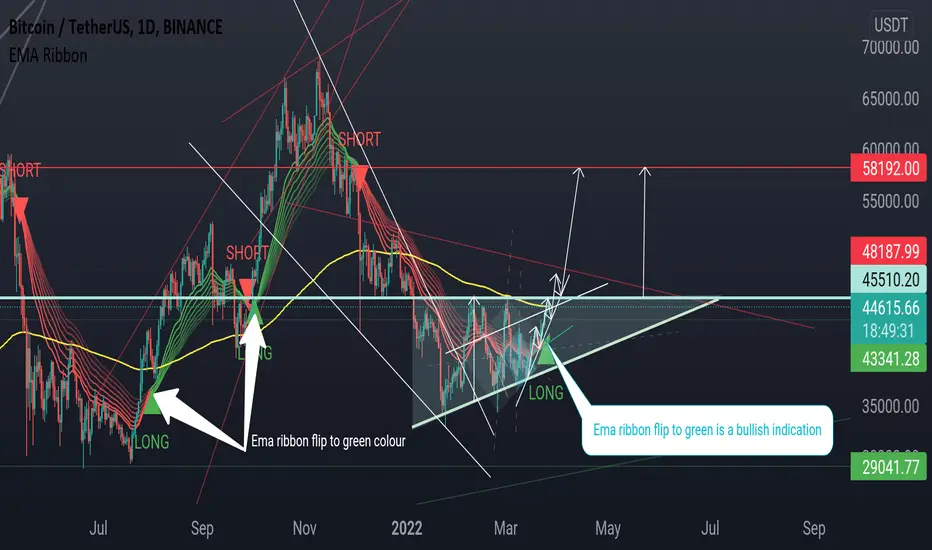
Bitcoin super bulish medium term. on my road to 58.000Bitcoin forming an ascending triangle
Is a bullish pattern for bitcoin price
And the EMA ribbon
Show flip from red to green
Is a good signal for us to long for bitcoin
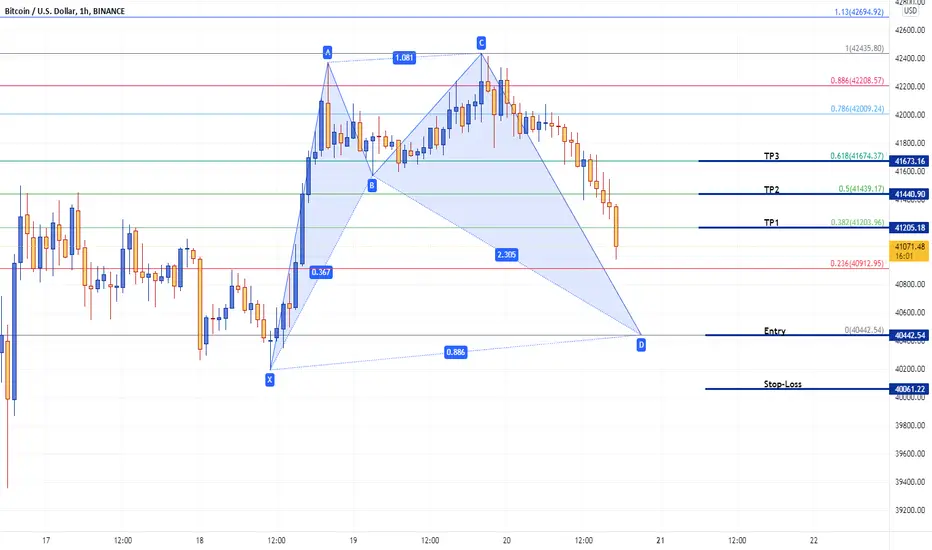
BTC bullish shark completion at $40,442Price action on 1H timeframe is in development of a bullish shark harmonic, Completion target is $40,442, Invalidation target $40061. If price does not bounce from from $40,442 then possibly we will see a retest of $39.5k level. We will see a choppy next week if price does not close on weekly candle $41,600 to $42,300 levels.
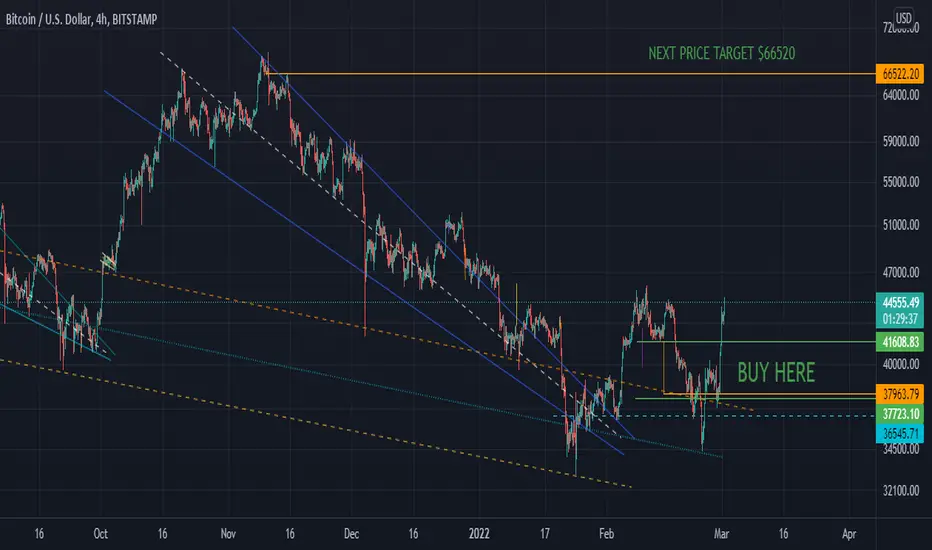
BTC price breaking out to the upsideIn this chart analysis, I show that my green buying box was the perfect opportunity to stack up on BTC. The next price target should be reached within the next couple of days
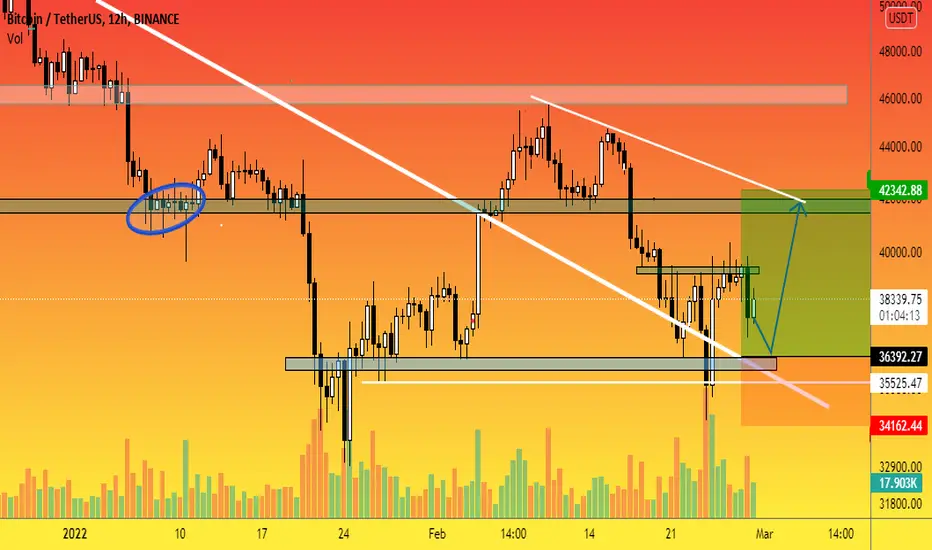
Bitcoin forecast - BTC price is preparing to increase by $42,000Hello colleagues! Unfortunately, they could not fully work in the previous days due to the war in our country. We continue to share quality information with you a nd look forward to your support!
On February 23-24, the cryptocurrency market resisted. Bitcoin trading volumes have increased. On or about January 22-24, sellers attacked the $34,000 range . However, this initiative was suppressed.
An important fact is that the sellers failed to update the local low from January 24 in the increased volumes of bidding. Given the fact of negative news, the Bitcoin market has survived. This means that buyers are ready to form a new wave of growth with the first goal of $42,000 .
Another local confirmation of this fact will be the retest of the $36,000 mark. If in the coming days we see a light touch of sellers to the range of $36,000 it will be a good signal to enter the long position.
If the first growth target is $42,000, the final one is around $46,000.
We will consider an alternative scenario if the price of Bitcoin remains below $34,000.
BITCOIN Path to 33k Double BottomGood evening everyone 😃
Just wanted to post a quick continuation to the posts that I made earlier, and specifically the two here below 👇 where I mentioned two scenarios for the BTC bottom, with this one being the more bullish one.
In this scenario here I'm basically expecting a bounce in the 33k region, that would then take us to either a dead cat bounce or to new all time highs.
Here in these two posts I also mention the critical areas for BTC to confirm a bull run, as well as a more bearish scenario:
Post:
Video:
I would like to add that this is only for educational purpose and in no way a guarantee that it will play out this way, nor is this or are any of my posts financial advise.
As always, A BIG THANK YOU for stopping by, I hope you liked my post! If you did, please take a second to drop a like or comment, every engagement puts a smile on my face, but also helps me to get my ideas out to many more of you guys! 😃🙏
Happy Trading ✌♥📈
BITCOIN What's Next? What's up Everyone! 😃
I decided to upload a couple shorter Bitcoin videos 🎬 to point out the most interesting parts out of my longer weekly update video.
In this video I'm looking at the inmediate short-term future for Bitcoin on the 4h BTCUSDT chart.
This is the longer video from earlier where I mention everything in this video, but also talk about other larger TF's. 👇
THANK YOU for your time!
Like 👍 = 😃
Comment 📜 = 😁
Happy Trading ✌♥📈

BITCOIN Weekly Chart Shows Bottom!What's up Everyone! 😃
Video 🎬 3/3 for today and my favorite, as I've been looking at this chart since early december! 😃
Here I'm looking at the weekly Bitcoin BTCUSDT chart, and I've found a few very interesting points that could give away a couple of strong options for a potential bottom.
Like always a bullish, but also a bearish scenario!
THANK YOU for your time!
Like 👍 = 😃
Comment 📜 = 😁
Happy Trading ✌♥📈

Bitcoin My Two Most Likely Scenarios!What's up everyone! 😃
These charts are pointing me to two very possible scenarios for the BTC bottom.
4h:
1D:
Weekly:
Let me break it down for you in the video 🎬!
THANK YOU for your time!
Like 👍 = 😃
Comment 📜 = 😁
Happy Trading ✌♥📈

BTC Testing the 200 EMAHello friends.
It seems like BTC price started the day with a downtrend movement, and went directly to test the 200EMA on the 1hr Time Frame.
Let's see if it can hold or reject.

BTC Playing AroundHey my friends.
Wanted to give you a big perspective on the daily time frame, of what is happening to BTC Price.
We are currently entangled between the 50EMA and the 200EMA.
Price is not doing much these days, so, what are the possibel perspectives for the future!

BITCOIN Good or Bad News?Happy Monday Everyone! 😃
Thanks for stopping by for another BTC update!
This time I look at the Bitcoin charts on multile TFs, but also at some very influencial geo political news concerning the Russia/Ukraine conflict, and finally news from the Feds about the future of the interest rates.
I would also like to send well wishes to anyone that is affected by the terrible situation in and around the Ukraine. 🙏
Charts from the Video:
4H:
1 Day:
1 Week:
1 Month:
Make sure to also keep an eye on the news and other markets!
Credit for news sources:
Al Jazeera:
www.aljazeera.com
The New York Times:
www.nytimes.com
Market Watch:
www.marketwatch.com
THANK YOU for your time !
Like 👍 = 😃
Comment 📜 = 😁
Happy Trading ✌♥📈

BITCOIN Bearish Signals!What's up Everyone! 😃
I hope you are all having a successful Sunday!
Russia Ukraine:
Things are looking bearish in general when we consider the situation between Russia and Ukraine and how traditional markets reacted to those news with a panic sell-off on friday before markets closed. Bitcoin in it's usual fashion followed the trend and also took a bit of a hit before the weekend. As for now we are moving through the weekend sideways.
FED Meeting:
In addition to the war that could potentially break out, the FED have called for an emergency meeting on Monday. A lot of indicators are pointing to more hawkishness around the rate hikes and that the first increase could come in the inmediate future.
Make sure to keep an eye on the news and other markets, specially on Monday 14th when Stock markets open and the FED meeting will be held.
Let's hope expectations are way worse than the truth, in which case we could see a nice pump next week!
THANK YOU for your time!
Like 👍 = 😃
Comment 📜 = 😁
Happy Trading ✌♥📈
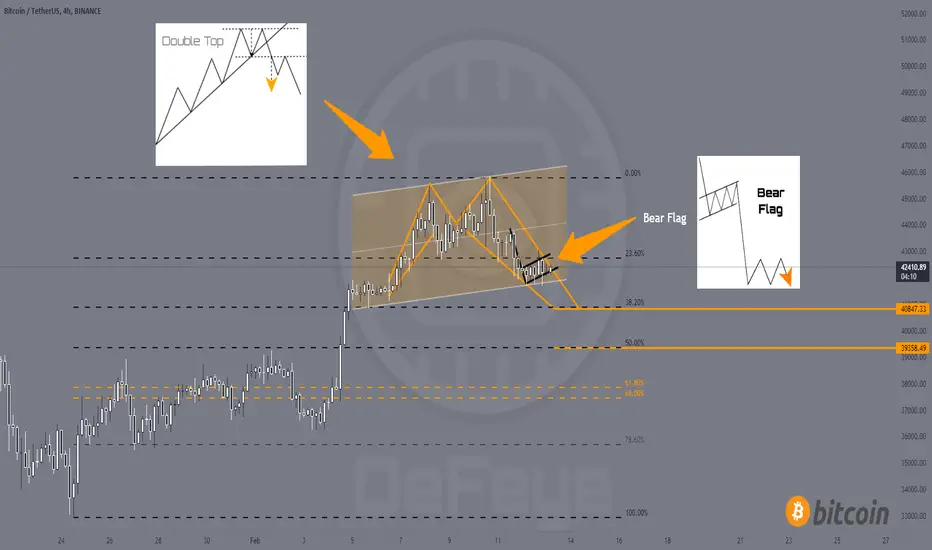
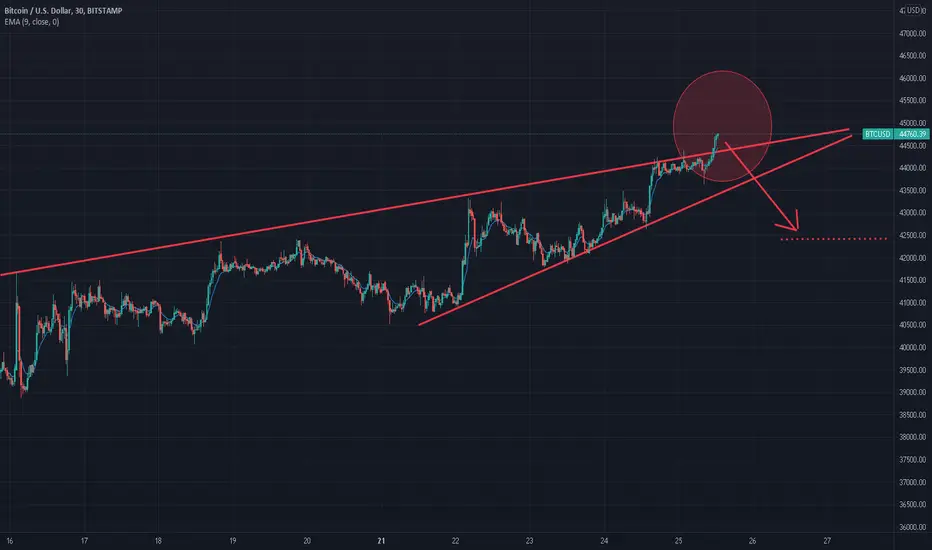
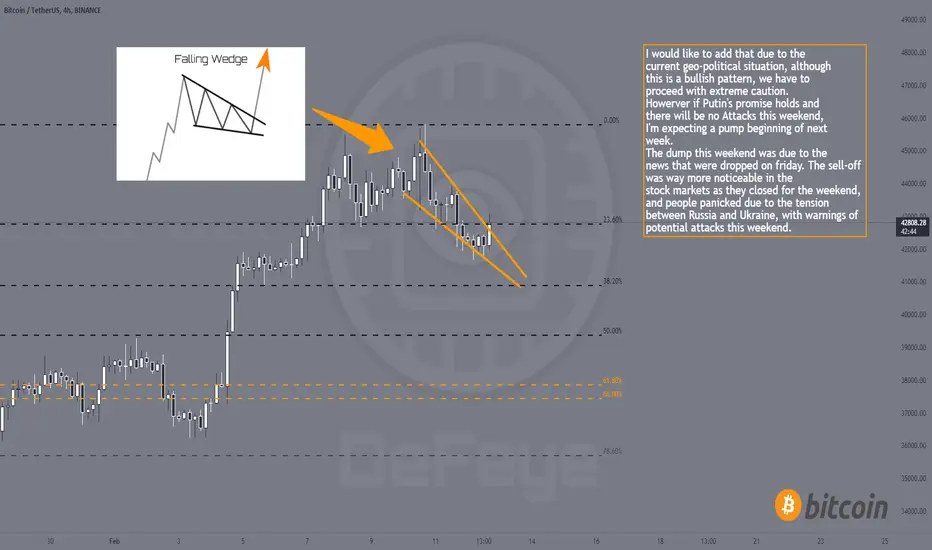
BITCOIN 4H Falling Wedge!What's up Everyone! 😃
Hope you are all having a successful day!
I only want to add this daily BTC chart for more clarity on our targets. If we break resistance at 45k to 46k, we see 51k as our next potential taget for Bitcoin.
If we don't hold in the 40k to 39k region we could see a potential double bottom at around 33k or go down to 29k from where we bounce to multiple ATH's.
The rest is all in the title and in the chart as I have to keep it short here!
I would like to add that this is for educational purpose only and in no way a guarantee that it will play out this way, nor is this or are any of my posts financial advise.
THANK YOU for stopping by!
Like 👍 = 😃
Comment 📜 = 😁
Happy Trading ✌♥📈
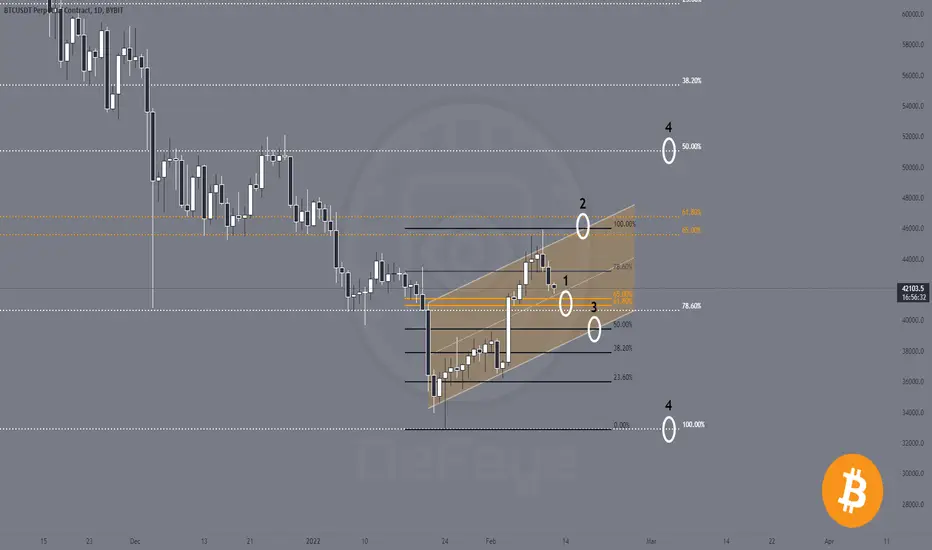
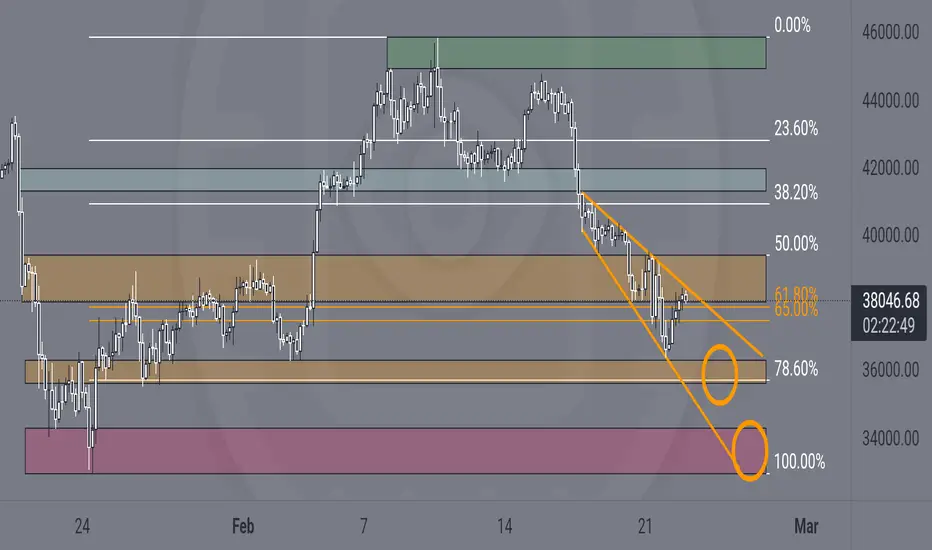
BITCOIN 1D Ascending ChannelHappy Saturday All! 😃
Hope you are all having a successful day!
Here we can see BTC forming an asccending channel on the daily chart and there are a few things that I would like to point out:
1: We have strong support in the 41k region with the golden pocket on the local Fibonacci retracement which measures the current uptrend and the 78.6% Fib. level on the retracement that measures the downtrend from the November ATH and the currrent low point at around 33K.
2: The resistance or top of the channel would align perfectly with the local 100% Fibonacci retracement level and the golden pocket (61.8% & 65%) of the downtrend retracement.
3: The 39k area in which the local 50% Fib. level coincides with the bottom of the channel, is the last chance for Bitcoin to make a higher low whilst staying in the current channel/trend.
4: The other Fibonacci retracement levels on the larger retracement (white and orange) give us a good idea where our next target areas would be (50% & 100%) in case we were to break those previously mentioned levels.
------------------------------------------------------------------------------
If we look at the smaller TF (4h) we can see that the support and resistance areas that I mentioned above become even clearer.
I would like to add that this is for educational purpose only and in no way a guarantee that it will play out this way, nor is this or are any of my posts financial advise.
THANK YOU for stopping by!
Like 👍 = 😃
Comment 📜 = 😁
Happy Trading ✌♥📈