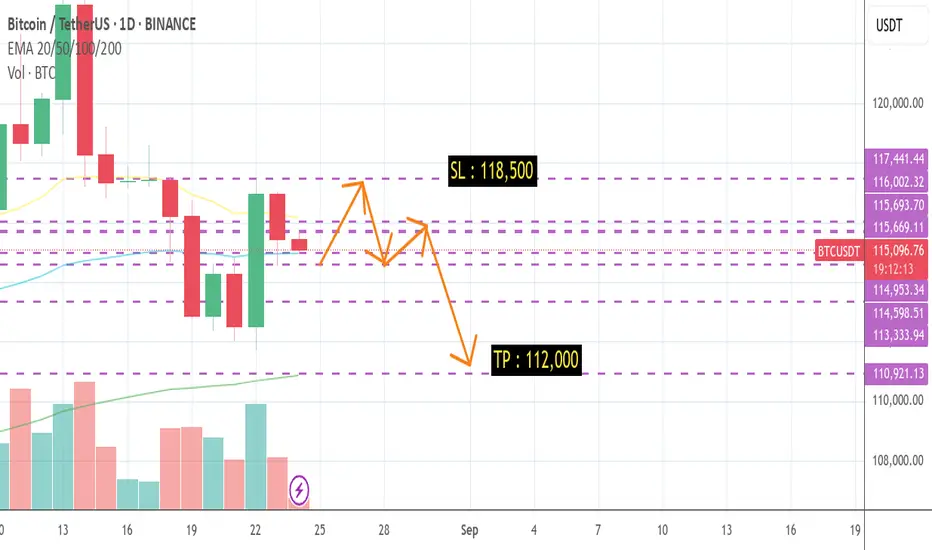
BTC/USDT – 1D Chart Analysis !! BTC/USDT – 1D Chart Analysis
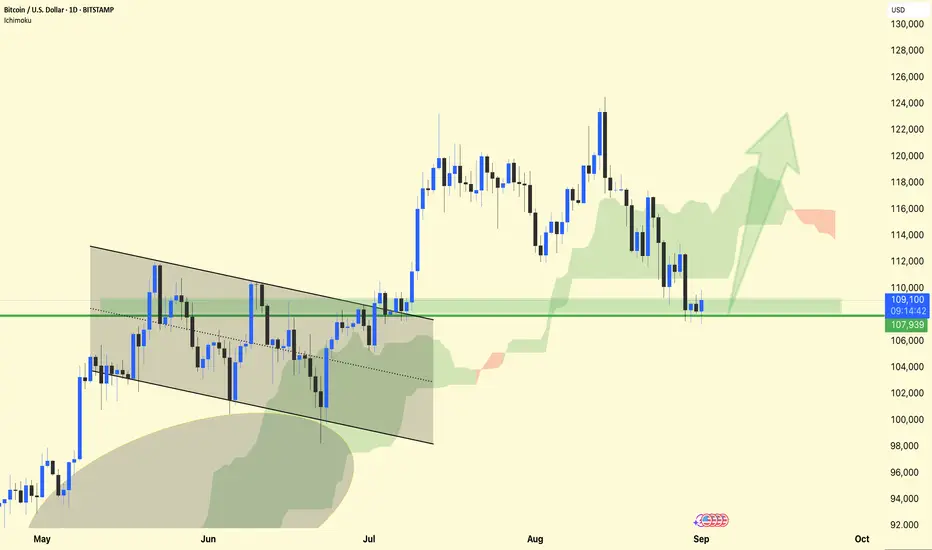
BTC is holding above the $108K support zone (green box). This area has acted as a demand zone, preventing deeper downside.
Structure: After the breakdown from the wedge pattern earlier, the price is consolidating near support with lower wicks showing buyer defense.
Ichimoku Cloud: Price is still inside the cloud zone, suggesting a neutral-to-bullish outlook. A strong daily close above $110K–112K could flip momentum upward.
Next Targets:
Bullish breakout → Move toward $116K – $120K zone (green arrow projection).
If support fails → Risk of retest around $104K – $102K.
⚡ Sentiment: Market is at a make-or-break level — holding $108K could spark a strong rebound; losing it could trigger further correction.
DYOR | NFA
Btcshort
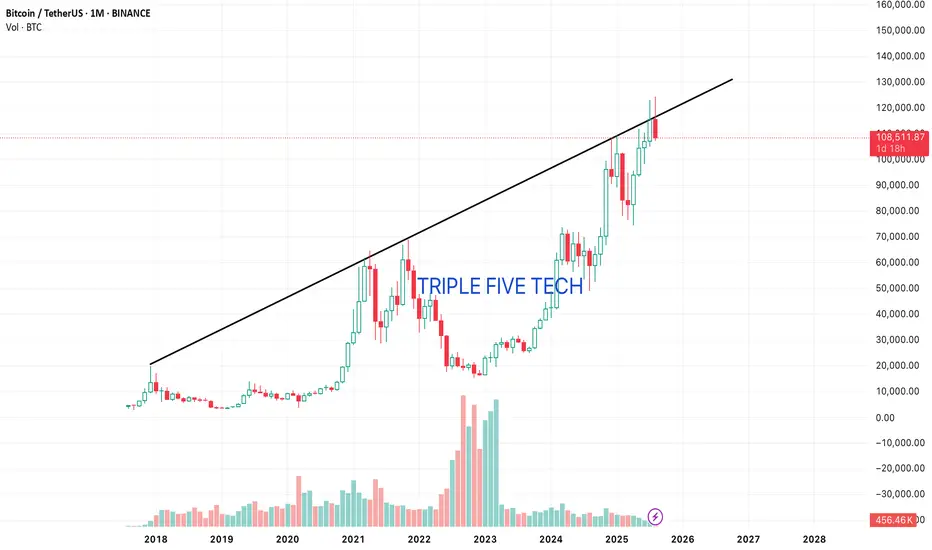
BTCUSDT IS JUST ACTING THE WAY IT SHOULD.Most Traders don't understand basic Trading Principles. I have been trading Crypto since 2015- 10 good years but what I have realised is most people get the basics wrong.
I have been asked countless times in the past month that BTC is becoming unpredictable, it's a gamble, it's manipulated.
T he Trendline says it all. Not only for this top, but all the previous tops.
Guys maybe it's time to brush up the basics. I have developed proprietary Algorithms for HFTs, Trading desks that deal with Millions in volume every single day but never have I ever stopped looking at the basics. Price is everything guys.
I am always here for any genuine questions. You can comment or message me.
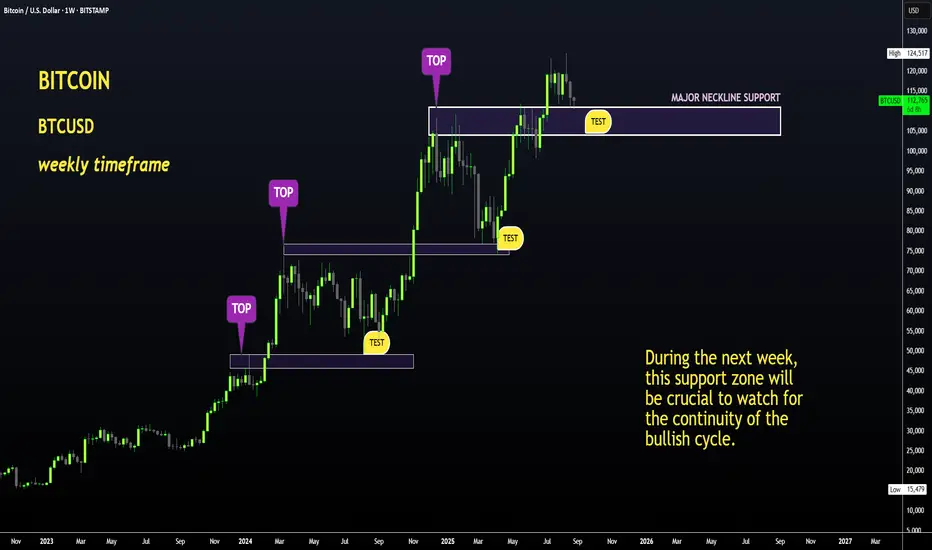
BTC in Trouble if THIS Support Breaks !Hello BTC Watchers
The previous update on Bitcoin was on how we may expect the altcoin market to play out during the next few weeks. (Find it here):
Now, if we look at Bitcoin in the weekly timeframe, the price is trading right on top of a KEY support zone. Here, we can either see a dip - marking the start of the bearish cycle OR the price can maintain this level and perhaps even push towards a higher high. This will all depend on the SUPPORT ZONE, and if the weekly candle will close ABOVE or BELOW this zone.
This would be between these zones:
Interestingly enough, we've extended to a full 2.0 on the Fibonacci retracement level. This will be very helpful in determining major bounce zones during the bearish season:
The next week will be vital! Update to follow at the end on the week on the progress of Bitcoin.
Bitcoin Bearish Reversal SetupThe chart shows a potential bearish setup for Bitcoin (BTC/USD) on the 30-minute timeframe. Price recently reacted off a supply zone near the \$112,860 resistance level after forming an equal high (EQH) and change of character (CHOCH) to the downside. Currently, price is making a minor pullback toward the resistance zone, with a projected move downward targeting the demand zones highlighted in blue between \$111,200 and \$109,300. The presence of a weak low suggests vulnerability, and sellers may aim to sweep that liquidity. The outlook anticipates rejection from resistance and continuation toward lower support levels.
BITSTAMP:BTCUSD

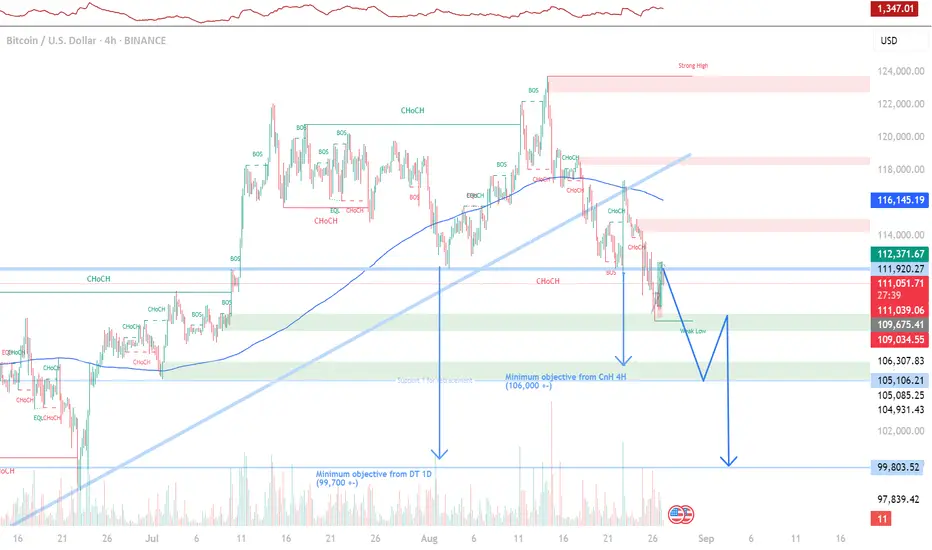
BTC Bearish Signal. 1D Double-Top Break with RetestMy last post was about how I was hoping to catch the retest of the 1D Double Top bullish wave to 112.3K, well now that position is DONE! . It has hit my target TP.
To continue, I have entered a Short at 112.1K with a Stop Loss at 113K , which is right above the short order block. I was able to enter at a good position this morning because i caught a 15m Reversal Candle with a declining volume during the push up. Not long after that, the 15m timeframe shows a Head and Shoulders Pattern with agreement with its volume. and lucky for me I entered at the head! In the hopes of having a TP at 106.9K (or even more!). This TP is based on the minimum objective of the Reverse Cup and Handle formation in 4H.
In this position, the first challenge would be breaking the Support Line at around 109.5K , which is quite significant as it was touched a handful of times.
When the price reaches 107K i will monitor the momentum to see if I should take the TP at 106.9K or extend my TP to 99.8K . Because right now there is a Double-Top minimum objective of 99.8K . I also did a Fibonacci Analysis that shows it actually might go lower than 99.8K. However, to me, it all depends on the price action then. I don't wanna be greedy and we can always set up new positions later on.
Happy Trading!
BTC adjusts down, market suspects interest rate cut💎 BTC PLAN UPDATE – Early Week (08 / 25 )
🔎 BTC Analysis
After retesting the 117k resistance zone (117,566 USD), the price reacted with a sharp drop. This indicates that the selling pressure in this area remains very strong.
Currently, the price is falling near the EMA200 (red line ~111,664) – which is a key short-term support level.
📌 Key Reaction Zones
111k – 110k:
This is the confluence of EMA200 + Fib 0.5.
If the price holds, there’s potential for a rebound back to 113k–115k.
109k – 108k:
Next strong support.
If 111k breaks, this zone will be the next critical reaction point.
105k – 104k:
Major long-term support (confluence of Fib extension + old demand zone).
In a bearish scenario, the price could test this zone before bouncing back up.
🌐 Market Sentiment & Expectations
After BTC was rejected at 117k, market sentiment has turned cautious and somewhat bearish in the short term.
However, many traders still expect BTC to hold above the EMA200 to trigger a rebound → if this level holds, sentiment may shift back to bullish, targeting 115k–117k again.
On the contrary, if the price breaks deep below 110k, the market may enter short-term panic and shift focus toward the strong support at 104k.
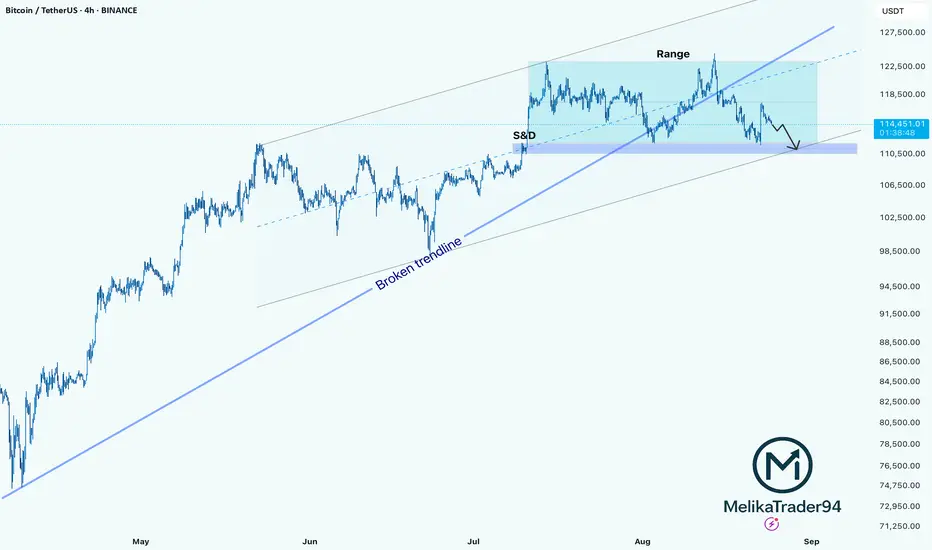
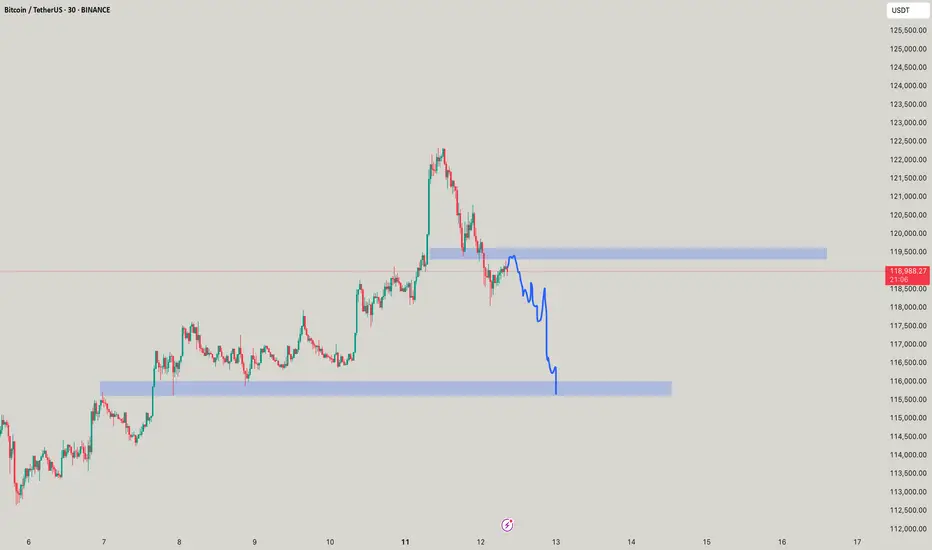
BTC Testing Key Demand Zone After Range BreakdownHello guys!
Bitcoin has been trading inside a clear range after breaking the previous trendline.
We had a Supply & Demand (S&D) reaction at the range’s beginning, and price is now moving lower after failing to hold above the broken trendline.
Currently, Bitcoin is approaching the demand zone (highlighted in blue). If price respects this area, we could see a bounce. Otherwise, a breakdown could trigger further downside movement along the lower channel.
For now, the bias remains cautious, watching how the price reacts to the 111,000–112,000 USDT zone will be key.
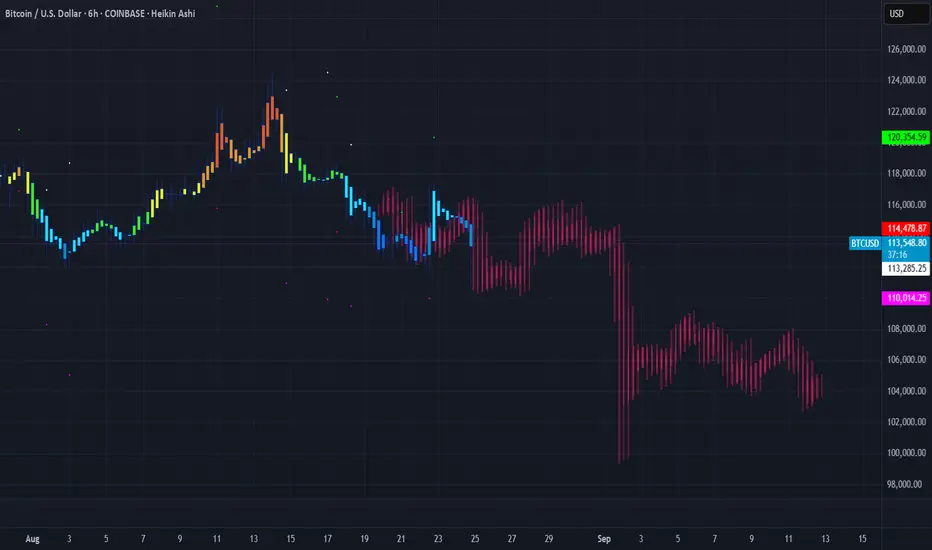
▒₿▒ BITCOIN FORECAST | 6HR ▒₿▒COINBASE:BTCUSD
This post is based off of historical price action analysis and Fibonacci measurements. I am not including these in the main chart as I like to put the focus on the price action for all of you. In a day and age of information we can tend to overdo it sometimes and the price action is something that is extremely fundamental when it comes to analysis, patterns and forecasting.
I've identified a unique pattern viewable in Heikin Ashi that signals trend exhaustion and distribution at major market tops. I will be working on another post showing this.
Historically, this pattern has resolved to the downside in a significant way. I've been out of the "game" for a few years in addition to this cycle being like no other. We've broken previous patterns, trends and correlations from previous cycles. I am still working to nail down these forecasts.
I've got a big project that I'm working on so my time is limited here, however I am developing and testing some indicators which I will be releasing here soon. In addition to this as I put more time into BTC analysis I will begin to have more accurate forecasts and long-term planning for BTC investments and trading.
As it is right now. I have had at least one person call me crazy and a noob for saying this but we can expect the BTC Bear Market Low to be about $33K in 2026. I will be doing a post on this too. I am well aware of the cost to mine a single Bitcoin and Capitulation and we did see this happen before in the past.
Here is how the current forecast looks on the 1Day.
I am now forecasting a break of the critical support trendline, currently sitting around $112,500.
A confirmed 6H candle close below this level would, in my view, be the final confirmation. This could trigger a much deeper and faster correction than many are expecting, with a first major target in the $100,000 - $104,000 zone.
There still of course remains the possibility of BTC hitting our target Bull Run Peak of $150K in December of this year. This a little less likely as I have additional information I have come across in my analysis. While we saw major resistance at the $124K levels, a huge rejection, trends broken on the daily charts, and potential consolidation there is still hope for BTC's $150K run. The Pi Cycle and other information does tell a different story.
One thing is for certain (almost certain) and that is that the identification of the Twin Shooting Star Candles on the 1-Week indicates we are going into weeks or months of a bear market and/or consolidation.
My view is more than likely not going to change on the short term (weeks to a few months) of BTC going down and/or consolidating. The critical level is that $100K mark, if we drop below this consider it highly unlikely that we will be making that run to $150K.
DISCLAIMER
I AM NOT A FINACIAL ADVISOR, NOR AM I YOURS. THIS IS NOT FINANCIAL ADVICE. MEARLY DOODLINGS ON A MATHMATICALLY DRIVEN GRAPHICAL INTERFACE, TRACKING AN INVISIBLE 256BIT MILITARY-GRADE ENCRYPTED ASSET. . . FOR ENTERTAINMENT/AMUSEMENT PUROSES ONLY. ENJOY!
Will a Fed Rate Cut Cause Bitcoin to Fall? A Look at the Market'As September approaches, the financial world is on high alert for the next Federal Reserve meeting. After a period of high inflation, the Fed has been holding interest rates steady, but recent comments from Fed Chair Jerome Powell have raised expectations for a rate cut. While many might think a rate cut is great news for risky assets like Bitcoin, the reality is more complex. The market's reaction could be a classic case of "buy the rumor, sell the news."
The "Buy the Rumor, Sell the News" Effect
For months, traders have been speculating that the Fed would eventually cut rates. This anticipation has already been a major factor in the recent rally of Bitcoin and other cryptocurrencies. When investors believe that borrowing money is about to get cheaper, they are more willing to move their money out of safe investments, like government bonds, and into riskier assets that have the potential for bigger gains. This is a key reason why Bitcoin has been performing well.
However, this is where the risk lies. The market has likely already "priced in" a September rate cut. This means that the current high price of Bitcoin already reflects the expectation of this event. When the Fed actually announces the cut, there may not be a new reason for the price to go up. In fact, many traders who bought in anticipation of the news might decide to sell their holdings to lock in their profits, causing a short-term drop in price. This is a common pattern in all financial markets.
Looking at the Broader Picture
While a rate cut is generally seen as a positive for Bitcoin in the long run, the short-term impact is not guaranteed to be a straight shot up. The Fed's decision is just one piece of the puzzle. Other factors that could influence Bitcoin's price include:
Inflation: The Fed's main job is to control inflation. If inflation remains stubbornly high, the Fed might signal that this is the only rate cut for a while, which could dampen market enthusiasm.
Economic Outlook: If the Fed cuts rates because the economy is showing signs of weakness, investors might pull back from all risky assets, including Bitcoin, out of fear of a recession.
Regulatory News: Any new regulations or statements from governments about cryptocurrencies could also cause a significant market reaction, regardless of what the Fed does.
⬇️ Sell now or sell on 115669.0
⭕️SL @ 116080.0
🔵TP1 @ 113449.0
🔵TP2 @ 111600.0
Risk Warning
Trading Forex, CFDs, Crypto, Futures, and Stocks involve a risk of loss. Please consider carefully if such trading is appropriate for you. Past performance is not indicative of future results.
Conclusion: Caution is Key
For traders and investors, the key takeaway is to approach the upcoming Fed meeting with a healthy dose of caution. While a rate cut is widely expected, it's not a guaranteed path to higher prices. The smart move is to understand the different scenarios and not to get caught up in the hype. Bitcoin's price has already been influenced by the rumors of a rate cut. The actual announcement could very well lead to a period of volatility and even a temporary pullback as traders take profits.
If you liked our ideas, please support us with your likes 👍 and comments.
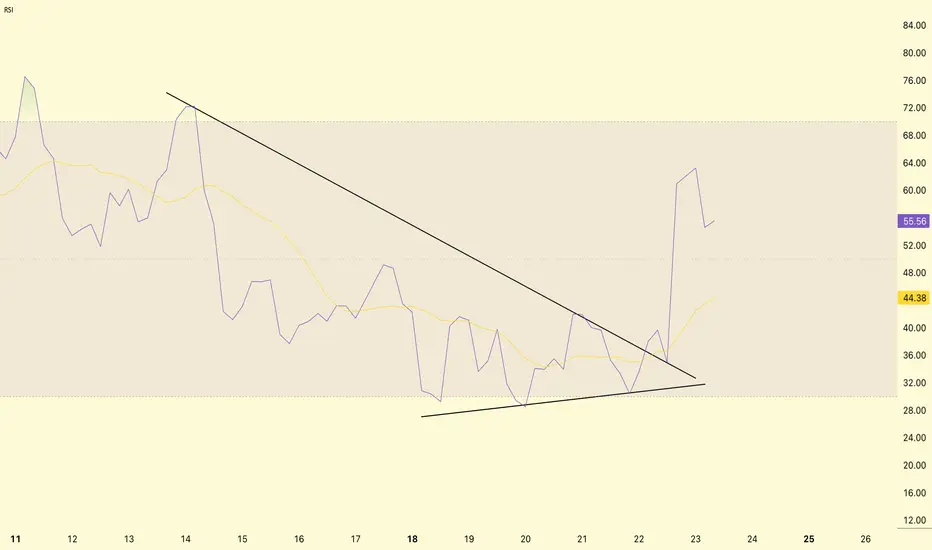
BTC/USDT RSI Analysis !!BTC/USDT RSI Analysis
RSI (Relative Strength Index) breakout analysis.
Descending wedge in RSI
From August 11 to August 22, RSI was forming a descending wedge pattern (lower high, higher low).
This is usually a bullish reversal setup.
RSI breakout
RSI broke out of the bullish wedge on August 22 → rose from ~30 to ~65.
Current RSI = 55.97 → from neutral to bullish territory.
Moving average (yellow line) = 44.41, which means RSI is above the trend, indicating positive momentum.
RSI breakout confirms strong buying interest.
This could mean that BTC has completed its short-term correction phase and is ready for another rise.
DYOR | NFA
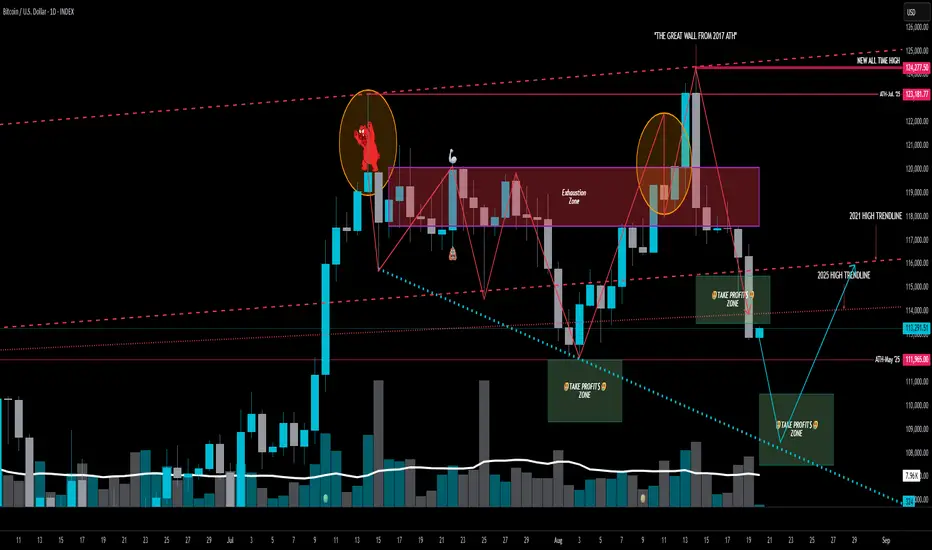
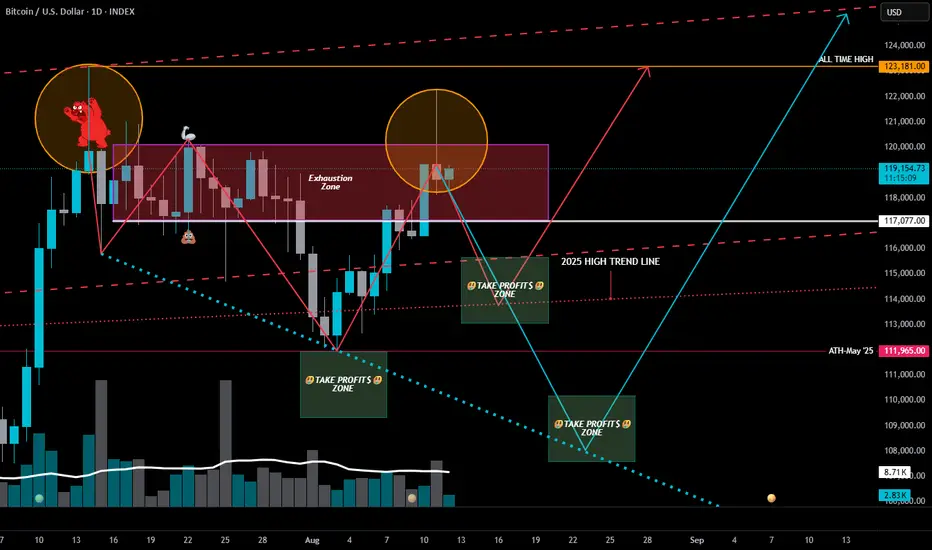
BTC Exhaustion Zone-The Finally 📉 BTC Exhaustion Zone = Next Targets in Sight
Now that we’ve had a confirmed daily close below the 2025 High Trendline, the path is clear:
🎯 Next Stop: May 2025 ATH
If we crack that? We’re likely headed straight into our Third Take Profit$ Zone — deep in the volatility pocket.
🔽 What Comes After the Drop?
Once we tag the teal descending trendline (or close to it), it sets up a high-probability trampoline move — launching us back toward the 2021 High Trendline.
🧠 That’s the bounce zone to watch: a powerful spot to reassess, and ride into September with the Exhaustion Zone behind us, but false narrative ahead of us, which can very well bleed AMEX:BTC into RED.
So go ahead — get your long hats ready, but only after the trap is set and sprung.
—
📌 The Alpha View
This is planned destruction → into precision reaccumulation.
We're moving level to level with surgical precision once again.
Stay Sharp. Stay Regulated.
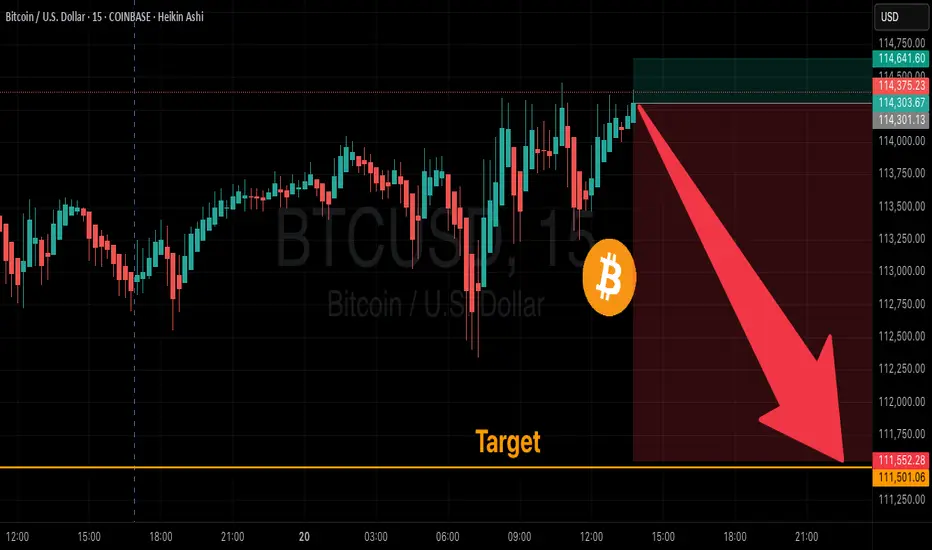
BTC Short Trade Setup – Bearish Momentum
🎯 **BTC Short Trade Setup – Bearish Momentum**
📌 **Instrument:** BTC
📉 **Direction:** SHORT
💰 **Entry Price:** \$115,200
🛑 **Stop Loss:** \$116,500
🏹 **Take Profit:** \$111,500
📏 **Position Size:** \$5M (1% of \$500M account)
💪 **Confidence:** 65%
⏰ **Timing:** Enter at market open
⚠️ **Key Risks:**
* Market volatility can trigger rapid moves.
* Breakout above \$116,500 invalidates setup.
* Macro correlations may amplify risk.
✅ **Rationale:**
* Lower highs & lower lows = bearish momentum
* Price below key MAs, weakening bullish conviction
* Technical indicators support short entry
🔥 **TradingView / Social Tags:**
\#Bitcoin #BTCShort #CryptoTrading #CryptoAnalysis #FuturesTrading #TechnicalAnalysis #TradingSignals #RiskManagement #MarketAnalysis #CryptoAlerts #HighConvictionTrade #BearishSetup #PriceAction #TradingStrategy #CryptoMarket
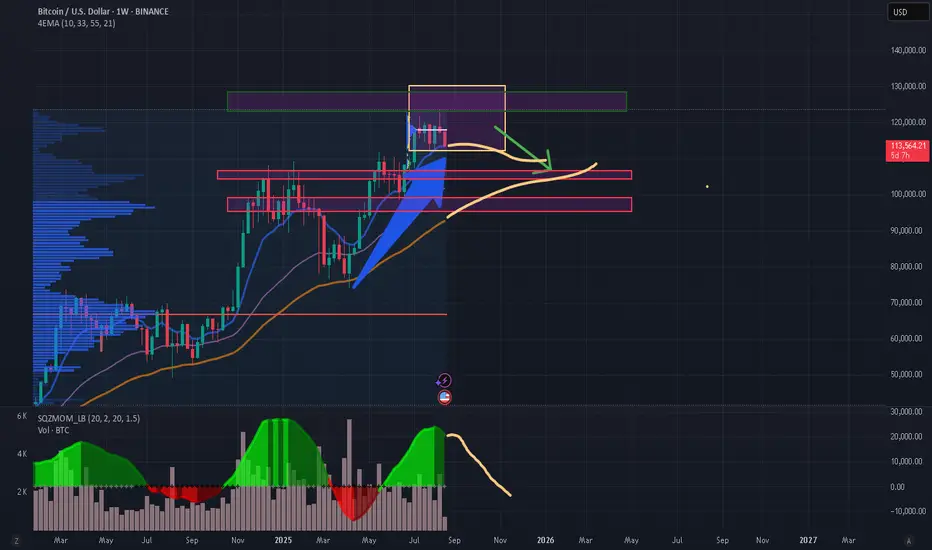
BTC 1W😎Probabilities of a correction to the 55-period moving average, a technical rebound for bullish continuation, without breaking the weekly uptrend.
♥ Keep in mind that a correction to the 55-period moving average on the weekly chart constitutes a bearish trend on the daily chart.
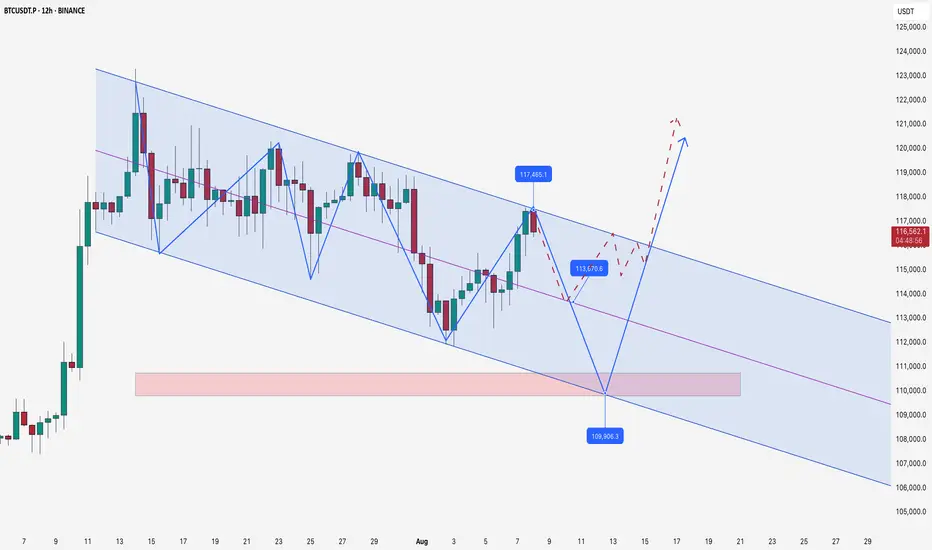
BTC levels for August 2025Simple channel on BINANCE:BTCUSDT.P
retest of equilibrium with main liquidations of 20x - 40x leverages around 113600
this weekend or if we will see some bad macro news drop by end of 12-15 august
109900
keep charts simple
BTC Update: Still Trapped in the Exhaustion ZoneBTC Update: Still Trapped in the Exhaustion Zone
Yes… we're all exhausted. And right on cue, BTC prints a second Exhaustion Candle on the daily. That’s not bullish.
A dip before a rip? Very likely.
—
🔍 The Setup
BTC still behaving strong overall — this would be a counter-trend dip if it comes.
Shorting here is playing defense, not offense.
📌 Key Level to Watch:
The 2025 High Trendline — drawn from Jan to May highs — is now likely acting as support, not resistance. Expect aggressive buyers there if price drops.
—
🐻 If Bears Claw Through That Line…
• First stop = May ATH (~112K)
• This time, don’t expect the bulls to hold it as easily
• If that cracks, next stop = the downward sloping trendline — the one that's quietly caught every breakdown since this zone began.
—
📌 The Alpha View
The second exhaustion candle is a warning shot.
This dip might be brief — but if bulls fail to show strength at the right level, it could spiral.
Stay sharp. Stay regulated.
Let the structure speak — not your emotions.
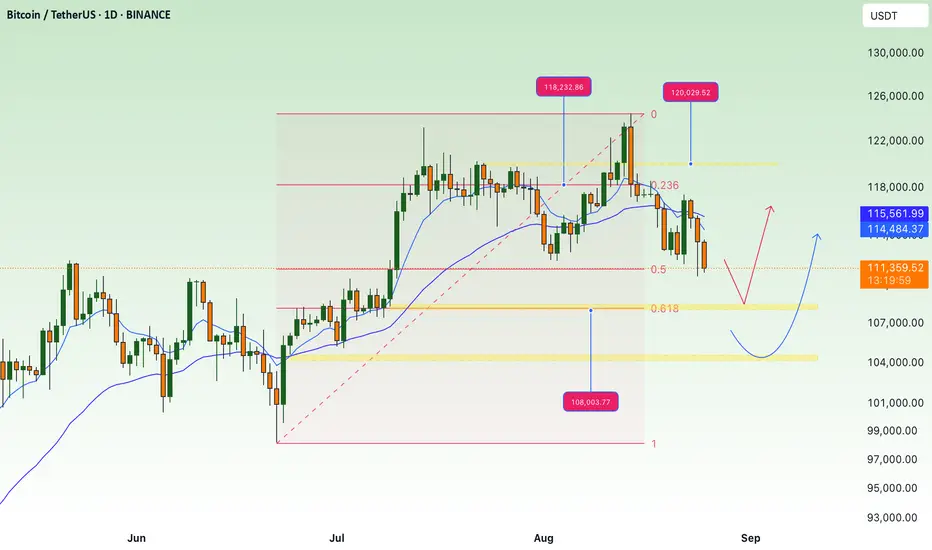
BTC Accumulates and Adjusts Slightly💎 BTC WEEKEND PLAN UPDATE (15/08)
BTC Analysis After PPI
Trading Highlights
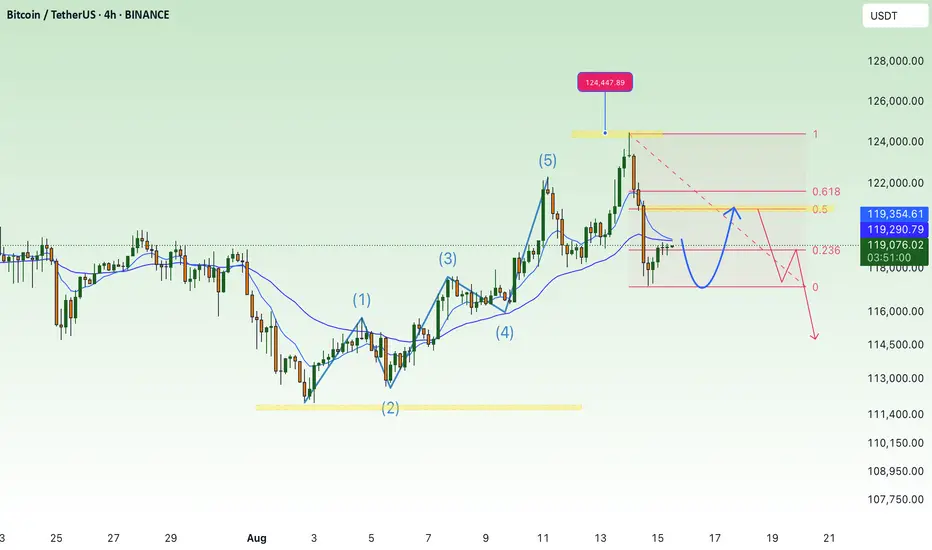
After the PPI release, BTC completed its bullish wave and reached a peak of 123.2K, exactly at the 2.618 Fibonacci Extension level – a strong resistance zone that had been anticipated.
Afterward, the price sharply reversed, dropping to the 117K support area – aligning with the main uptrend line and the 0.236 Fibonacci retracement of the most recent bullish wave → this was where we successfully executed a bottom-picking buy.
Current Price Action
The price is now recovering from 117K toward the 120.7K – 121K resistance area (a confluence of the 0.618 Fibonacci retracement, a previous supply zone, and the H4 EMA).
The short-term trend remains a technical rebound after a sharp drop, with no confirmed sustained bullish reversal yet.
Scenarios & Next Trend
• Main Scenario: Price rebounds to 120.7K – 121K → faces selling pressure → sharply reverses downward following a corrective wave toward 116K – 115K (strong support).
• Alternative Scenario: If 121K is broken with high volume, BTC could revisit the 122.9K – 123.2K zone.
Key Levels
• Resistance: 120.7K – 121K / 122.9K – 123.2K
• Support: 117K / 116K – 115K”
"BTC at Critical Reversal Zone – Watch This Key Liquidity Trap
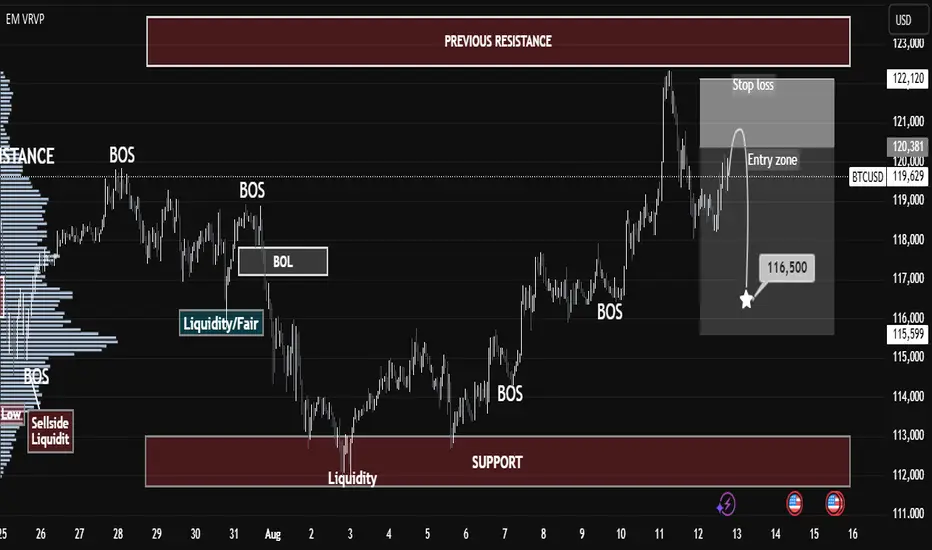
"BTC at Critical Reversal Zone – Watch This Key Liquidity Trap 🎯"
Market Structure Overview
BOS (Break of Structure): Multiple BOS points indicate shifts in trend phases, first to the downside (end of July to early August) and then back to the upside.
BOL (Break of Low): This marked a key liquidity grab before the reversal rally began.
Liquidity Zones: The chart highlights both sell-side liquidity (below lows) and buy-side liquidity (above highs), showing where institutional traders hunt stops.
2. Key Supply & Demand Zones
Support Zone (112,500 – 114,500): This level acted as a demand base after the liquidity sweep in early August. Price reacted strongly here, triggering the bullish leg.
Previous Resistance (121,500 – 122,500): This zone has capped price multiple times, making it a critical area for sellers to defend.
3. Current Trade Setup
Entry Zone: Around 120,000 – 120,400, where a short setup is triggered upon rejection.
Stop Loss: Above 122,120, just beyond the resistance to avoid premature stop-outs.
Target: 116,500 – aligning with prior liquidity pools and structural support.
4. Educational Takeaways
Liquidity Hunts: Notice how price often spikes into liquidity pools before reversing—this is common in BTC’s volatile environment.
Confluence Trading: The short setup aligns with resistance retest + liquidity grab + BOS, increasing probability.
Risk Management: Using defined zones for stop loss and target helps maintain a favorable risk/reward ratio.
Summary:
BTC is currently respecting the higher-timeframe resistance zone, with a clear short-term bearish setup in play. A rejection from the entry zone could trigger a drop toward the 116,500 target. Traders should monitor price action closely and avoid chasing entries—patience and precision are key.
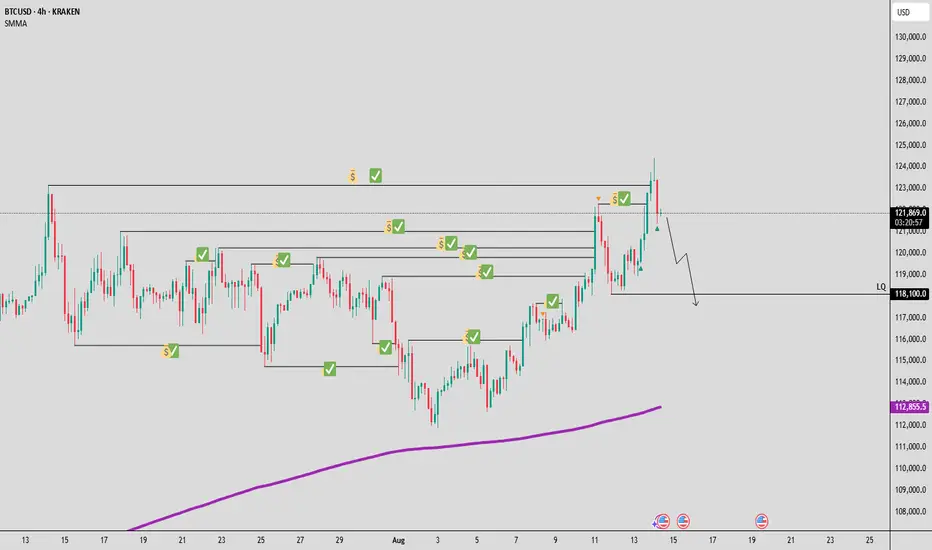
14.08 2025Yesterday my plan was clear if we make a little correction then I will open a long position to the ATH or if we go above ATH then I will open short position. And now it is a time to short market and my plan is clear and I'm gonna short market to 118,100 I see there a potential reverse zone if we grab liquidity from there.
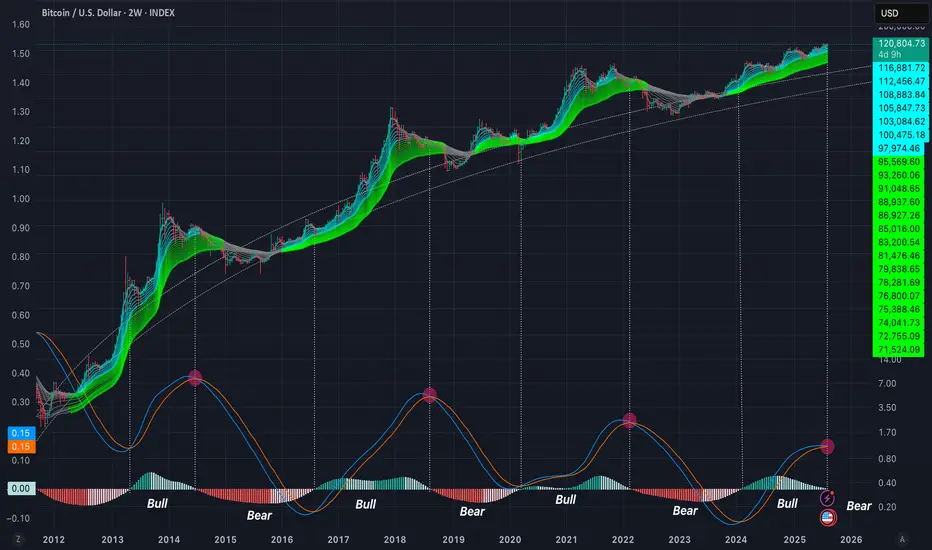
Topping indicator in a 2W Time frameThis time we are going to see the topping indicator in the 2W time frame. As you can see and IF this time is not different we are about to start seeing LMACD crossing and the red histogram showing up indicating the beginning of the bear market. 🥂
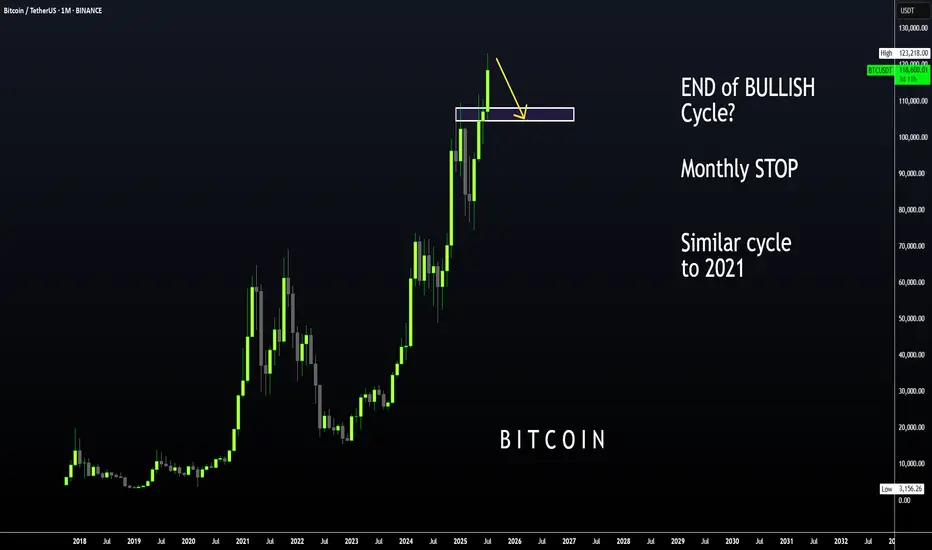
BTC | ALT Season, then BEARISH CYCLE BeginsBitcoin is likely moving in to the beginning of a bearish cycle.
I'm not saying this is immediate, we first need to see altseason - however, if BTC increases it may not go any higher than the last high of $123k. We could easily see the price hover around this zone with a few small increases and decreases for the next few weeks as alts make their respective moves.
I have been talking about the 2021 fractal for a couple of months, where BTC took its time to correct and then made another ATH which was only slightly higher.
We already see a similar pattern playing out in the monthly timeframe if we overlay bars pattern from 2021:
Although Bonce zone 3 may only be in several months, these are the major support zones where BTC could bounce from. Ideal for a swing:
____________________
BINANCE:BTCUSDT
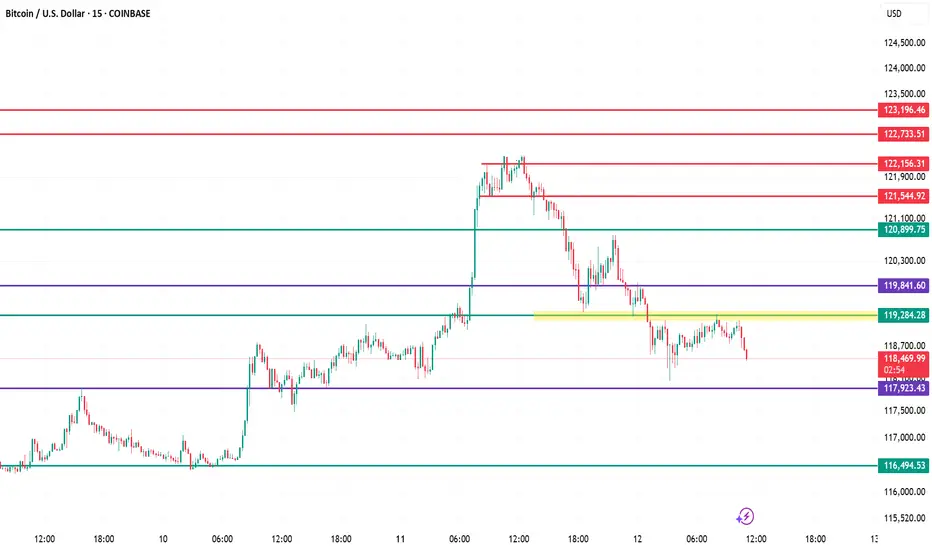
BTC/USD – Key Support Retest & Potential Breakout Zone | Current Price Action:
Trading near 118,543, price has broken below the yellow consolidation zone (~119,000) and is showing short-term weakness.
Resistance Levels:
Immediate resistance at 119,284, then 119,841, with stronger supply zones at 120,900 and 121,545.
Support Levels:
First support at 117,923, followed by 116,495. A breakdown of 117,923 could accelerate selling pressure.
Trend Outlook:
Short-term bias is bearish after repeated rejections from 119,284–119,841 zone; lower highs are forming.
Trading Bias:
Bullish: Break & hold above 119,284 → targets 119,841 / 120,900.
Bearish: Sustained trade below 117,923 → opens path to 116,495.
BTC ~ are you very bullish?BTC looks so dead, ideal buys goes to the range, means any good buys to hold, else its same you will get trapped anyways
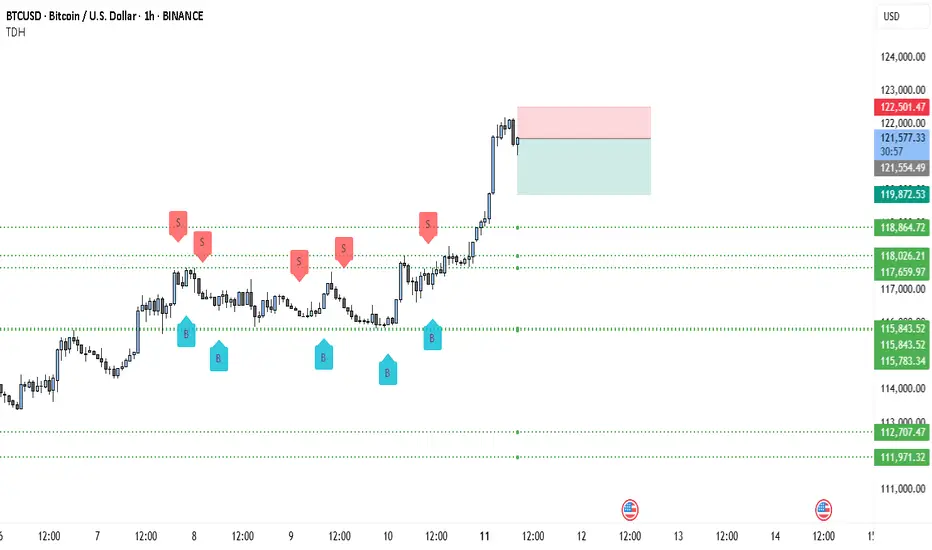
BTC Price Action Screams Sell — Is $115K Next?
• The move to $122.5k looks like a sharp liquidity grab / exhaustion wick rather than a sustained follow-through.
• Price failed to hold the top (small bearish candles after the spike) and is now sitting on/near a shallow support area — a classic place for sellers to press once momentum cools.
• Multiple prior “S” markers around the mid-$118k zone show persistent supply there; that same supply can re-assert as price retests.
• Bearish bias while price remains below the red supply zone (~$122.2–122.5k) and until it can reclaim & close above ~123k on 1H.
Key levels (read from the chart)
• Immediate resistance / supply zone: 122,200 – 122,501 (red box).
• Current price shown: 121,506.61.
• Support levels (dotted lines): 119,872.53 (first), 118,864.72 (second), 115,843.52 (stronger support / demand).
• Invalidation for the bearish plan: sustained close above ~123,000 (1H close).
Two actionable bearish setups (with exact math)
Setup A — “Rejection short” (preferred)
• Rationale: Wait for a retest/rejection of the red supply zone (122.2–122.5k).
• Entry: 122,200 (short on clear rejection candle)
• Stop: 123,000 (above the supply) → risk = 123,000 − 122,200 = 800 points.
• Targets:
o TP1 = 119,872.53 → reward = 122,200 − 119,872.53 = 2,327.47 → R:R = 2,327.47 / 800 = 2.91 : 1.
o TP2 = 118,864.72 → reward = 122,200 − 118,864.72 = 3,335.28 → R:R ≈ 4.17 : 1.
o TP3 = 115,843.52 → reward = 122,200 − 115,843.52 = 6,356.48 → R:R ≈ 7.95 : 1.
Setup B — “Breakdown short” (if price loses structure)
• Rationale: Trade the structure break — enter only after a clean breakdown below a nearby support retest.
• Entry: 121,000 (short once price decisively breaks and retests lower side)
• Stop: 122,000 → risk = 1,000 points.
• Targets: same support ladder:
o TP1 = 119,872.53 → reward = 121,000 − 119,872.53 = 1,127.47 → R:R = 1,127.47 / 1,000 = 1.13 : 1.
o TP2 = 118,864.72 → R:R ≈ 2.14 : 1.
o TP3 = 115,843.52 → R:R ≈ 5.16 : 1.
Short trade management / rules
• Position sizing: risk a fixed % of account per trade (e.g., 0.5–1%). Use the risk points above to size the position.
• Scaling: take ~25–40% at TP1, move stop to breakeven on first partial fill, trail rest to TP2/TP3.
• Confirmation: prefer one of these confirmations before entry — bearish 1H close below the short entry or clear rejection wick + volume spike to the upside followed by selling. (I can’t see live volume here — check it on your platform.)
• Invalidation: an hourly close above ~123k invalidates the bearish plan; flip bias to neutral/bull.
Why this is a high-probability bearish setup
• The rally was fast and left small-range candles after the spike — typical of exhaustion where liquidity was swept.
• Prior range had repeated sells around lower highs (S markers) — that supply doesn’t vanish; a failed breakout often returns to fill that liquidity.
• The downside targets are relatively close (TP1 is only ~1.63k points below current price, about 1.34%), so short targets are reachable without needing a large trend reversal.
(Example percent math shown exactly: current 121,506.61 − TP1 119,872.53 = 1,634.08 points → 1,634.08 ÷ 121,506.61 = 0.0134485 → ≈ 1.345% drop to TP1.)
Watchouts / final notes
• If BTC prints strong continuation volume on a push above 122.5k and holds >123k on hourly closes, the short edge is gone.
• Check 4H / daily to ensure this isn’t just a higher-timeframe bullish leg that will quickly absorb short pressure. If higher TF shows strong bullish structure, keep stops tighter.
• Not financial advice — treat this as a technical plan and adjust sizing/risk to your rules.