BTC/USDT Daily Chart Analysis:!!
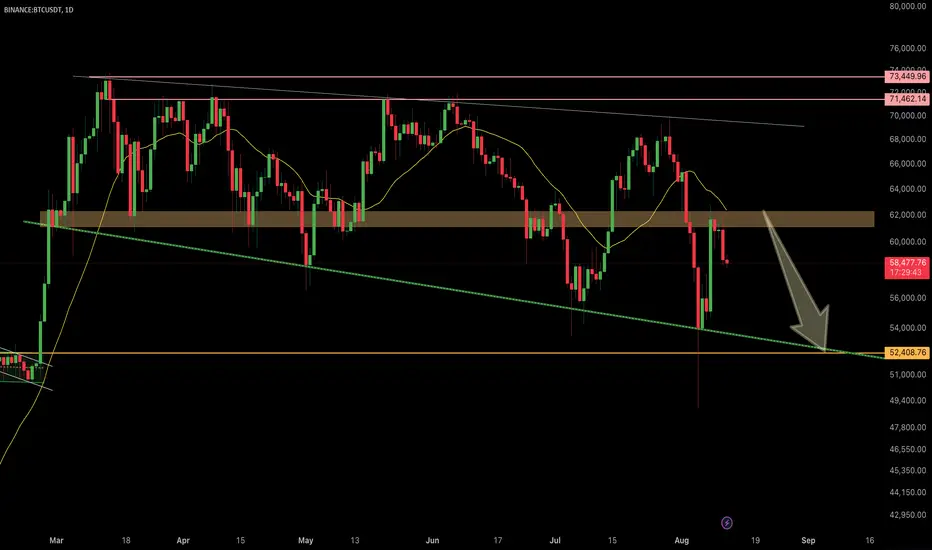
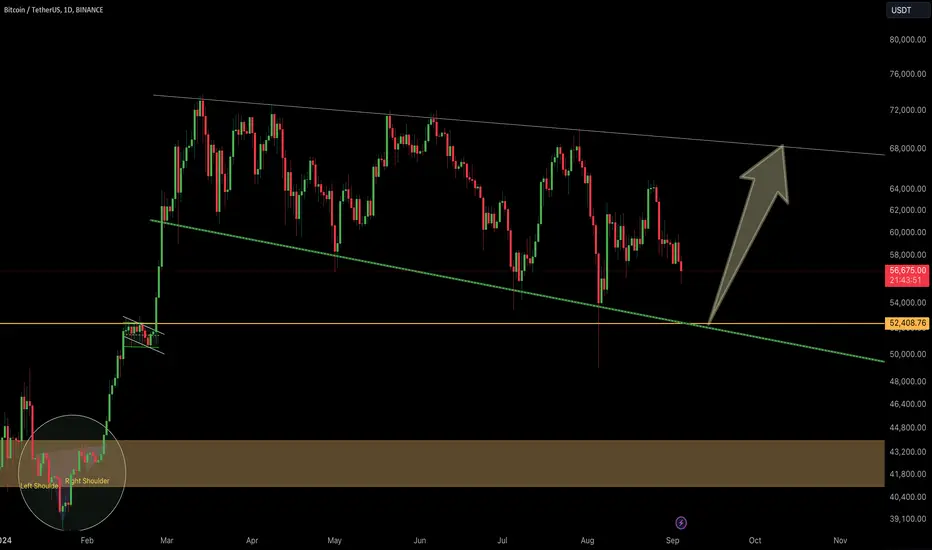
The chart shows that BTC/USDT is trading within a descending wedge pattern, with price action consistently testing the lower boundary of this pattern.
The price is currently sitting at a crucial support level of around $52,408, represented by the green trendline and the horizontal yellow line, which has served as a historical support area.
Support and Resistance Levels:
Immediate support is around $52,408. A break below this level could lead to a retest of lower support near the $50,000 psychological level or potentially lower.
The nearest resistance is the upper boundary of the descending wedge, followed by horizontal resistance around $66,000.
Possible Scenario:
A strong bounce off the current support level around $52,408, followed by a breakout above the upper boundary of the descending wedge, could signal a bullish reversal. A breakout above $66,000 would confirm a strong uptrend continuation.
If BTC fails to hold the support at $52,408, we could see increasing selling pressure, pushing the price down towards the next support level.
A head and shoulders pattern formation was completed earlier, indicating a bearish signal that appeared in the downward movement.
Currently, the descending wedge pattern is typically a bullish reversal pattern; thus, a breakout to the upside would align with the usual outcome of this pattern.
Monitoring volume is essential; a breakout with a strong volume would validate the move.
Oscillators such as the RSI and MACD would provide further confirmation; look for an oversold signal on the RSI or a bullish crossover on the MACD.
Manage risk with stop-loss levels below current support if bullish, or slightly above the upper boundary of the wedge if a continued bearish move is expected.
This analysis suggests that BTC is at a pivotal point, with significant upside potential depending on the integrity of the support level. Keep an eye on volume and price action near key levels for cues to the next major direction.
Disclaimer: This is not financial advice. Stay updated with market movements and adjust your trading strategy accordingly. Keep an eye out for further updates and analysis. Thank you!
Btcshort

BTC/USDT 2-Hour Long Update!!
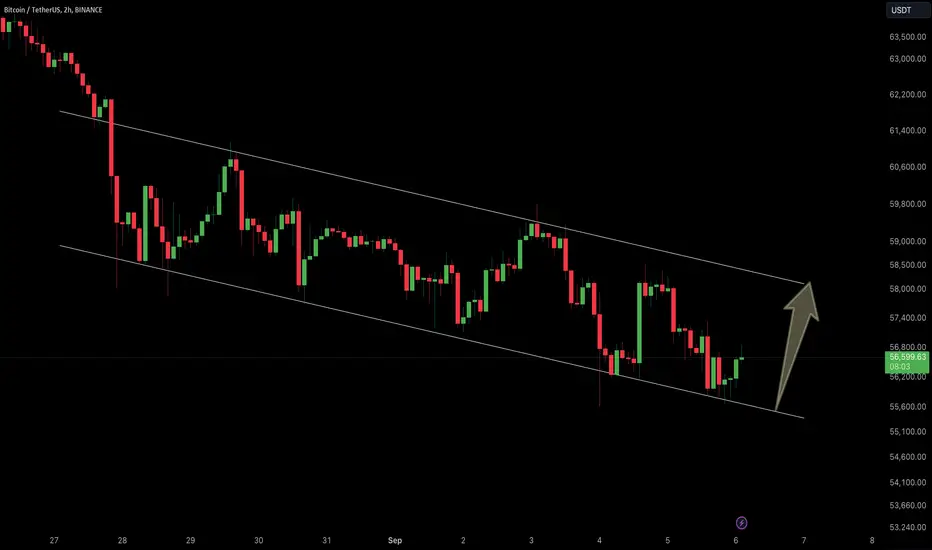
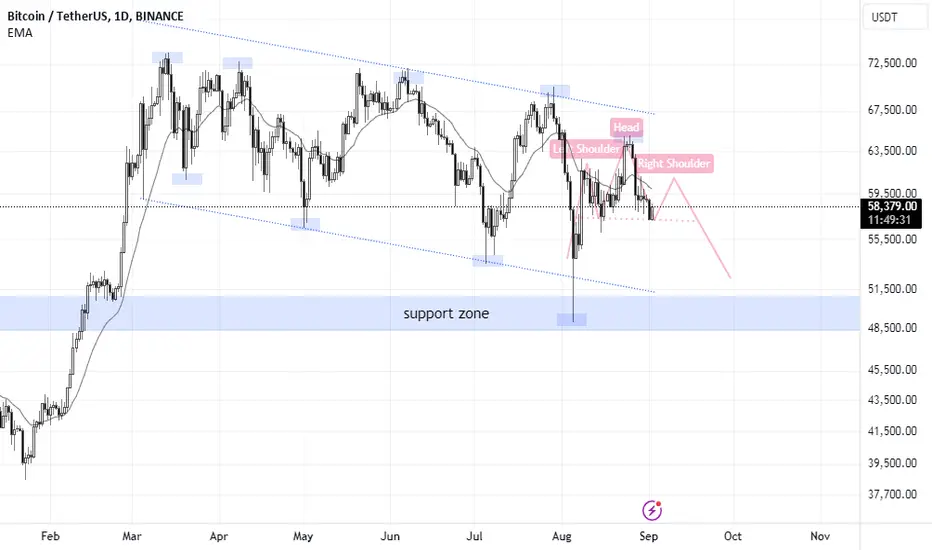
Current Analysis: BTC/USDT is trading within a descending channel on the 2-hour chart, suggesting that Bitcoin is in a short-term downtrend. However, BTC is currently testing the lower boundary of the channel and is showing signs of a potential bounce.
The lower boundary of the channel is around $56,200 - $56,500.
The upper boundary of the channel near $58,500 - A breakout above this could confirm a bullish reversal.
Monitor for an increase in volume, which could signal the strength of the move if BTC attempts to break out of the channel.
RSI: Currently in a neutral zone, suggesting no immediate overbought or oversold conditions.
A breakout above $58,500 with strong volume could trigger a move towards the next resistance levels around $60,000 and beyond.
Continued Downtrend: If BTC fails to break out and loses the $56,200 support level, it could continue to trend lower within the channel, targeting $55,000 or even lower.
Trading Plan:
Consider entering a long position on a confirmed breakout above the channel with a target of $60,000 and a stop loss just below the breakout level.
If BTC fails to hold the lower boundary and breaks below $56,200, consider shorting with a target of $55,000 and a stop loss above $57,000.
This is not financial advice. Keep a close watch on BTC's price action for rapid changes, and adjust your strategy as necessary. Stay tuned for further updates and analysis. Thank you!
BTC LONG , #BTCLONG#BTCLONG
Being in the market now for long is very nice choice
Because
1. stoploss will be so small
2. #btc has to reach range ( 65 963 to 69 375 )
3. they need to close the month so bearish to trap more beers
THINK OUT OF THE BOX
CRYPTOCAP:BTC #BTC #BTCUSDT #BTCLONG #ETH CRYPTOCAP:ETH
BINANCE:BTCUSDT
BITCOIN UPDATE !!BTC is in a tight consolidation range, and the next move could be decisive in the very short term. Keep an eye on key support and resistance levels and watch for volume spikes to confirm the breakout direction. As always, manage risk with appropriate stop-loss levels.
This is a quick update for immediate trading decisions, so be sure to monitor closely for any rapid changes in price action.
Note: This is not financial advice. Stay tuned for further updates and analysis. Thank you.
BTC/USDT 1DAY CHART UPDATE !!Overall, a Short update of the analysis implies a cautiously optimistic outlook with a focus on the $52,408 support level as a crucial point. If Bitcoin can maintain above this level, a bounce towards higher levels within the descending channel is anticipated, with a potential test of the upper resistance line around $70,000. However, if this support fails, further downside pressure could ensue.
Note: This is not financial advice. Stay tuned for further updates and analysis. Thank you.

BTC/USDT 1DAY CHART ANALIYSIS !!structure has been intact for some time, showing consistent lower highs and lower lows.
The horizontal support line at approximately $52,408 is a key level to watch. It has previously acted as a significant support zone, suggesting that any retest of this level could provide a strong base for a potential upward movement.
The chart features a prominent arrow suggesting a bullish reversal from near the lower support line and $52,408. This implies an expectation that the price will find support here and begin an upward move toward the upper boundary of the descending channel.
The upper trendline of the channel around $68,000 serves as the primary resistance level. A breakout above this level would indicate a significant shift in market sentiment, potentially leading to a larger bullish move.
The broader trend within the channel remains bearish until a breakout occurs. However, the emphasis on the support level and projected upward movement indicate a cautious bullish outlook in the short term, pending confirmation of a reversal signal.
The chart suggests that BTC is nearing a critical support zone of around $52,408, where a potential long opportunity could arise if the price action confirms a bounce. The key to a sustained bullish trend will be breaking above the descending channel’s resistance line, currently near $68,000. If this occurs, it would likely trigger a more pronounced upward trend.
Note: This is not financial advice. Stay tuned for further updates and analysis. Thank you.
where is best buy of BTC ???? hi im msnp follow me and boost this idea
BINANCE:BTCUSDT forming LH and LL from 13 march until now
we are in a bear channel and losing momentum and forming a head and shoulder
what do you think? you want stay in until market gets to 50 or 48K ?
look at 2021 and think how much market can fall (68k to 15K)
i expect a down trend don't fight with trend...
send me any altcoin name to analysis
follow me
bosst this idea
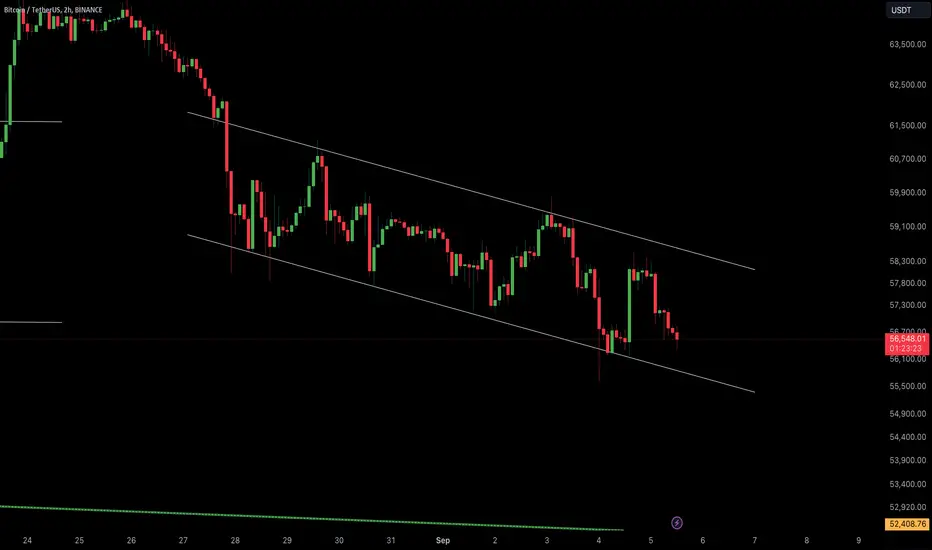
BTC/USDT 2HOUR CHART UPDATE !!BTC/USDT is currently trading at $57,661, up 0.41%. The 2-hour chart shows that BTC trades within a descending channel, with immediate support near $57,300. The price has bounced off the lower boundary, indicating potential for a short-term upward move. Immediate resistance lies around $59,700, where the upper boundary of the descending channel intersects. A breakout above this level could drive BTC towards the $61,000 zone. Conversely, a failure to maintain current support could lead to a further decline towards $56,500. Watch for volume spikes as an indicator of potential breakout strength.
Note: This is not financial advice. Stay tuned for further updates and analysis. Thank you!

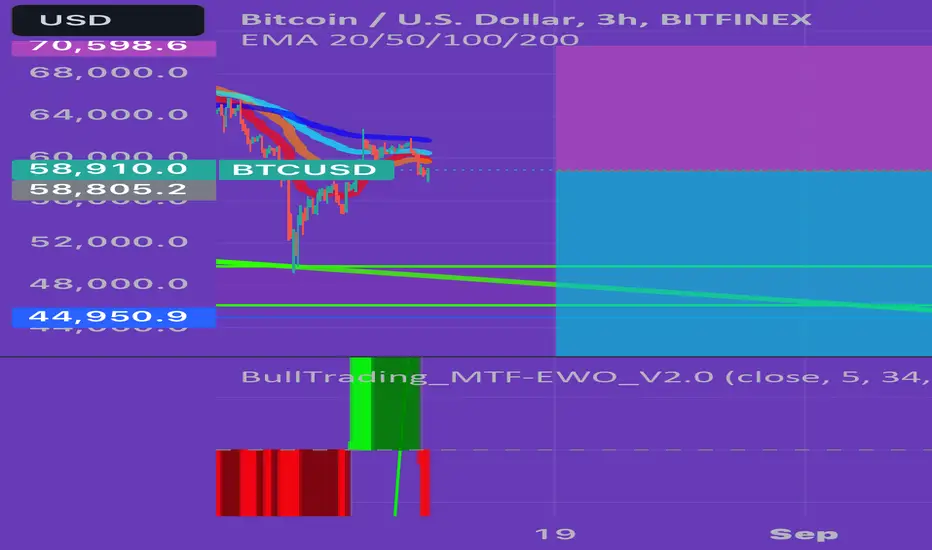
Friday Market Update - $IBIT, $BTC, $DXY and $SOL ForecastHere's a quick update to the video I posted last week showing a final unfilled Gap on the 4-Hour NASDAQ:IBIT likely pushing price down (We're NOT sure yet how this is correlated, other than the BIG money is playing with Options / Futures and now the NASDAQ:IBIT , which makes Bitcoin a Wall Street product now essentially.
My targets on Bitcoin now are $57k and I'm thinking we may even see a 'news driven' selloff to the $50k - GETTEX:52K range into our buy blocks as shown here.
"Show me the charts, I'll tell you the news" is one of my mantras, and with everyone thinking we go higher here, I'm thinking we have one more shakeout to wipe out some longs.
Last week a well-known short posted that he 'gave in and the Bulls Win' showing his $2.5M loss.
Think the games are over? I think not.
So I'm mostly out of the market, holding some SOL and planning to DCA buy lower at levens I mention in the video.
I also dicuss the DXY bounce, Total Market Cap, and why this weekly candle close is important.
Apologies -- the recording stopped when I tried to update one of my alerts, and I have a Labor Day party to finish planning so no time to-record it.
Have a great weekend everyone, and let's see what Tuesday brings when the big Wall Street traders get back from summer vacation and start putting wall-street money to work.

BTC/USDT 1DAY CHART UPDATE !!BTC/USDT is currently trading at $59,599, up by 0.31%. The price is showing some resilience after dipping close to the $58,000 support zone. The Bollinger Bands indicate that BTC is attempting to push higher, with immediate resistance around $60,383. If BTC breaks above this level, it may target the upper trendline at nearly $70,000. However, if bearish pressure resumes, watch for support around $56,497 and the crucial $52,408 level. A successful hold above $59,000 could signal the beginning of a bullish reversal.
Note: This is not financial advice. Stay tuned for further updates and analysis. Thank you!

Expired BTC.USD Weekly outlook. 4th WK AUG 2024Expired BTC.USD Weekly outlook. 4th WK AUG 2024
> BEARISH 📉 HIT
Prior Week Closed Price: 64,511
This Week Target Price: 60,936
Strike Price: 60,273 on AUG 27, 2024

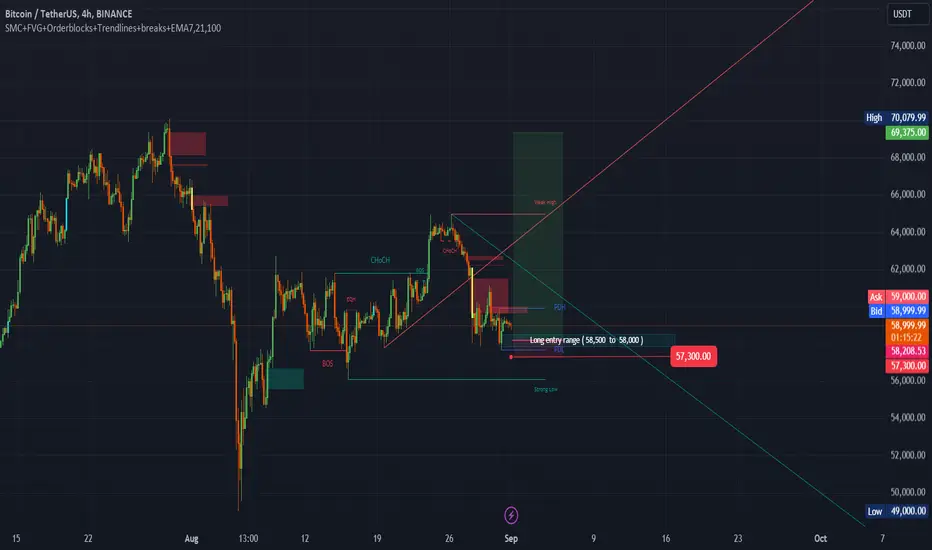
BTC Short Term Swing Short into Bullmarket Long. (56k)In this video, I break down a strategic short-term swing trade that could be catalyzed by the upcoming speech from Federal Reserve Chair Jerome Powell. Such events are known to introduce significant market volatility, offering a prime setup for a potential trade.
We'll analyze key levels that could signal a strong entry point, with a particular focus on a long trade that may pave the way for a broader bullish trend. This analysis aims to position us ahead of market movements, enabling us to capitalize on any emerging opportunities.
Stay tuned as I detail how to approach this setup with precision. If you're looking to enhance your trading strategy and stay ahead of market shifts, this is a must-watch.
Don't forget to follow this channel and enable notifications to stay updated on critical market insights and trading opportunities.

BTC/USDT SHORT UPDATE !!BTC/USDT is trading at $61,295, showing a 1.52% increase as it attempts to break above a key resistance zone. The price is still within a descending triangle pattern, and a breakout above this resistance could signal a potential trend reversal. Key support remains at $52,408, while RSI is currently showing a slightly bullish momentum, but caution is advised as the overall trend remains uncertain.
Note: This is not financial advice. Stay tuned for further updates and analysis. Thank you!

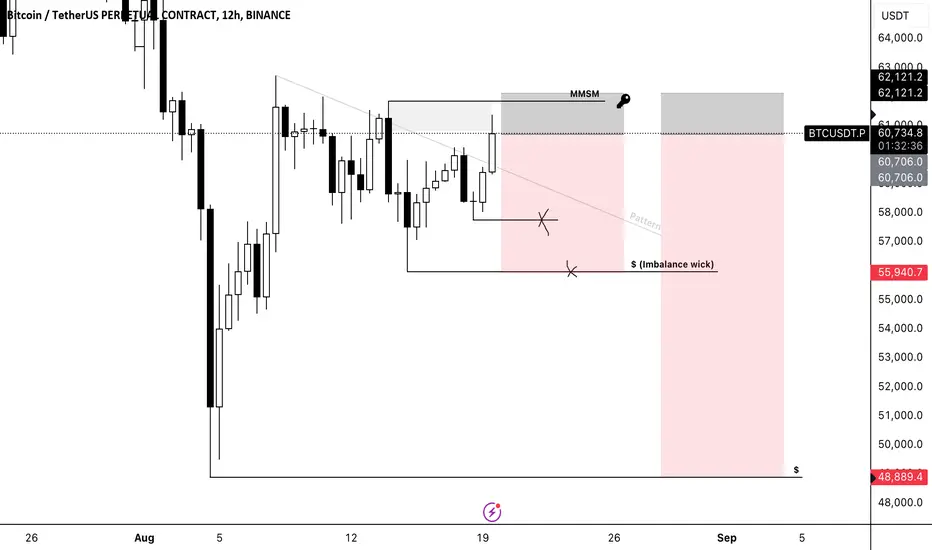
BTC SHORT The chart indicates a potential move where Bitcoin (BTC) is currently testing an area of interest around 60,715.9 USDT. The price is approaching a key resistance zone marked as MMSM, which could provide a selling opportunity if the price fails to break above it convincingly.
Trade Setup:
Stop Loss: Place a stop loss just above the 62,500 USDT level to protect against potential false breakouts above the resistance zone.
The initial target for this trade would be around the 55,940.7 USDT level, where there is an imbalance wick, which could serve as the first point of profit-taking. Further downside targets could be around the 48,889.4 USDT level, representing a more extended move.
Risk/Reward: This setup offers a favorable risk/reward ratio, as the downside potential outweighs the risk if the resistance level holds.
Additional Notes:
- If price breaks and holds above the 62,121.2 USDT level, reconsider the short idea as it would invalidate the current bearish setup/structure.
BTC/USDT 4-Hour Chart Update !!BTC/USDT is testing a crucial resistance zone around $61,400 – $62,000 within an ascending triangle pattern. A successful breakout above this level could lead to a continuation of the uptrend. However, if the price fails to break out, a return to support levels around $58,400 or $52,408 could occur. Traders should monitor volume for confirmation of any breakout.
BTC/USDT 4-hour chart, focusing on key support and resistance levels, moving averages, and chart patterns.
Remember: This is not financial advice. Stay tuned to us for further updates and analysis. Thank you!

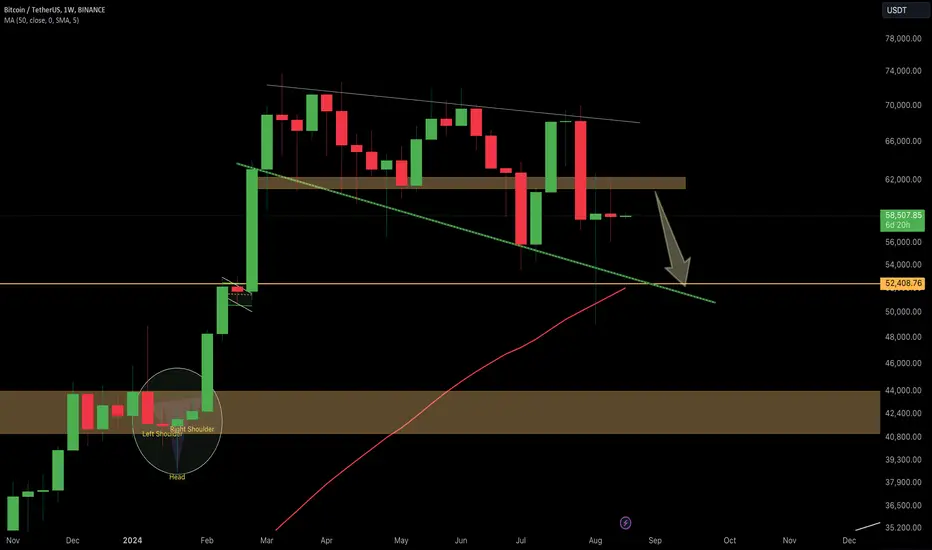
BTC/USDT Weekly Chart Update !!$52,408.76 remains a crucial support level aligned with historical price actions and the lower boundary of the highlighted area.
Immediate resistance is around $60,000.
The next major resistance lies near $62,000, which has served as a crucial level.
The 50-week MA (red line) currently provides long-term support around $52,022.15.
The price is currently trading below the 50-week MA, indicating bearish sentiment on a longer timeframe.
BTC is currently trading within a descending channel, which indicates a bearish trend.
If the price fails to move above the channel's upper boundary, the pattern suggests the possibility of further declines.
The chart also shows a potential head and shoulders pattern that was completed at the beginning of the year, which has led to the current bearish trend. Volume: It is important to monitor volume for confirmation of any major move towards breaking resistance or retesting support levels. Summary: BTC is facing strong resistance around $60,000, and failure to break this level could lead to a retest of the support of $52,408.76. The descending channel and position below the 50-week MA indicate a bearish bias in the long term. Traders should keep an eye on volume spikes and price action near these key levels for further information.
This update provides the latest technical information for BTC/USDT on the weekly chart, highlighting chart patterns and moving averages as well as key support and resistance levels.
Remember: This is not financial advice. Stay tuned to us for further updates and analysis. Thank you!
BTC/USDT 4HOUR CHART UPDATE !!BTC is showing bullish signs as it approaches a critical resistance near $60,000. A breakout above this level could push the price towards $62,000. However, a rejection might lead to a retest of the $57,400 support level. Traders should keep an eye on the next few candles for confirmation of the direction.
This analysis can be updated as price action evolves or more data becomes available.
Remember: This is not financial advice. Stay tuned to us for further updates and analysis. Thank you!

BTC/USDT 4-Hour Chart Short Update. BTC is currently trading around 57,929 USDT after a recent dip. The price appears to be in a descending wedge pattern, which typically suggests a potential bullish reversal if broken to the upside. The chart shows BTC attempting to reclaim higher levels, and a breakout above the wedge could see BTC move toward the 62,000 USDT resistance zone. This is a critical area to watch, as it represents significant resistance that has been held previously.
However, if BTC fails to break above this wedge and continues to move downward, the key support to watch is around 52,408 USDT. A breakdown below this level could trigger further bearish momentum.
Overall, the market is at a pivotal point, and traders should watch for a breakout from this pattern for potential trade setups.
Remember: This is not financial advice. Stay tuned to us for further updates and analysis. Thank you!

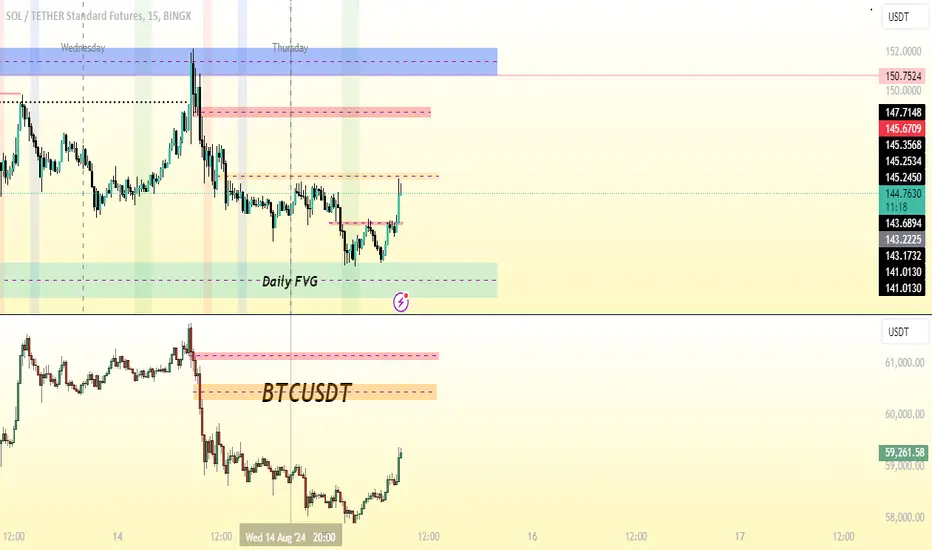
SOLUSDT & BTCUSDT, Thu 15 Aug, Prepare for NY or Pm Sessions!My Range of price of Both showed in chart!
I expected , the price rise up and reach to oone of these FVG`s and
Then start to downward!
I am ready for this, I will only trade SOLUSDT and get confirmation from
BTCUSDT`s Price !
Try to up to date my idea after 9:30!
What do you think?
Please share your comments and ideas with me!
Happy Trade!
BTC/USDT Daily Chart UpdateBTC/USDT is trading at around 60,912 USDT, hovering close to the immediate resistance level at 62,000 USDT. This is a critical juncture for the price action.
Immediate Resistance: 62,000 USDT. A successful breakout above this level could signal a bullish trend, potentially targeting higher resistance levels at 71,462.14 USDT and 73,449.96 USDT.
Immediate Support: Around 58,000 USDT. A break below this level could lead to further declines towards the long-term support at 52,408.76 USDT.
MACD Indicator: The MACD line is slightly above the signal line, indicating a bullish momentum. However, the histogram is relatively neutral, suggesting caution.
Volume and Moving Averages: Traders should closely monitor volume spikes and moving average crossovers to confirm trend reversals or continuations.
The market is at a critical point. If BTC/USDT breaks above 62,000 USDT, it could pave the way for higher targets. Conversely, failure to break this resistance could lead to a retest of lower support levels. Keep an eye on market sentiment and key indicators for potential signals.
Remember: This is not financial advice. Stay tuned to us for further updates and analysis. Thank you!

#BTC/USDT#BTC
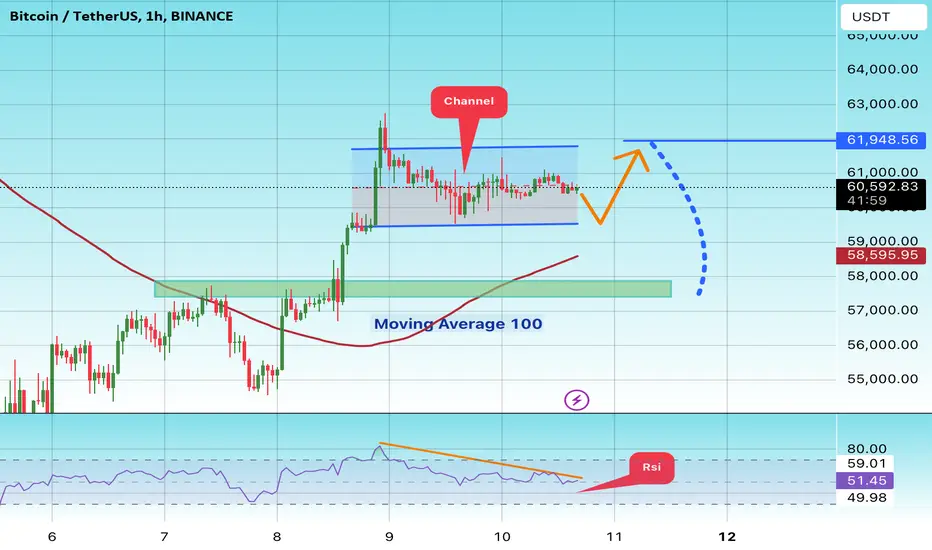
Bitcoin
Bitcoin price is moving in a sideways channel on a 1-hour frame. It is expected that the price will touch the lower limit of the channel at $59,600 and bounce from it upwards to the upper limit of the channel at $61,800. Which is considered a pivot point, which pushes the price down as expected to $57,800, which is a strong support level.
We have a support area in green at $57,800 after the price touched it and bounced from it
We have a trend to stabilize above the moving average 100
We have a downtrend on the RSI indicator that supports the price upwards,
canceling the pattern in the event that the pattern is broken upwards and a candle closes above the $62,000 area, which supports further upwards
BTC/USDT 1DAY CHART UPDATE!!BTC/USDT Daily Chart Short Update BTC/USDT is trading around 58,477 USDT, slightly below the immediate support of 61,100 USDT. This area is crucial, as a sustained break below could lead to further declines towards the long-term support at 52,408.76 USDT. Immediate resistance is at 62,000 USDT, and a breakout above this level could signal a bullish trend, potentially targeting higher resistance levels at 71,462.14 USDT and 73,449.96 USDT.
BTC/USDT Key Levels to Watch: Support: 58,000 USDT, 52,408.76 USDT Resistance: 62,000 USDT, 71,462.14 USDT, 73,449.96 USDT Traders should monitor volume and moving average signals to gauge market sentiment and potential reversals.
Remember: This is not financial advice. Stay tuned to us for further updates and analysis. Thank you!