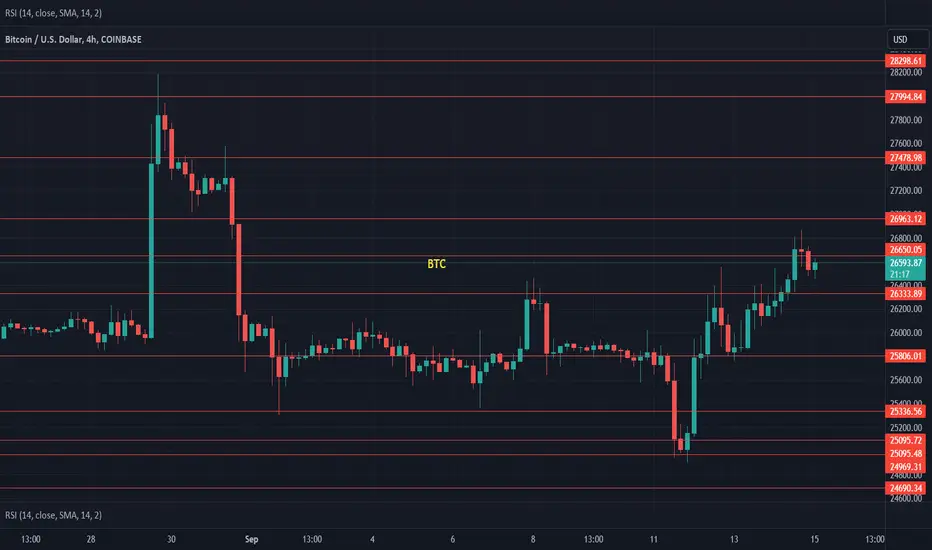
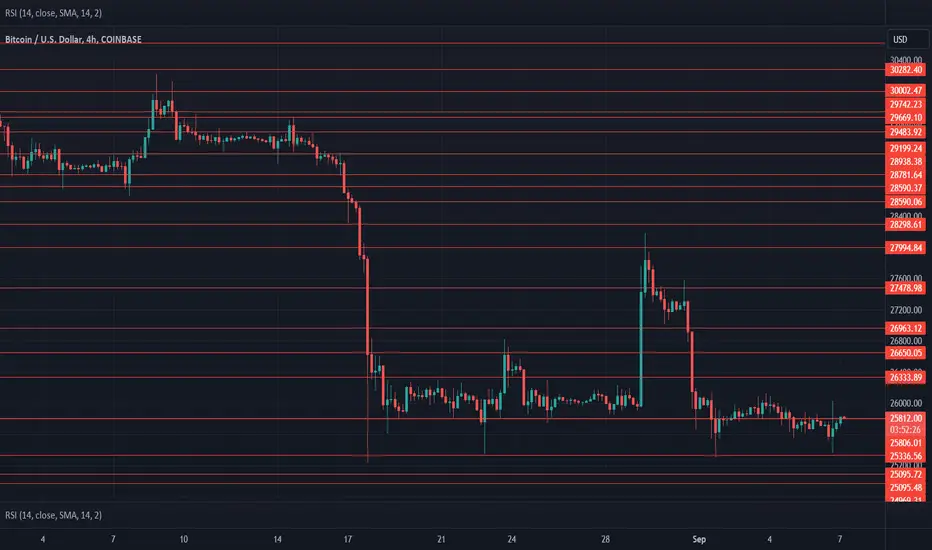
$BTC Daily UpdateCRYPTOCAP:BTC #BTC Broke $26,333 support, moving towards $25,806 support, RSI on 4H oversold, no sign of reversal yet, expect struggle at $26,333-$26,650 area. Previous 4h close looks good - bears were resisted, volume going dry on current 4H, could test $26,333
Btcsignals

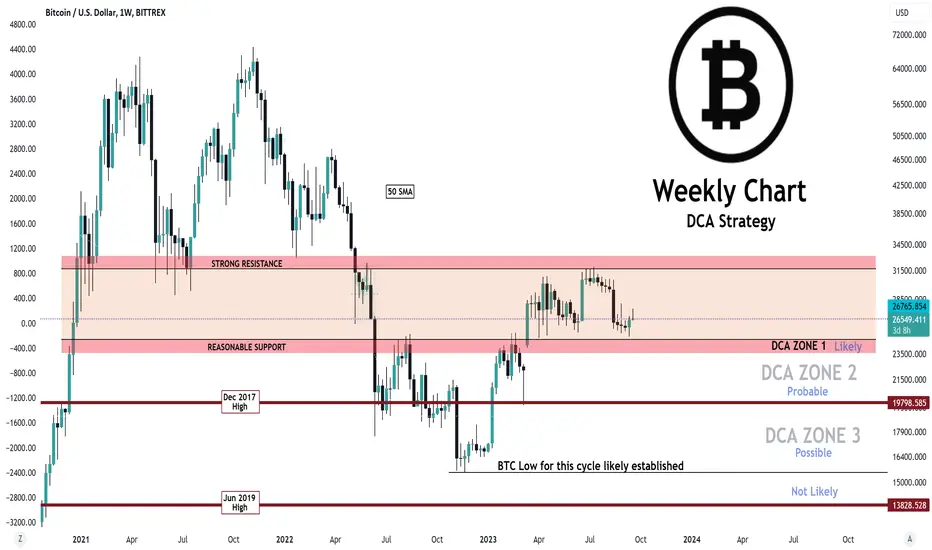
BTC - DCA StrategyI just wanted to share this very quick chart
I am finding that we are at that part of the BTC cycle when people make mistakes, get impatient, give up, loss interest or feel like the cause is lost.
Its so important to realize and take advantage of these quiet periods and outline clear zones of interest.
When I find the patience and hope in me fading ill make a very small purchase and then set a bid, maybe even a large one into Zone 2 at a level im happy with. In the past this has paid dividends.
I hope this rough guide is helpful, patience is the name of the BTC game guys
PUKA
$BTC Daily UpdateMIL:BTC #BTC Reattempted $27,478 as expected, testing $26,963 for a support, holding above $26,650 good sign, previous 4h closed bearish, last 1d closed with beautiful follow up to bullish engulfing from Monday, next resistance $28,298, watch given S/R

$BTC Daily UpdateCRYPTOCAP:BTC #BTC $26,333 support gained, $26,650 resistance testing as expected, $27,478 key resistance to watch for support, $26,650 will be key support if gained.
$BTC Daily UpdateCRYPTOCAP:BTC #BTC Last 4h closed bearish, $26,333 resistance holding, Previous daily closed fine, RSI rising on 1D and 4H, needs volume to push towards $26,650 support. Watch given S/R, FUD coming up with FTX selling it's crypto assets

$BTC Daily UpdateCRYPTOCAP:BTC #BTC pushed thru and gained $25,806 support! $26,333 resisting as expected, previous daily failed to close with bullish engulfing, Must take $26,963 to avoid retrace towards $25,336-$25,095.
$BTC Daily UpdateCRYPTOCAP:BTC #BTC FTX Dump will effect the market as FUD rises, $25,806 given resistance holding strong, $25,336-$25,095 support range which will be weak against FUD, $24,129-$22,379 supports to watch

My prediction for BTCUSD - Correction and continuation upHi Everyone,
Here's my prediction for Bitcoin in the next few months:
By the looks of it, we should see a slowdown in this spike upwards in the next few days, which will then likely form a Dogi candle (#dogicandle) on the Monthly timeframe.
With a Dogi candle in place, we will then start to see a formation of the Evening Start pattern (#eveningstar), which indicates a change in direction.
If these statements are confirmed, we should be seeing a correction from the recent strong bullish momentum - and it could correct towards as low as 19,000 area!!
With a correction towards 19k area, the technical analysis would be showing a double bottom pattern (#doublebottom), which will then indicate that the correction has been completed and the market is ready to move back up and continue to a, hopefully, all time high! (#ATH)
Of course, the speed of this movement will depend on the volume getting into the market and I believe that news could play a key role in bringing these movements into the chart.
Get ready to BUY BTC dips, but you don't need to rush as these patterns should develop throughout the next few months.
Let me know your thoughts!

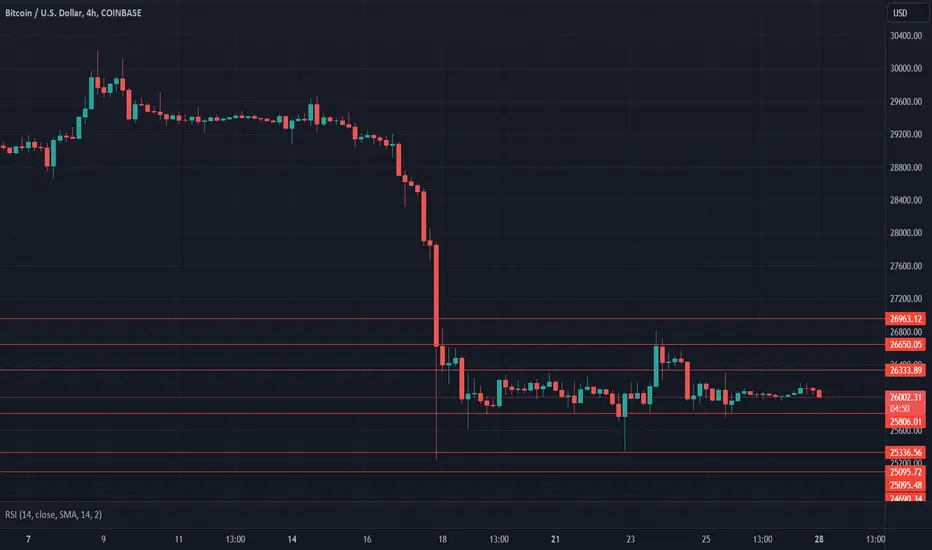
$BTC Daily UpdateCRYPTOCAP:BTC #Bitcoin continues to struggle at $25,806, last 1D close looks fine, bearish engulfing on previous 4H close, volume remains weak. Spent over 10 days below $26,333 now, $27,994 key resistance, $26,963 support required to test, $25,336 current support.
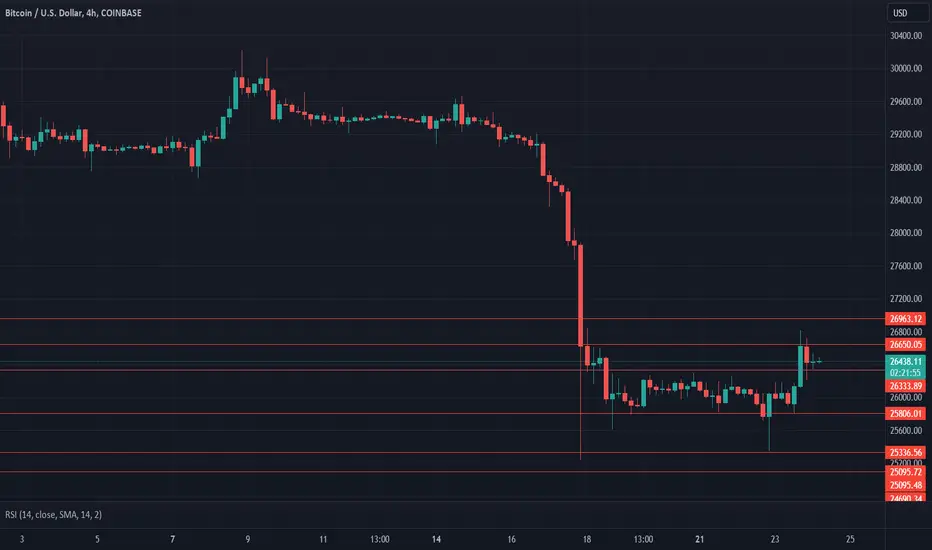
$BTC Daily UpdateCRYPTOCAP:BTC testing $26,333, Previous 4h closed bearish with resistance holding good, bullish engulfing on 1D previous close, gaining $26,650 support will allow to test for $27,478. Watch given S/R

$BTC Daily UpdateCRYPTOCAP:BTC $25,336 support retested, struggling to regain $25,806, $27,478 support required to reattempt at $28,298. Poor volume as it was, watch given S/R
$BTC 1W showing Hidden BullishCRYPTOCAP:BTC 1W showing Hidden Bullish
What Is Hidden Divergence?
Hidden divergence is created when the price of a cryptocurrency carves a higher low, while the indicator creates a lower low. Typically a hidden divergence can also be categorized by a bullish or bearish hidden divergence.
For example, a bullish hidden divergence happens during a correction of an uptrend when the value of an asset makes a higher low. However, the oscillator is still showing a lower low. This usually translates that the bullish trend continuation signals trader to take profit.
Bearish hidden divergence, on the other hand, is the opposite. Meaning the value of an asset makes a lower high, but oscillators are showing a higher high. This signals a trend reversal in which a trader should stop loss and sell-off as soon as possible.

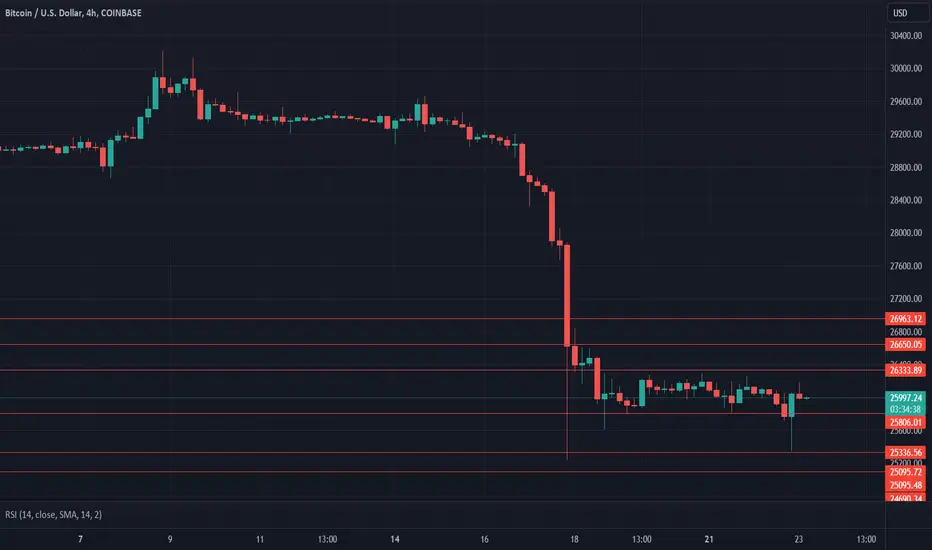
$BTC Daily UpdateCRYPTOCAP:BTC given support at $25,336 in effect, $25,336-$26,333 current range, RSI on 4H and 1D both looking poor awaiting sign of reversal here with very low volume. Watch given S/R
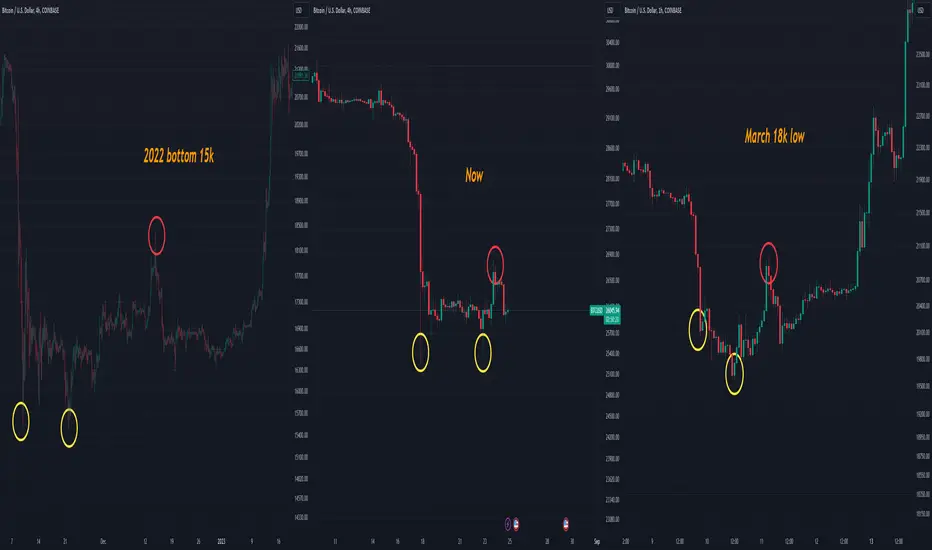
Possible Bottoming pattern forming It is very much possible that Bitcoin is forming a bottom as we speak , we have just had that distribution uptrust after a big move down where everyone thinks its going to reverse and then it comes back into range then everyone panics its going lower.
But really what happens is far more boring , we go back into a range for a breakout later when everyone been rekt both ways.
This bottom pattern appears in many different time frames , the larger the timeframe the bigger the move.
If we do breakdown further , CME gap at 20k is likely to close
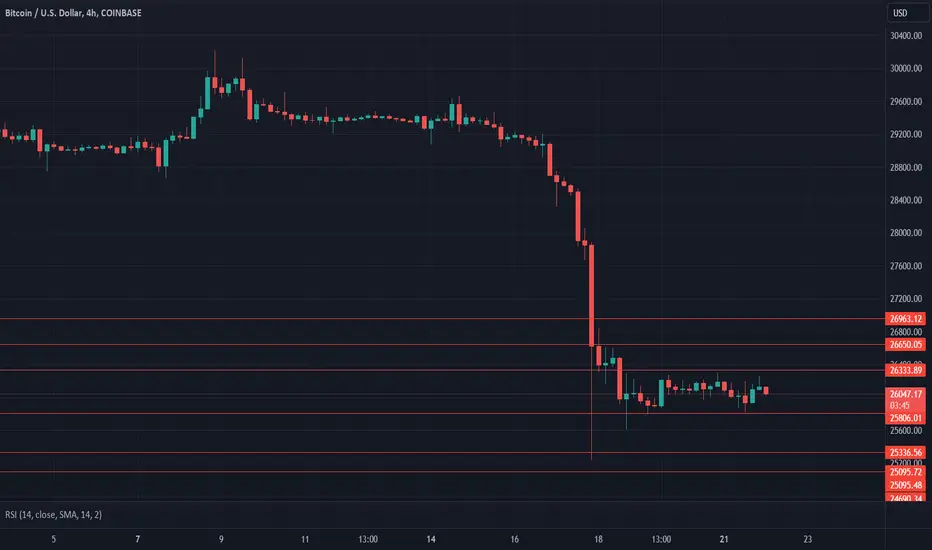
$BTC Daily UpdateCRYPTOCAP:BTC Back between $25,806-$26,333 range, dumped following bearish pin bar on 4H. Weak volume, $25,336 next support. Watch given S/R

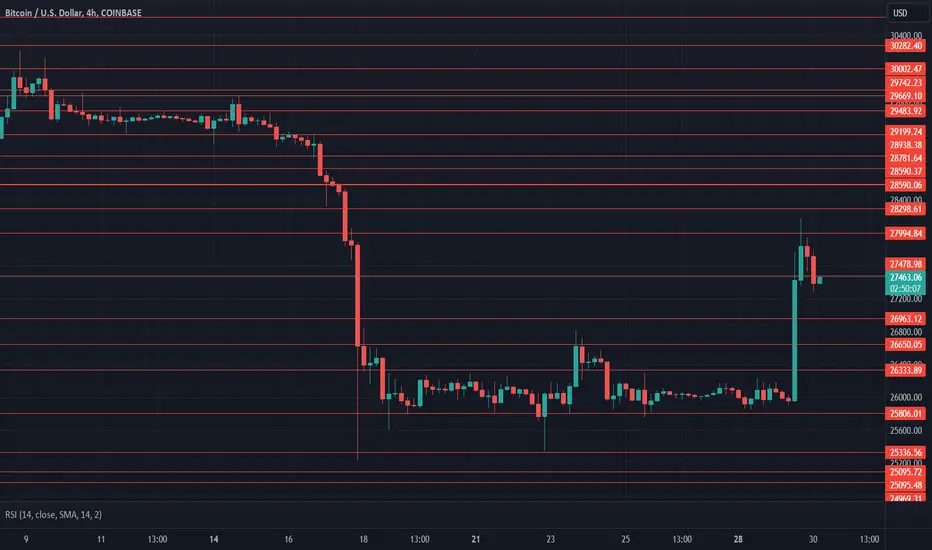
$BTC Daily UpdateCRYPTOCAP:BTC $27,994 resisted, struggling at $27,478 support. RSI on 1D looks good, Must hold $27,478 key support here, Next key resistance at $28,590. Watch given S/R
$BTC Daily UpdateCRYPTOCAP:BTC Given range $26,333-$25,806 remained in effect throughout the weekend, trading oversold on 1D awaiting sign of reversal here to test $26,650-$26,963. Weak on volume, Watch given support and resistance areas
$BTC Daily UpdateCRYPTOCAP:BTC $26,650 resisting, $26,333 support testing. Poor volume, Remains oversold on 1d, Requires $26,963 support.
Bitcoin scalping ideaBINANCE:BTCUSDT.P
Possible Targets and explanation idea
➡️We got Daily FVG marked with levels
➡️On 1H timeframe 3 main pools, 2 of them we swiped
➡️Walk from liquidity to another liquidity. now road to 27761 and 28701
➡️ At this levels need to see price reaction from sellers.
➡️ If there is no reaction road to 35-48 possible in October till May 2024 if we take a look globally
Hope you enjoyed the content I created, You can support with your likes and comments this idea so more people can watch!
✅Disclaimer: Please be aware of the risks involved in trading. This idea was made for educational purposes only not for financial Investment Purposes.
---
• Look at my ideas about interesting altcoins in the related section down below ↓
• For more ideas please hit "Like" and "Follow"!

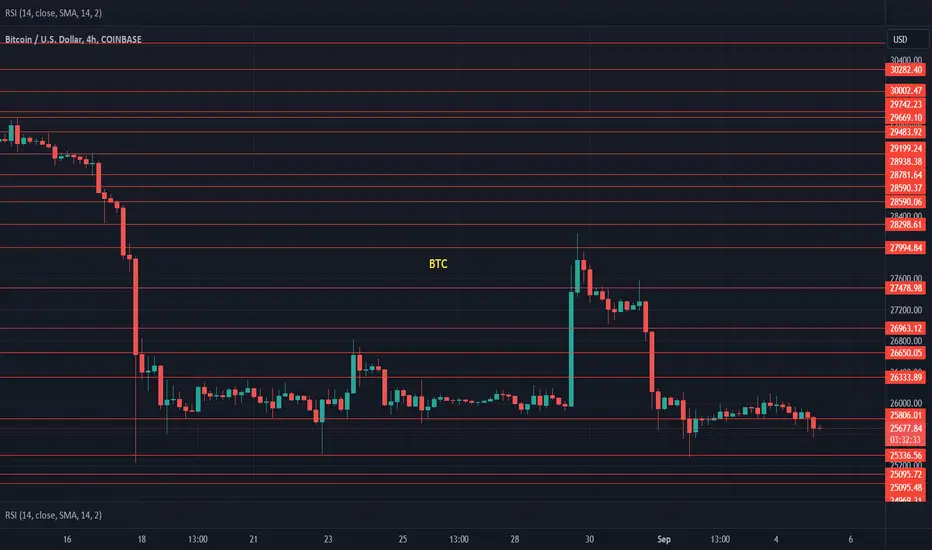
$BTC Daily UpdateMIL:BTC Continues to move sideways as expected, given range $26,333-$25,806 remains in effect, Previous 4h closed bearish but 1D close looks good, 1D RSI oversold, Volume remains weak, no direction defined yet.
$BTC Daily UpdateCRYPTOCAP:BTC $26,333-$25,806 range in effect, given support at $25,806 holding. Previous 4h closed bearish, current 4H with possible bearish engulfing. 1D closed with bullish pin bar - Very weak volume, expecting little more sideways movement here.
BTC/USDT D ( downtrend & longterm ) BINANCE:BTCUSDT
Hey there dear attendants
It will be a pleasure if you could brace me with your supportive likes & comments if you would have tested my strategies
According to my analysis the downtrend of btc has been started and we should wait for 17000
is not financial advice

Bitcoin (Gann Fan Update)Its a very important time for Bitcoin in my opinion , within the next 8-10days we will get a large move above or below the 1/1 Gann , for weeks now we have been holding just under it.
Here is a zoomed in view on the daily.
As you can see we reach this apex 24th of August 2023 , of course its also possible we trickle sideways above the 1/1 but historically breaking the 1/1 on Bitcoin during this part of the cycle we get some type of action.
2015
If we go back and take a look on how price reacted to the 1/1 we can see a lot of violent swings ranging from 25-40%.
2019
This year was had way more reactions to the 1/1 and almost everytime it resulted in fairly large swings , this time ranging 45-60%.
2023
So for this year we have touched 1/1 once and it was the local high of the year , candle closed right on it.
2/1 Gann and Time
The bull market doesn't start until we break and hold support the 2/1 , the last two cycles it has taken about the same time 640days .
So if it repeats Bitcoin would be somewhere around 36500 during this period.
We also know it takes about 750 days from cycle low to reach previous cycle high.
So that would be Bitcoin back at 69k sometime in December 2024.
Conclusion
If the cycle repeats the Bull market will start sometime August 2024 at 36500 and Bitcoin will reach previous cycle high at 69k December 2024 which would then make a new cycle high October 2025.
