BITCOIN Three Ph-Model started a new mega Cycle. $280k possible?This is a very radical approach to Bitcoin's (BTCUSD) Cycle Theory as it expands on the notion that BTC has so far had only two (mega) Cycles instead of the traditional view of four (smaller ones), which is an idea we have analyzed quite a few times in the past. Radical but as the analysis shows not unrealistic, since each Cycle shares common parameters with the other one that haven't been broken.
** The Pivot line and the Three Phases **
As this 1W chart shows, each Cycle has a Pivot trend-line, which is the essence of the model as it is the piece that is holding together the three different Phases. Those (mega) Cycles start with the Take-off phase (blue Triangle), a rally which is the most aggressive part of the Cycle. The Pivot line is the Support during the Take-off Phase.
Then with the 1W RSI curving, it transitions to the Expansion phase (green Arc), which is also rally but less aggressive that eventually forms the top of the Cycle. The Pivot line is the Resistance during the Expansion phase.
The third and final phase starts after the Cycle top, the Correction phase (red Channel Down), which is the pull-back of those tow rally phases that finds Support on the 0.236 Fibonacci retracement level. Towards the end of Correction phase, the 1W RSI almost flattens as it turns sideways at the lowest level of this three-phase Cycle. This is the Accumulation period where investors start buying Bitcoin again on those low prices.
** Fibonacci levels **
Apart from the horizontal Fibonacci levels, the most important of which is the 0.236 Fib that offers Support on the Correction phase, we have incorporated the Time Fibs that assist at providing a better perspective as to which part of the Cycle we could approximately be at. As you see, between Fib 0.5 - 0.618, the Expansion phase's first rally starts and after Fib 0.786 the final rally of the Expansion phase takes place.
Based on this model, Bitcoin is on Level Zero (circle) which is the starting point of the Take-off phase, meaning that we are starting the Third ever Mega Cycle.
As for what the top of this new Take-off phase might be? The December 2017 top of that Take-off phase was marginally above the -0.236 Fibonacci extension of the Cycle before it. The new -0.236 Fib is around $280000.
Do you agree? What are your thoughts on that? Feel free to let us know in the comments section below!
-------------------------------------------------------------------------------
** Please LIKE 👍, FOLLOW ✅, SHARE 🙌 and COMMENT ✍ if you enjoy this idea! Also share your ideas and charts in the comments section below! **
-------------------------------------------------------------------------------
💸💸💸💸💸💸
👇 👇 👇 👇 👇 👇
Btcsignals

BITCOIN Radical Grid Fibonacci analysis you've never seen beforeAs Bitcoin (BTCUSD) has taken a short-term paus on its early 2023 rally on the 1W MA50 (red trend-line), following the first Golden Cross on the 1D time-frame since May 2020, we naturally go back to the start of the previous Bull Cycle in 2019 to see how it behaved on this important stress test.
** The 2019 Bull Cycle **
As you see, BTC also took a sideways pause on its 1W MA50 in April 2019, also after a 1D Golden Cross, while being above the 0.236 Fibonacci retracement level (blue dotted trend-lines) of its Cycle High. So far the current Cycle with 2019 are identical.
** The Channel Fibonacci levels **
We decided to take this symmetry a step forward in order to get a better understanding of how the new Cycle may play out. We have applied the Fibonacci Channel (green trend-line) starting of course from the December 2017 High. As you see, the Cycle's 1st rally, which is what we are experiencing now, firmly traded within the 0.5 - 0.618 Channel Fibonacci levels (green) before getting rejected on the 0.786 horizontal Fib (blue). The Cycle's 2nd rally, which was the final and most aggressive part of the Bull Cycle, was within the 0.786 - 0.936 Channel Fibs (green).
** The Time Fibonacci levels **
Besides the Channel and horizontal Fibs, we have incorporated the Time Fibs (black vertical lines). Starting from the top of the previous Bear Cycle (December 2017) and ending at its bottom (December 2018), we see that it has more or less classified each part of the Cycle and even caught pretty well the next Bear Cycle, roughly within Time Fib 4.0 - 5.0.
Based on that model, the new Cycle's 1st rally should be within Time Fib 5.0 - 6.0 and the 2nd rally some time after Time Fib 6.0. It is widely known that the Halving events (supply shock for Bitcoin) is what officially start the final rallies. In 2020 that was in May and the next one (Halving 4) will be in March 2024.
** Conclusion **
Based on the above parameters put together, we are now experiencing Bitcoin's 1st rally of the new Bull Cycle, within Channel Fibs 1.5 - 1.618. The 2nd rally should start fundamentally after March 2024 (Halving 4), but technically it can do so if the price closes a 1D (or even better 1W) candle above horizontal Fib 0.786. By Time Fib 7.0, the market should have made a new All Time High (i.e. be above $69000) and by Time Fib 8.0 already place the new Cycle Top.
Do you agree with the projections suggested by this Fibonacci Grid Model? Feel free to let us know in the comments section below!
-------------------------------------------------------------------------------
** Please LIKE 👍, FOLLOW ✅, SHARE 🙌 and COMMENT ✍ if you enjoy this idea! Also share your ideas and charts in the comments section below! This is best way to keep it relevant, support us, keep the content here free and allow the idea to reach as many people as possible. **
-------------------------------------------------------------------------------
💸💸💸💸💸💸
👇 👇 👇 👇 👇 👇

BTC Short idea BINANCE:BTCUSDT
Nice and simple SHort set up idea at the moment quick trade!
BINANCE:BTCUSDT
BTCPERP NEAR FUTURE ANALYSIS (4H Chart)Technical Analysis Summary
BTC /USDT
TREND ANALYSIS
We have 1 Downtrend in red color .
We have 1 Uptrend in Green color .
Be careful trends need to be modified when broken to the new peaks (Downtrend) and lows (Uptrend).
FUTURE PREDICTIONS
We have many resistance and support levels that I have mentioned above.
I use thickness as an indicator of strength of levels (ONLY FOR VISUALS).
White levels Levels are very tight stop losses that could be used in high leverage future trading.
Good luck everyone, stay safe!
If you need help don't hesitate to send me a message or comment
If you find this content beneficial please don't forget to LIKE and FOLLOW
Trading Involves High Risk
Not Financial Advice
Exercise Proper Risk Management

BTC LOng setup idea (15 Min Chart) BINANCE:BTCUSDT
Here's a possible quick LONG trade setup idea !
BINANCE:BTCUSDT

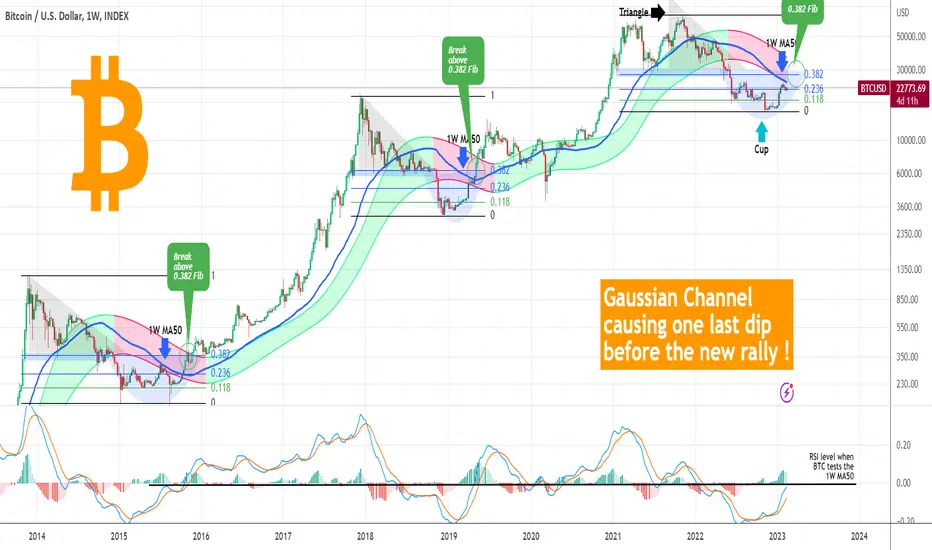
BITCOIN The Gaussian Channel, last barrier before the new rallyBitcoin (BTCUSD) has been pulling back since the start of the month as it came close to the 1W MA50 (blue trend-line) but as it failed to break it, it got rejected. This is putting a pause to the January rally and on the 1W time-frame a very interesting pattern is emerging.
Based on the Gaussian Channel, this is a recurring pattern, a formation which combined with the Fibonacci retracement levels, has been seen as the start of both previous Bull Cycles (2015 and 2019).
** Triangle into Cup recovery and the importance of the 0.382 Fibonacci **
First of all, as you see, all Bear Cycles have started with a Triangle pattern and after the Support of the first Bear Low broke, they collapsed aggressively. As the Bear Cycle bottomed, the collapse started to reverse within a Cup pattern (U-shaped recovery). A break and 1W candle closing above the 1W MA50, confirmed the extension of the initial bottom rally into the new rally of the Bull Cycle. Notice how the 0.382 Fibonacci level was the 'Support of the first Bear Low' we talked above and once it broke caused a strong spike and later served as a Support itself.
** The Gaussian Channel and the LMACD **
This time the Gaussian Channel's bottom is exactly on the 1W MA50 with the 0.382 Fib not that far above them. As a result a break into the Gaussian Channel this time will result into all major Resistances breaking almost at once. Also it is very interesting to look at the 1W LMACD and how every time BTC tested the 1W MA50, it was on the 0.00 level. Every time it closed above the 1W MA50, the LMACD broke above the 0.00 as well.
** Where to buy now? **
It is worth noting that after the July 2015 1W MA50 rejection, the price fully filled the gap of the January 2015 Bear Bottom. But that was entirely due to the Bitfinex hack on August 17 2015. Had it not been for this, the pull-back would have been contained on the 0.236 Fib or at the very worst, the 0.118 Fib (green level). In April 2019 for example, during that 1W MA50 rejection, the price was supported by the 0.236 Fib. For comparison purposes, the current 0.118 Fib is at $18800. See the chart below, we have made the comparison of the FTX and Bitfinex crashes back in November 14 when the market was at its highest Fear level and nobody expected a rebound. So far it has been playing out very accurately:
It is easy to understand that we are near a critical Resistance cluster, which if broken will start the next rally phase and Bitcoin won't look back.
Are you waiting for max pain at $18.8k to get in or you have bought already? Feel free to let us know in the comments section below!
-------------------------------------------------------------------------------
** Please LIKE 👍, FOLLOW ✅, SHARE 🙌 and COMMENT ✍ if you enjoy this idea! Also share your ideas and charts in the comments section below! This is best way to keep it relevant, support us, keep the content here free and allow the idea to reach as many people as possible. **
-------------------------------------------------------------------------------
💸💸💸💸💸💸
👇 👇 👇 👇 👇 👇
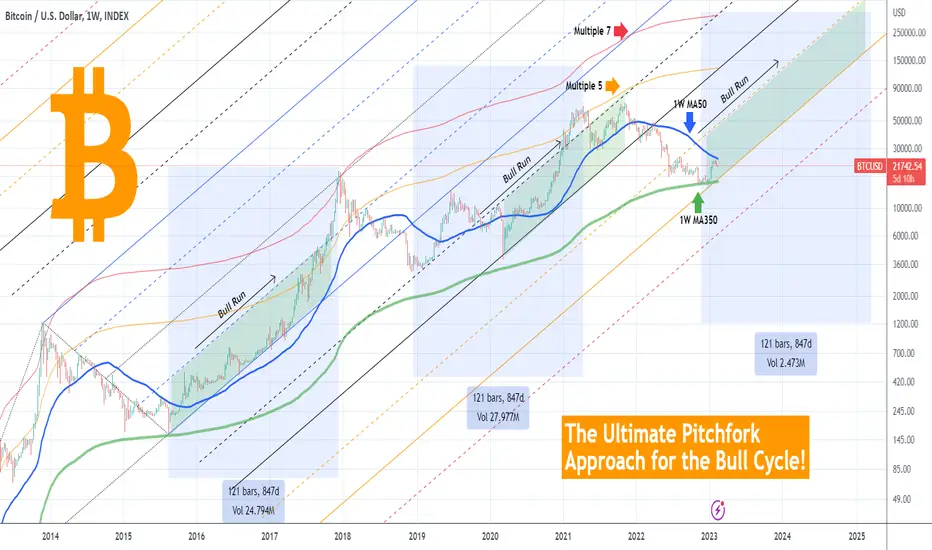
BITCOIN The Pitchfork approach that reveals the Bull Run!Why don't we see the Pitchfork tool applied to Bitcoin (BTCUSD)? We show on today's analysis that this often very overlooked technical tool has been particularly spot on at identifying BTC's Bull Runs.
It is a simple application and we will keep the commentary that way. As you see on this 1W time-frame, we have applied the Pitchfork from Bitcoin's first Low to the 2014/15 Bear Cycle. As you see the Fibs drawn, provide an excellent framework for the majority of the Bull Cycle's trajectory:
* The 2015-2017 Bull Run was almost entirely within the 0.5 (dashed blue trend-line) and 1.0 (solid blue) Fibs, until it broke in the final month of the Bull Cycle to peak on the FibMA Multiple 7.
* The 2019-2021 Bull Run started off more aggressively as it was initially hyped by the Libra news but later corrected within the 1.5 (dashed black) and 2.0 (solid black) Fibs.
* The new Bull Run has started after the November (FTX crash) bottom and is now within the 2.5 (dashed orange) and 3.0 (solid orange) Fibs. This should technically by the new Channel Up for the new Bull Run.
It appears that each Bull Run is a whole 1.0 Fib level lower than the previous one. This is consistent with Bitcoin's Theory of Diminishing returns over time.
Also all bottoms hit or came extremely close to the 1W MA350 (bold green line).
We can estimate in addition a rough 121 week (847 day) time range from the bottom of the Cycle to the Top of the top of the next one. This gives us a projection for the next Cycle Peak on March 2025.
As for what price the actual Top can hit? Moderate scenario the Multiple 5 (orange) and aggressive scenario the Multiple 7 (red).
Do you agree with the conclusions of this Pitchfork approach? Feel free to let us know in the comments section below!
-------------------------------------------------------------------------------
** Please LIKE 👍, FOLLOW ✅, SHARE 🙌 and COMMENT ✍ if you enjoy this idea! Also share your ideas and charts in the comments section below! This is best way to keep it relevant, support us, keep the content here free and allow the idea to reach as many people as possible. **
-------------------------------------------------------------------------------
💸💸💸💸💸💸
👇 👇 👇 👇 👇 👇
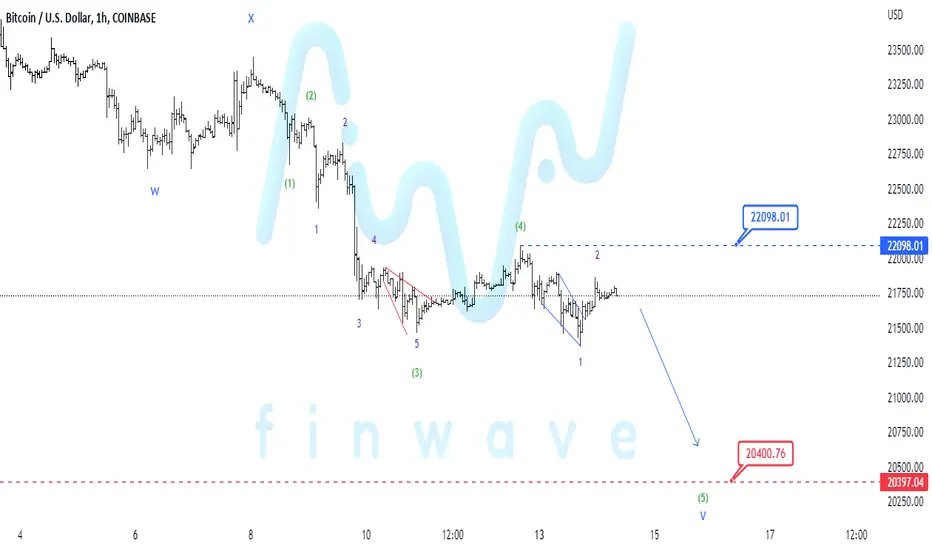
Financial Wave. BTCLet's consider Bitcoin movement in more detail. Our priority variant remains the same, continuation of decrease in a small wave (5) can lead the price of BTC to 20400$, growth of the price above 22098$ cancels this scenario.
BITCOIN Death Cross targeting the 1D MA50 based on the DXYBitcoin (BTCUSD) is about to form a Death Cross pattern on the 4H time-frame, which is when the 4H MA50 (blue trend-line) crosses below the 4H MA200 (orange trend-line) thus making short-term selling pressure stronger than buying. The pattern as you see is a Channel Down ever since the February 02 High and the Support Zone is 20700 - 20420. This is where the 1D MA50 (green trend-line) is headed to, which is Bitcoin's long-term Support during uptrends.
At the moment as you see the 4H MA200 is acting as the Resistance. But it is the developments on the U.S. Dollar Index (DXY), the chart on the right, that is spearheading this move on BTC. It just formed a 4H Golden Cross (the opposite of the Death Cross = bullish) and as shown, the price is breaking above the Channel Down that has been trading in since the November 21 High. A break above the 103.980 Resistance (1), most likely targets Resistance 2 (105.650). The 1D RSI being on Higher Highs while the price was on Lower Highs (i.e. a Bullish Divergence) is evidence that a break-out is about to take place.
In conclusion, a direct hit of BTC within the 20700 - 20420 Support Zone and more importantly on the 1D MA50, would be the most optimal medium-term buy entry, especially if this is coupled with the 1D RSI turning oversold (30.000 level).
Would that be a good enough level for you to buy for the next wave upwards? Feel free to let us know in the comments section below!
-------------------------------------------------------------------------------
** Please LIKE 👍, FOLLOW ✅, SHARE 🙌 and COMMENT ✍ if you enjoy this idea! Also share your ideas and charts in the comments section below! This is best way to keep it relevant, support us, keep the content here free and allow the idea to reach as many people as possible. **
-------------------------------------------------------------------------------
💸💸💸💸💸💸
👇 👇 👇 👇 👇 👇

📉BTC is ready for a downward trend📈BINANCE:BTCUSDT
COINBASE:BTCUSD
Bitcoin analytical series S01E05!!!
Hello traders, Don't forget to risk-free your positions.
Please share ideas and leave a comment,
Let me know what's your idea.
CrazyS✌
BITCOIN Alignment of Cycles is the Ultimate Cheatsheet!We have done similar studies before, aligning past Bitcoin (BTCUSD) Cycles to get a projection of the current one. We have used Halvings, Peaks, Bottoms etc but this is the first time that we don't just use everything into one mega analysis, but also incorporate the Fibonacci retracement and extension levels that show not only the Buy Zones put also the peak projection, making this study the Ultimate Cheatsheet!
** Cycles Tops and Bottoms **
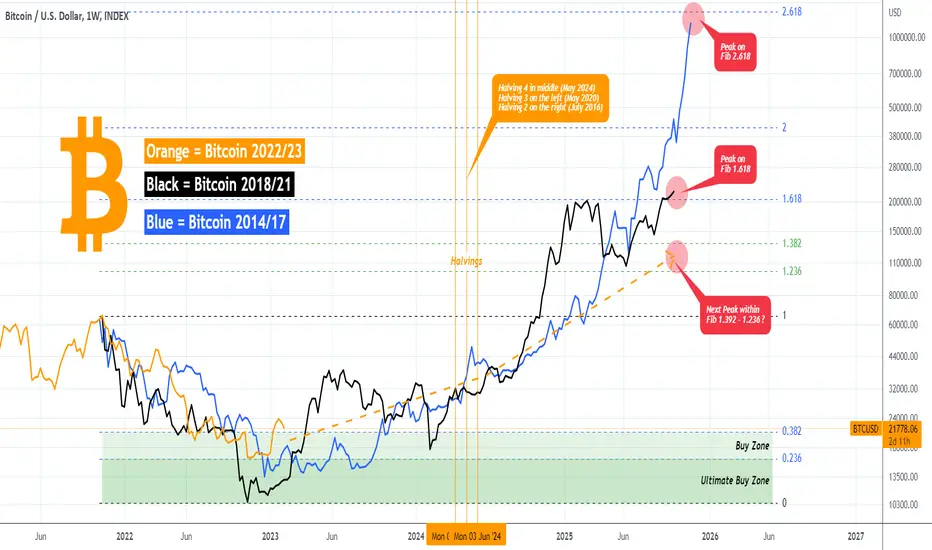
The chart is pretty much self-explanatory. The time-frame on the 1W (weekly) and the starting point of all Cycles (we use the past 3, the first one is too aggressive to be relative for conclusion on this study), is their respective Tops/ Peaks. We didn't distort any Cycle, all are just they way given by the Bars Pattern on their log scale. The orange trend-line represents Cycle 2022/23 (the current one), the black trend-line represents Cycle 2018/21 and the blue trend-line represents Cycle 2014/17.
** Cycle Convergence - Divergence and the Buy Zones **
As you see, their alignment during their Bear Phase of their Cycles is remarkably tight, as the don't diverge by as much as one would expect. With the use of the Fibonacci levels, taking as Fib 0.0 the bottom of the 2018/21 Cycle (Black), we can designate two Buy Zones: The first one within Fib 0.382 - 0.236 and the Ultimate within Fib 0.236 - 0.0. As you see the current Cycle made a bottom and bounced just over the Ultimate Buy Zone.
What's really interesting, is that the 2014/17 (Blue) and 2018/21 (Black) Cycles always converged after a divergence, which simply indicates the standard nature of the course of each Bull Cycle. We have to mention at this stage that the big divergencies of the 2018/21 Cycle was first on the April - June 2019 rally due to Facebook's Libra enthusiasm/ speculation and second September - March 2020 due to the massive money printing and rescue packages to stimulate the economy from the COVID lockdowns.
** The amazing Halving Symmetry **
We have also incorporated the Halvings and as you see the symmetry is astonishing as all there are within a 2 month range. Halving 4, which is the next one is in the middle (May 2024), Halving 3 is on the left (May 2020) while Halving 2 is on the right (July 2016). This is just another demonstration of Cycle stability. Keep in mind that the Halving events are major cyclical events for Bitcoin as they cause a Supply Shock, thus stimulating the Demand. It is no coincidence that the Phase of the Parabolic Rallies has always started after the Halving.
** Where will this Cycle Peak? **
As for the projected peak, since every Cycle offers diminishing returns, the Peak is (or should be) lower each time. The 2014/17 Cycle (Blue) peaked on the 2.618 Fibonacci extension and the 2018/21 (Black) peaked on the 1.618 Fib. The next range in line is the 1.382 - 1.236 Fib Zone, which is approximately within $100k - $132k. A projected path (orange dotted line) to this Target Zone doesn't again diverge much from the other Cycles.
We have to also account for outside fundamentals/ news, moving the projected trend higher if news like those in 2019 (Libra) or 2020 (stimulus) inject a new wave of enthusiasm into the market. For that reason, we have added a projected path to an extremely positive scenario (see chart below) than trends in the middle of the Black and Blue Cycles and shows a Peak above Fib 1.618, roughly above $250k. Unrealistic or not, it is a projection taken from this specific model.
Do you think this is the Ultimate Cheatsheet for Bitcoin or not? Feel free to let us know why in the comments section below!
-------------------------------------------------------------------------------
** Please LIKE 👍, FOLLOW ✅, SHARE 🙌 and COMMENT ✍ if you enjoy this idea! Also share your ideas and charts in the comments section below! This is best way to keep it relevant, support us, keep the content here free and allow the idea to reach as many people as possible. **
-------------------------------------------------------------------------------
💸💸💸💸💸💸
👇 👇 👇 👇 👇 👇
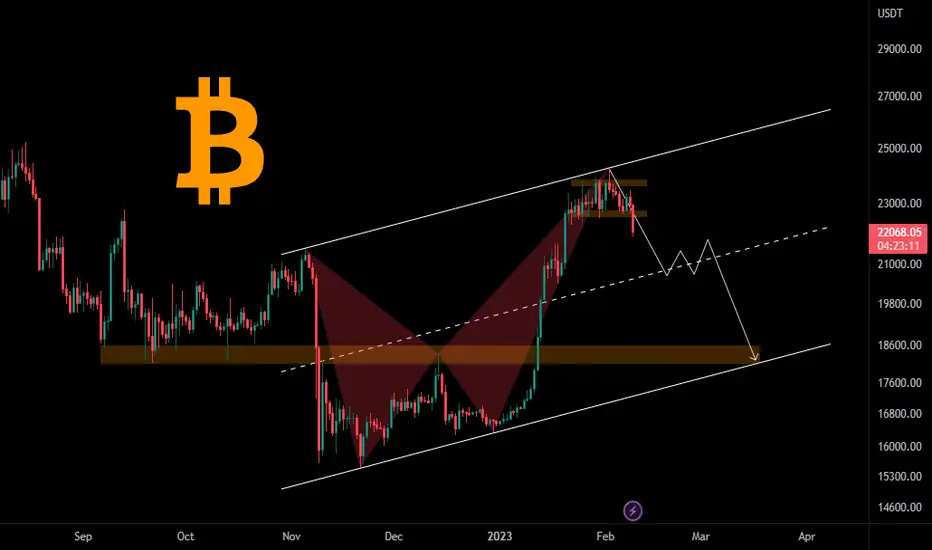
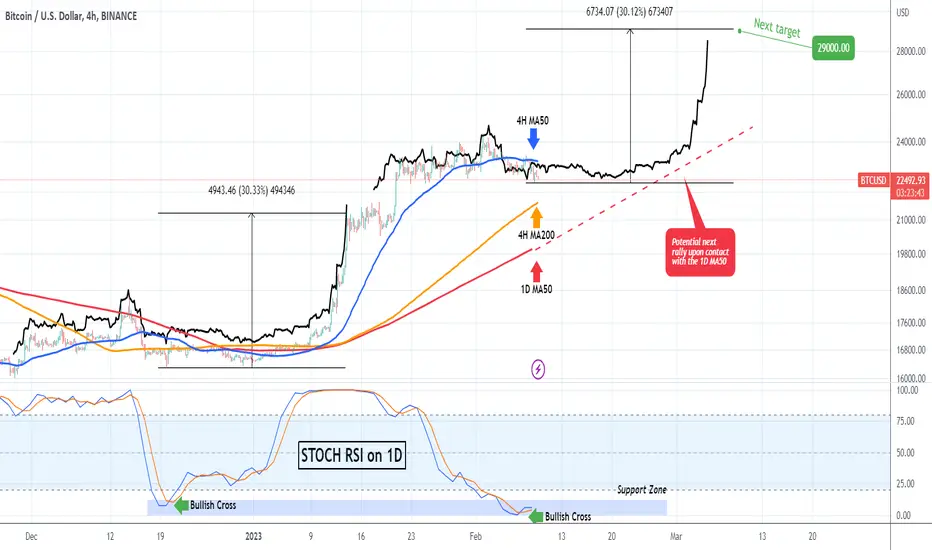
BITCOIN is having a consolidation similar to December.Bitcoin (BTCUSD) got rejected yesterday on the 4H MA50 (blue trend-line) and fear seems to be returning to the market for no particular reason. The price is above both the 4H MA200 (orange trend-line) and more importantly the 1D MA50 (red trend-line), which is the long-term Support during bull runs.
The STOCH RSI on the 1D time-frame made a Bullish Cross inside its oversold Support Zone and the last time we had a similar occurence was on December 20. That was again with the price below the 4H MA50. It consolidated until December 30 after which Higher Highs/ Higher Lows started, until the Parabolic Rise of January.
The Bars Pattern of December - early January fits very well the price action from January 20 until today. In fact it matches perfectly a projected contact with the 1D MA50 (which as mentioned is the long-term Support) and timing a January-like rally ideally.
A +30% rally from yesterday's low gives a medium-term target of $29000. Would you agree?
-------------------------------------------------------------------------------
** Please LIKE 👍, FOLLOW ✅, SHARE 🙌 and COMMENT ✍ if you enjoy this idea! Also share your ideas and charts in the comments section below! **
-------------------------------------------------------------------------------
💸💸💸💸💸💸
👇 👇 👇 👇 👇 👇
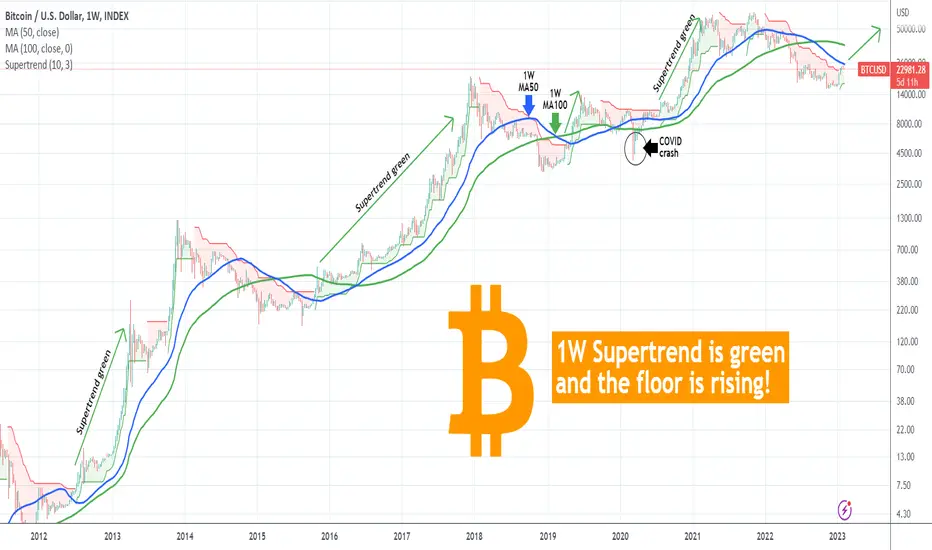
BITCOIN 1W Supertrend is bullish and not looking back!We have used the Supertrend indicator on Bitcoin (BTCUSD) extensively, especially on lower time-frames with great accuracy. This time we take a look on the 1W chart where the Supertrend has been green since the second trading week of January. Throughout BTC's history every time the Supertrend turned green after such an RSI rebound, the bottom of the Bear Cycle was formed.
The strength on such Supertrend rallies is normally so strong that the price typically rarely breaks or more importantly closes below the supporting line (floor). Bright exception has been of course the build up to the 2022 COVID crash (which as mentioned countless times is a 1 in 100 years event, thus an irregularity).
This 'floor' of the Supertrend has now been lifted to $17240, which was unthinkable in e.g. December as it was a Resistance. Traditionally we don't see immediately pull-backs to the floor on the first Bull Cycle rally. Instead, when the price breaks above the 1W MA50 (blue trend-line), BTC has always reached the 1W MA100 (green trend-line) before a major Bull Cycle pull-back.
The 1W MA100 is currently at 36150 (and falling). So with the 1W MA100 around 36k and the Supertrend's floor at 17.2k and rising, does that look like a solid Risk/ Reward ration trade for you or not?
Feel free to let us know in the comments section below!
-------------------------------------------------------------------------------
** Please LIKE 👍, FOLLOW ✅, SHARE 🙌 and COMMENT ✍ if you enjoy this idea! Also share your ideas and charts in the comments section below! This is best way to keep it relevant, support us, keep the content here free and allow the idea to reach as many people as possible. **
-------------------------------------------------------------------------------
💸💸💸💸💸💸
👇 👇 👇 👇 👇 👇
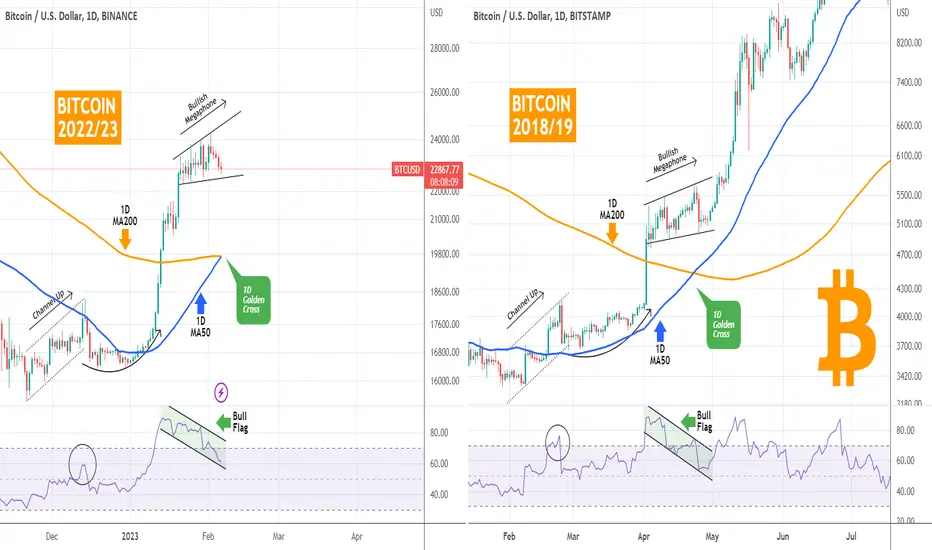
BITCOIN Perfect structural repeat of the 2019 rally?On the previous analysis we talked about Bitcoin's (BTCUSD) emerging Golden Cross on the 1D time-frame and how it is clashing with the emerging Death Cross on the 1W time-frame. Well the 1D Golden Cross has been formed today and automatically draws our attention to the 1D Golden Cross of April 23 2019. This was formed just after the early 2019 rally begun. So the question that pops out is this: 'Is BTC repeating this rally?'.
So far we can surely say that the structure since the November 21 2022 bottom resembles almost perfectly that from January 29 2019 to April 23 2019 and that 1D Golden Cross. As you see on the chart, both sequences started with a Channel Up on the 1D MA50 (blue trend-line), then consolidation before a hyper aggressive wave that broke above the 1D MA200 (orange trend-line) that later formed the Bullish Megaphone pattern that led us to the Golden Cross of today. RSI wise we are on the very same Bull Flag along the price's Megaphone.
Following the Golden Cross, the 2019 structure rose another +150% from the day of the Cross to the June 26 2019 High. Obviously that rally isn't easy at all to be recreated as it was additionally fueled by the Libra fundamentals and a +150% rise from today's lows would put the peak of the rally at $57000.
Unrealistic or not, it is yours to judge, so feel free to let us know of your opinion in the comments section below! Are we repeating the 2019 rally?
-------------------------------------------------------------------------------
** Please LIKE 👍, FOLLOW ✅, SHARE 🙌 and COMMENT ✍ if you enjoy this idea! Also share your ideas and charts in the comments section below! This is best way to keep it relevant, support us, keep the content here free and allow the idea to reach as many people as possible. **
-------------------------------------------------------------------------------
💸💸💸💸💸💸
👇 👇 👇 👇 👇 👇
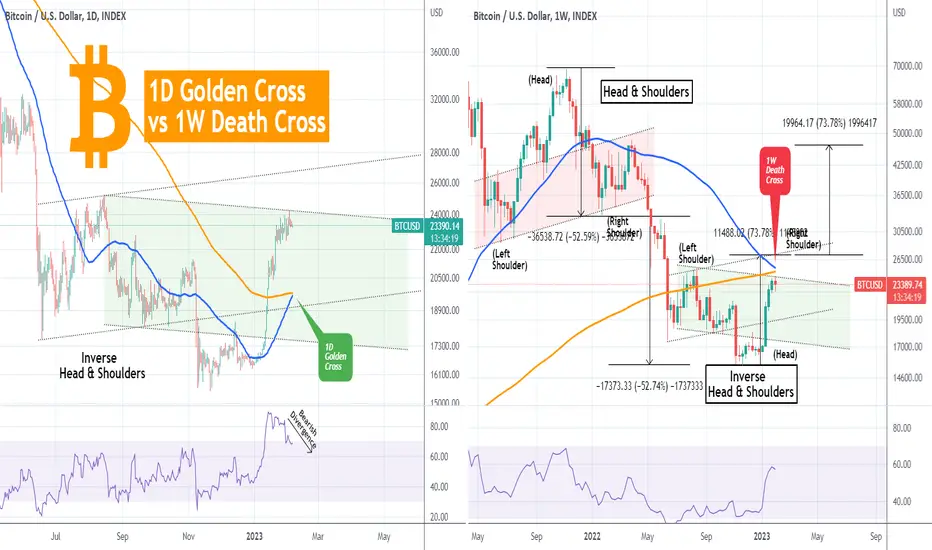
BITCOIN 1D Golden Cross vs 1W Death Cross. Which will prevail?Two major technical events are about to be materialized for Bitcoin (BTCUSD). On the 1D time-frame a 1D Golden Cross, which is when the 1D MA50 (blue trend-line) crosses above the 1D MA200 (orange trend-line), is about to be formed, while on the 1W time-frame a 1W Death Cross, which is the opposite, is about to be formed. So what do those conflicting formation tell us? And which one will prevail?
We decided to view this through the dominant technical patterns available. As you see right now the one that stands out is an Inverse Head and Shoulders (IH&S), which is a pattern typically seen on market bottoms. This is one of the drivers that guide BTC at the moment. In similar fashion, it was a Head and Shoulders (H&S) pattern that formed the November 2021 market top and initiated the Bear Cycle.
The symmetry on that pattern is remarkable as the price dropped -52.50% from the H&S top to the bottom of the Right shoulder, and another -52.50% from that level to the bottom of the Bear Cycle. Similarly, depending on where the IH&S neckline is formed, we expect an proportional rise. If the neckline is formed on the best case scenario a little over the 1W MA50 (blue trend-line) at 27000, completing a +73.80% rise, then another +73.80% would put BTC's next bullish wave to around $47000. If on the other hand the price peaks now within the green neckline and just below the 1W MA200 (orange trend-line) completing a +56.50% rise, then another 56.50% would but the top of the next wave at around $38500 before the next pattern emerges.
It is not unlikely to the medium-term High here as based on the 1D RSI Bearish Divergence (being on Lower Highs against the price's Higher Highs) indicates that the rally is losing strength. The 1W RSI however marginally missed the 60.00 mark and indicates that there is still room for the rally to grow before it turned overbought at 80.00.
Which one do you think will prevail? Feel free to let us know in the comments section below!
-------------------------------------------------------------------------------
** Please LIKE 👍, FOLLOW ✅, SHARE 🙌 and COMMENT ✍ if you enjoy this idea! Also share your ideas and charts in the comments section below! This is best way to keep it relevant, support us, keep the content here free and allow the idea to reach as many people as possible. **
-------------------------------------------------------------------------------
💸💸💸💸💸💸
👇 👇 👇 👇 👇 👇
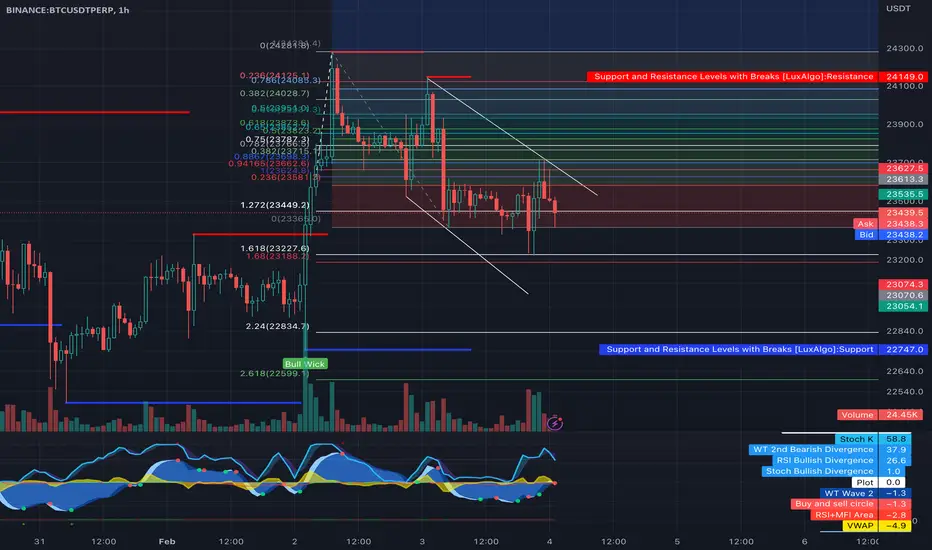
BTCUSDT Short!Dear guys, I am shorting from 23.6k
hopefully 22.8k is my target or even more
what about you guys?
Don' trade blindly!
Thanks!
Cheers!
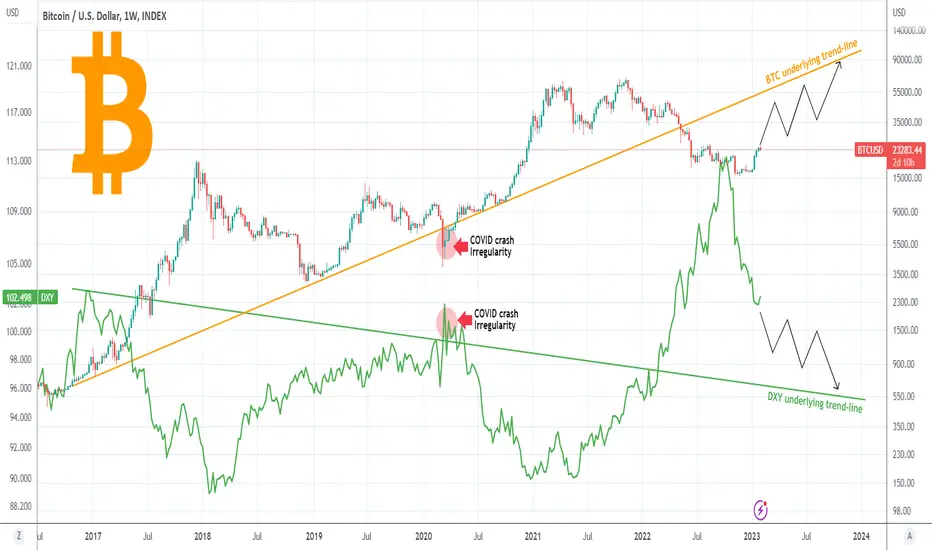
BITCOIN The potential Resistance in 2023 based on the DXY.In continuation of our recent BTC-DXY cross comparison studies, we will quickly bring you today a trend-line that may have gone overlooked and can pose a real Resistance to Bitcoin (BTCUSD) in 2023.
As you see, if we exclude the March 2020 COVID crash period which is a non-technical irregularity, there is an underlying trendline on both assets, which on Bitcoin was the Support since late 2016 while on the U.S. Dollar (DXY) was its Resistance. A more controlled rise/ decline respectively may provide the true Resistance level in 2023.
What are your thoughts?
-------------------------------------------------------------------------------
** Please LIKE 👍, FOLLOW ✅, SHARE 🙌 and COMMENT ✍ if you enjoy this idea! Also share your ideas and charts in the comments section below! **
-------------------------------------------------------------------------------
💸💸💸💸💸💸
👇 👇 👇 👇 👇 👇
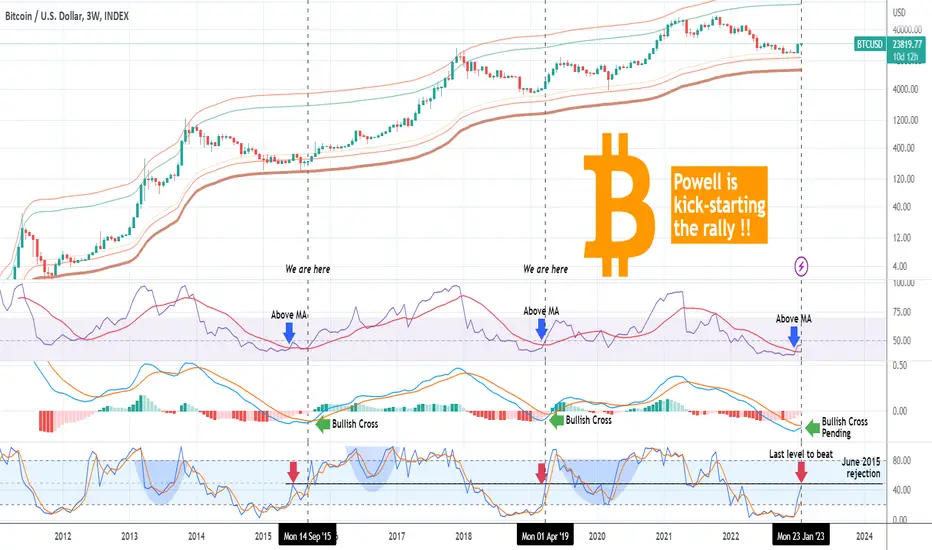
BITCOIN Major bullish signals aligned.Powell's icing on the cakeLots of euphoria yesterday after Jerome Powell's Press Conference where he gave the markets what they wanted to hear regarding future policy and how inflation is under control. The rates got increase by +0.25% but on a lower rate than the previous meeting. This may just be the icing on the cake for Bitcoin (BTCUSD) as technically we are close to three major indicators aligned for a huge triple buy signal.
We have moved up a time-frame to 3W to see an even longer term perspective that successfully filters out all the noise of short-term fluctuations. As you see, the RSI is already above its MA, the LMACD should complete the Bullish Cross on the next candle while STOCH is just below the 49.50 level. This is the last hurdle to overcome before BTC issues this triple buy signal as it is the level where STOCH got rejected on June 2015 and delayed the rally for another 2 months with one last low. However the LMACD Bullish Cross was formed after this low so if we get it on the next candle then most likely STOCH will be above the 2015 rejection point as well, or it will be invalidated.
Will this final alignment put the new Bull Cycle beyond doubt? Feel free to let us know in the comments section below!
-------------------------------------------------------------------------------
** Please LIKE 👍, FOLLOW ✅, SHARE 🙌 and COMMENT ✍ if you enjoy this idea! Also share your ideas and charts in the comments section below! This is best way to keep it relevant, support us, keep the content here free and allow the idea to reach as many people as possible. **
-------------------------------------------------------------------------------
💸💸💸💸💸💸
👇 👇 👇 👇 👇 👇
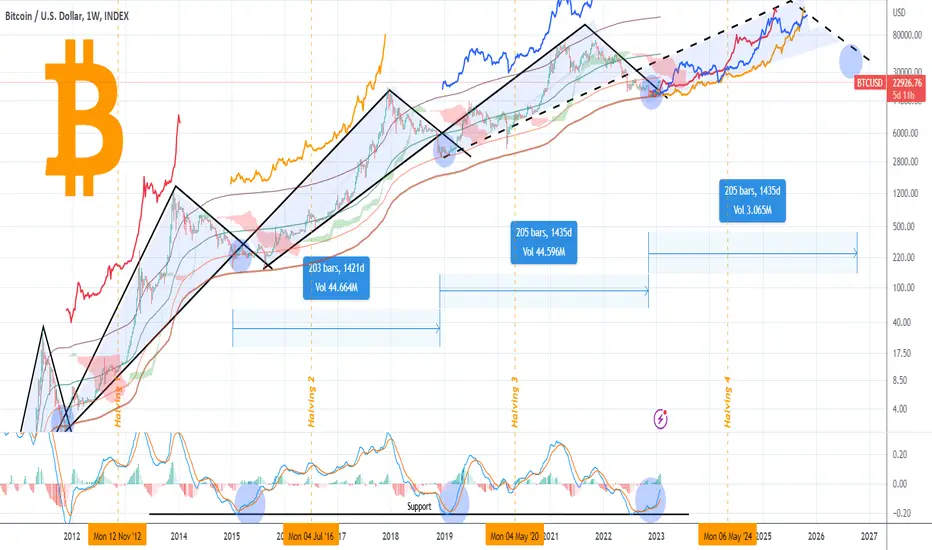
BITCOIN The new Geometric Cycle has begun. $150k within reach.Bitcoin (BTCUSD) is rebounding aggressively after the LMACD on the 1W time-frame hit and bounced on its historic Support that formed the 2015 and 2018 Cycle bottoms. This suggests that the new Bull Cycle has begun and to keep a better perspective, we have plotted the Geometric shapes from bottom-to-top.
Along with the Ichimoku Cloud and Fibonacci MAs, they paint a fair projection of where the price will trade to from now on. First consider that the next Cycle bottom could be around October 2026 if the (approximately) 1430 day (205 week) time range holds. The next (and final according to this model) bullish confirmation of the new Cycle is the price entering the (red) Ichimoku Cloud. When this happened in June 2012, October 2015 and May 2019, the Bull Cycle never looked back (obvious exception of course is the March 2020 crash due to COVID).
Then a break above Multiple 3 of the Fib MAs, will most likely kick-start the Parabolic Rally (but most likely this will be after Halving 4), as it has done during all previous Bull Cycles. A nice touch of the current study is the plotting of the past Cycles inside the projected current one. With its geometric adjust, all fit fairly easily within. On average, we should see the next Cycle Top around August 2025.
Do you agree with the above? Feel free to let us know in the comments section below!
-------------------------------------------------------------------------------
** Please LIKE 👍, FOLLOW ✅, SHARE 🙌 and COMMENT ✍ if you enjoy this idea! Also share your ideas and charts in the comments section below! This is best way to keep it relevant, support us, keep the content here free and allow the idea to reach as many people as possible. **
-------------------------------------------------------------------------------
💸💸💸💸💸💸
👇 👇 👇 👇 👇 👇
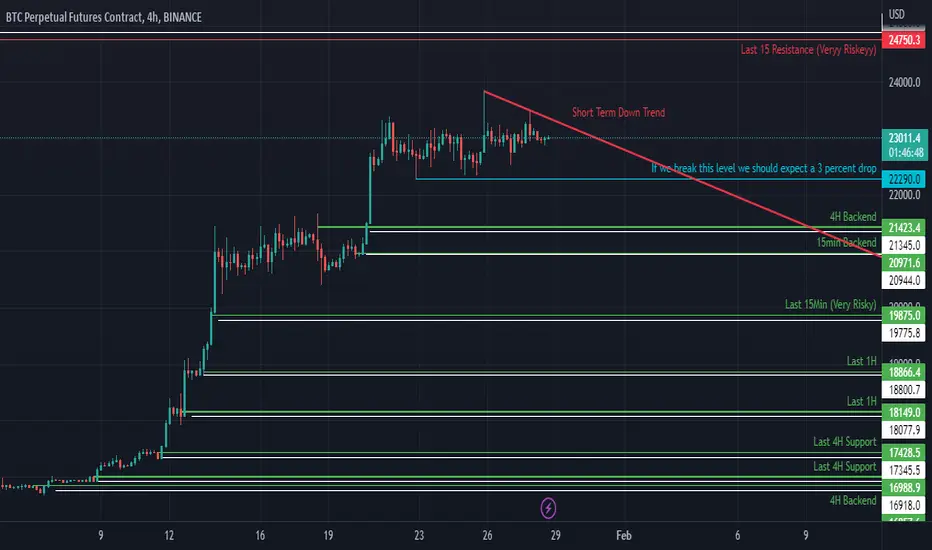
BTCPERP NEAR FUTURE ANALYSIS (4H Chart)Technical Analysis Summary
BTC/USDT
TREND ANALYSIS
We have 1 Downtrend in red color (Short Term).
Be careful trends need to be modified when broken to the new peaks (Downtrend) and lows (Uptrend).
FUTURE PREDICTIONS
We have many resistance and support levels that I have mentioned above.
I use thickness as an indicator of strength of levels (ONLY FOR VISUALS).
White levels Levels are very tight stop losses that could be used in high leverage future trading.
Good luck everyone, stay safe!
If you need help don't hesitate to send me a message or comment
If you find this content beneficial please don't forget to LIKE and FOLLOW
Trading Involves High Risk
Not Financial Advice
Exercise Proper Risk Management
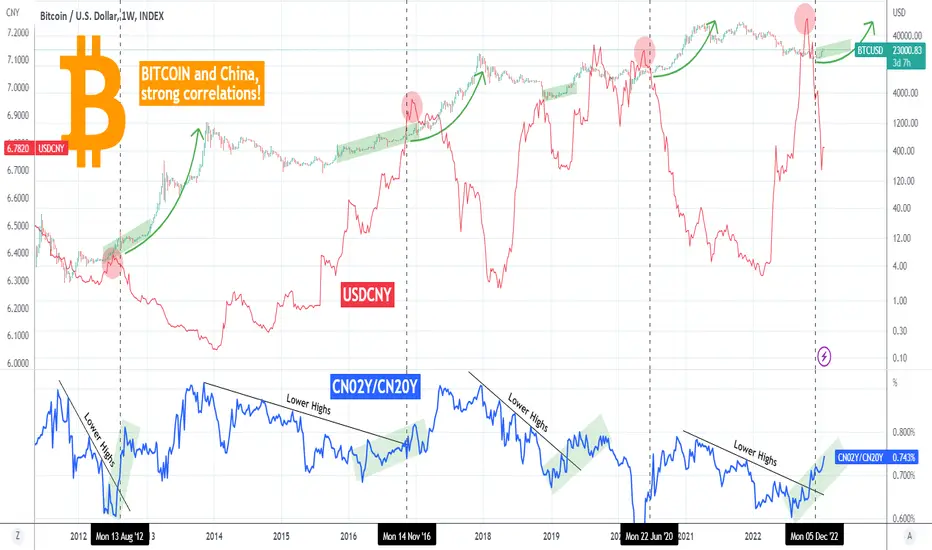
BITCOIN Yuan and China bond yields point to a mega rally!This is not the first time we emphasized the strong correlation of Bitcoin (BTCUSD) with Yuan (USDCNY) and the Chinese Bond Yields (CN02Y and CN20Y). We made an analysis right in the aftermath of the FTX crash, indicating why those indicators have all aligned, paving the way for BTC's new Bull Cycle.
As you see that happened and this time we incorporate the element of CN02Y/CN20Y. This shows that every time the ratio's Lower Highs broke in the past, Bitcoin started the first phase of the Bull Cycle. For shorter or longer periods, this was achieved within a Channel Up (green). Right now we have started the new one.
Adding the fact that every time the USDCNY topped and dropped as aggressively as it has been doing since October 24, Bitcoin has started the most aggressive part of the Bull Cycle, the parabolic rally.
This mix is incredibly bullish for Bitcoin technically and it prompts to a mega rally next, the likes of which we may have not seen in the past. Do you agree? Feel free to let me know in the comments section below!
-------------------------------------------------------------------------------
** Please LIKE 👍, FOLLOW ✅, SHARE 🙌 and COMMENT ✍ if you enjoy this idea! Also share your ideas and charts in the comments section below! This is best way to keep it relevant, support me, keep the content here free and allow the idea to reach as many people as possible. **
-------------------------------------------------------------------------------
💸💸💸💸💸💸
👇 👇 👇 👇 👇 👇
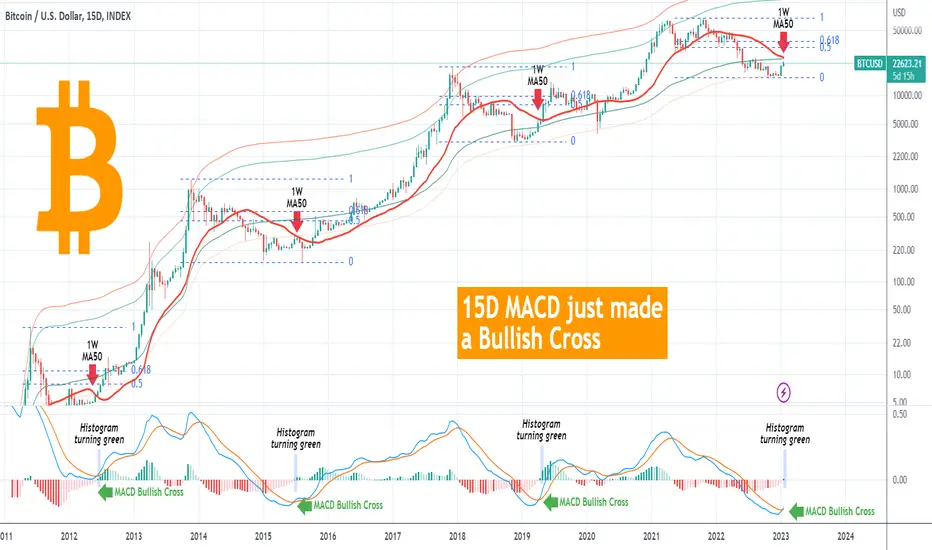
BITCOIN This is the Bullish Cross that will take it to $33kBitcoin (BTCUSD) just made a hugely important and unique Bullish Cross on its LMACD. Those who follow us regularly over the years, know that we like looking into assets (and Bitcoin in particular) from different time-frames that provide a more spherical overview of the market and the direction. This time we analyze the 15D chart as it just formed a Bullish Cross on its LMACD indicator.
This is a very rare pattern which below the 0.00 (LMACD) level has always formed straight after a Bear Cycle Bottom. Even during Bitcoin's first Cycle (2011/12) and the March 2020 COVID crash, the Bullish Cross was formed marginally above the 0.00 level.
Now the 1W MA50 (red trend-line) comes into the spotlight, as it is the Resistance to beat. Every 1W MA50 break following a 15D LMACD Bullish Cross, hit at least the 0.5 Fibonacci retracement level in a maximum of two weeks. We can make a case about the 0.618 Fib as well, which failed to get hit only marginally on October 28 2015.
As a result, with the 1W MA50 currently at 25615, we can expect another sharp 2-4 week rally once BTC breaks it, that will target at least the 0.5 Fib at $32900 with a riskier extension being the 0.618 Fib at $38900.
What do you think? Has this 15D LMACD Bullish Cross shaken your last bearish bias and if so, will you buy the 1W MA50 break-out confirmation? Feel free to let me know in the comments section below!
-------------------------------------------------------------------------------
** Please LIKE 👍, FOLLOW ✅, SHARE 🙌 and COMMENT ✍ if you enjoy this idea! Also share your ideas and charts in the comments section below! This is best way to keep it relevant, support me, keep the content here free and allow the idea to reach as many people as possible. **
-------------------------------------------------------------------------------
💸💸💸💸💸💸
👇 👇 👇 👇 👇 👇
Ascending Wedge BTC 1h/2hAn ascending wedge is a bearish chart pattern that forms when prices are trending upwards but with a narrowing range, creating a wedge shape. The pattern indicates that buying pressure is decreasing and that a downward trend may be forthcoming. Traders typically look for a breakdown below the lower trendline of the wedge as a signal to sell or short the security.
