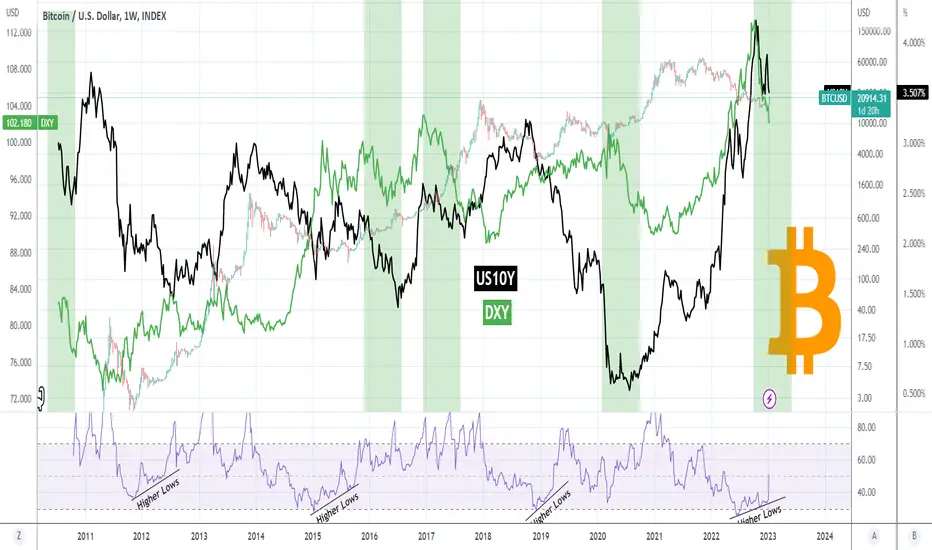
BITCOIN is massively undervalued and here is why.On this 1W time-frame analysis we make a case why Bitcoin (BTCUSD) is massively undervalued in relation to a technical factor as well as the effect that the U.S. 10 Year Government Bonds Yield (US10Y with the black trend-line) and the U.S. Dollar Index (DXY with the green trend-line) have.
Bitcoin's rise this week may come as a surprise to most but it is no coincidence. The 1W RSI has been on Higher Lows since the mid-June 2022 Low, while BTC has been trading on Lower Lows. This is a technical Bullish Divergence and a lengthy one. The times the 1W RSI prints Higher Lows sequences that low, have always been Bear Cycle Bottoms.
At the same time, we see the US10Y and the DXY (aggressively) decline simultaneously. The previous four times this happened were on a Bitcoin (aggressive) rally phase.
The fact that we get those two occurrences taking place at the same time, simply shows the underlying strength on the market at a level that macro-economically is treated as a market Bottom. Possibly indicating that if it wasn't for last year's fundamental crashes of FTX and LUNA, the price potentially would have already been much higher, showing how deeply undervalued BTC is right now.
Feel free to let me know in the comments section below!
-------------------------------------------------------------------------------
** Please LIKE 👍, FOLLOW ✅, SHARE 🙌 and COMMENT ✍ if you enjoy this idea! Also share your ideas and charts in the comments section below! This is best way to keep it relevant, support me, keep the content here free and allow the idea to reach as many people as possible. **
-------------------------------------------------------------------------------
💸💸💸💸💸💸
👇 👇 👇 👇 👇 👇
Btcsignals
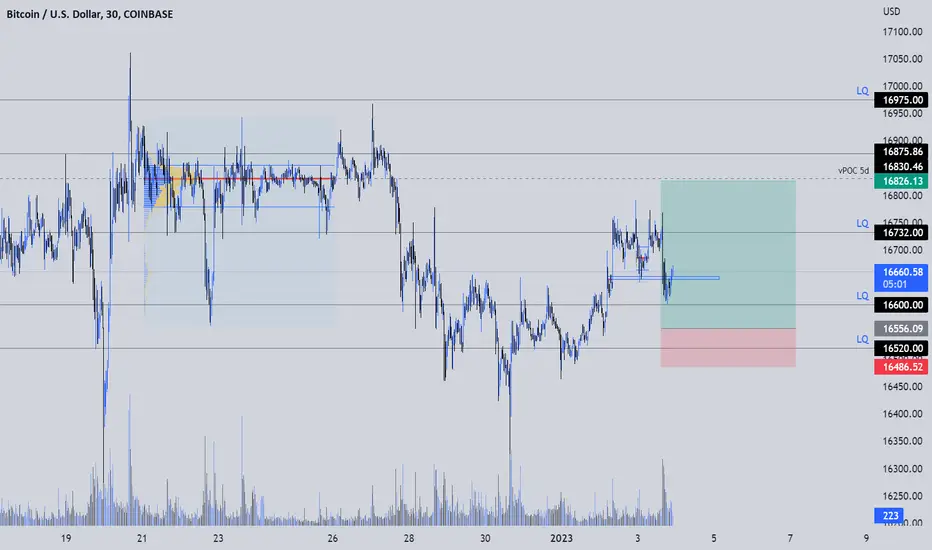
BTC/USD 30MIN BREAKDOWNGreetings dear traders on my first analysis of the new year! Today we look directly at Bitcoin on the 30 minute chart, from a daily perspective I see a lot of liquidity at the level between $16520 to $16600 where the whales could take a short term swing long and appreciate a little over 3%
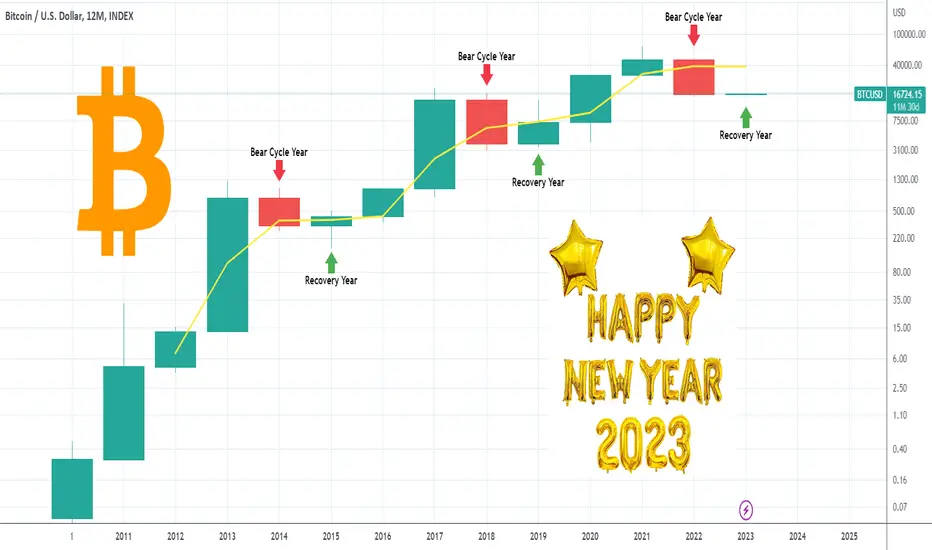
BITCOIN Happy New Year! 2023 the Year of Recovery?First and foremost on this second trading day of 2023, the TradingShot team would like to wish everyone on this community a Happy New Year, may each and everyone's goals be achieved!
2022 ended, took a whole of negative fundamentals with it (war, LUNA, FTX) and closed the yearly candle in (deep) red. As you see on this 12M (12 month) time-frame, Bitcoin (BTCUSD) had another two red 12M candles throughout its history and naturally those were the Bear Cycle years. Three green yearly candles followed after 2014 just as another three after the 2018 Bear Cycle candle.
Technically, the year that follows the red 12M candle is a recovery candle that hits and closes around the 1W MA100 (yellow trend-line). That level is currently at 37627.10 and running flat (sideways). Do you expect history to repeat itself following the 2022 Bear Cycle candle and close 2023 around $37k before the Bull Cycle really takes off?
Feel free to let me know in the comments section below!
-------------------------------------------------------------------------------
** Please LIKE 👍, SUBSCRIBE ✅, SHARE 🙌 and COMMENT ✍ if you enjoy this idea! Also share your ideas and charts in the comments section below! This is best way to keep it relevant, support me, keep the content here free and allow the idea to reach as many people as possible. **
-------------------------------------------------------------------------------
You may also TELL ME 🙋♀️🙋♂️ in the comments section which symbol you want me to analyze next and on which time-frame. The one with the most posts will be published tomorrow! 👏🎁
-------------------------------------------------------------------------------
💸💸💸💸💸💸
👇 👇 👇 👇 👇 👇
BITCOIN always rallied when these 3 indicators alignedThis is our last Bitcoin (BTCUSD) chart for 2022 and brings together the CN10Y (purple line), the U.S. Dollar Index (green trend-line) and the LTCBTC pair (orange trend-line). We've mentioned countless times in the past the importance of the DXY on Bitcoin and the strong effect that Litecoin (LTC) has as a leading indicator. Recently we've also made cases of the strong correlation of China's Bond Yields with BTC.
This cross study brings together all three and compares their price action against BTC. As you see, since BTC's early days, every time the CN10Y made a V-shaped reversal and started to rebound breaking its Lower Highs trend-line, while the DXY started to fall after a rejection on its Higher Highs trend-line and the LTCBTC pair broke above its Falling Wedge, Bitcoin was in the early stages of a hyper aggressive rally.
With the stock markets not at their best but having posted a 2 month recovery, while the cryptocurrency market's credibility viciously hammered by the FTX and LUNA collapses, will this strong 3 indicator emergence be enough to put Bitcoin back into long-term bullish territory?
Feel free to let me know in the comments section below!
-------------------------------------------------------------------------------
** Please LIKE 👍, SUBSCRIBE ✅, SHARE 🙌 and COMMENT ✍ if you enjoy this idea! Also share your ideas and charts in the comments section below! This is best way to keep it relevant, support me, keep the content here free and allow the idea to reach as many people as possible. **
-------------------------------------------------------------------------------
You may also TELL ME 🙋♀️🙋♂️ in the comments section which symbol you want me to analyze next and on which time-frame. The one with the most posts will be published tomorrow! 👏🎁
-------------------------------------------------------------------------------
💸💸💸💸💸💸
👇 👇 👇 👇 👇 👇

BTC/USDT 4HOUR UPDATEHello, welcome to this BTC /USDT chart update by CRYPTOSANDERS.
I have tried to bring the best possible outcome to this chart.
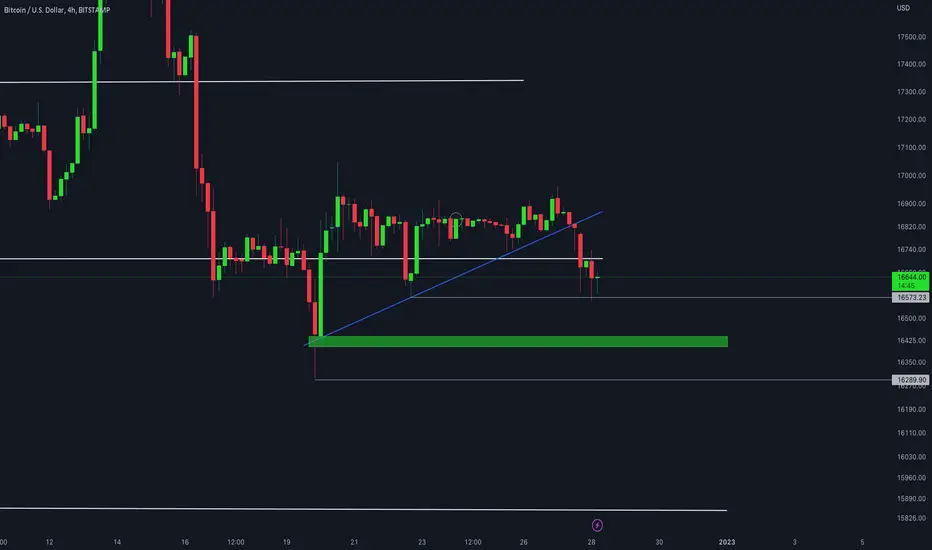
CHART ANALYSIS:- BTC effectively breakdown the ascending triangle following the downward move. As of now, it is holding over the marked low of $16,559.
If bulls won't show strength here, then the downward move will continue toward the horizontal support or the lower marked strong low support.
For the bullish confirmation, bulls need to break out the horizontal resistance around $16,940 with a retest above it to confirm a decent bullish rally in the market.
This is not a piece of financial advice.
Hit the like button if you like it and share your charts in the comments section.
Thank you
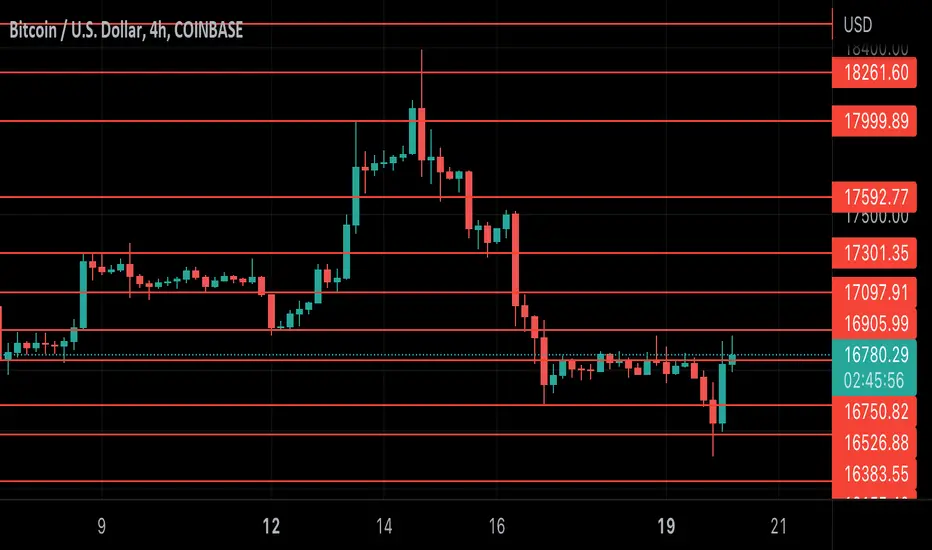
$BTC Daily Update$BTC #BTC Dipped below $16,526 support and jumped right back with bullish engulfing on last 4H close, $16,905 continues to resist as expected while current 4H struggling to follow up the bullish engulfing. If closed above $16,750 possible bullish engulfing could be expected on 1D
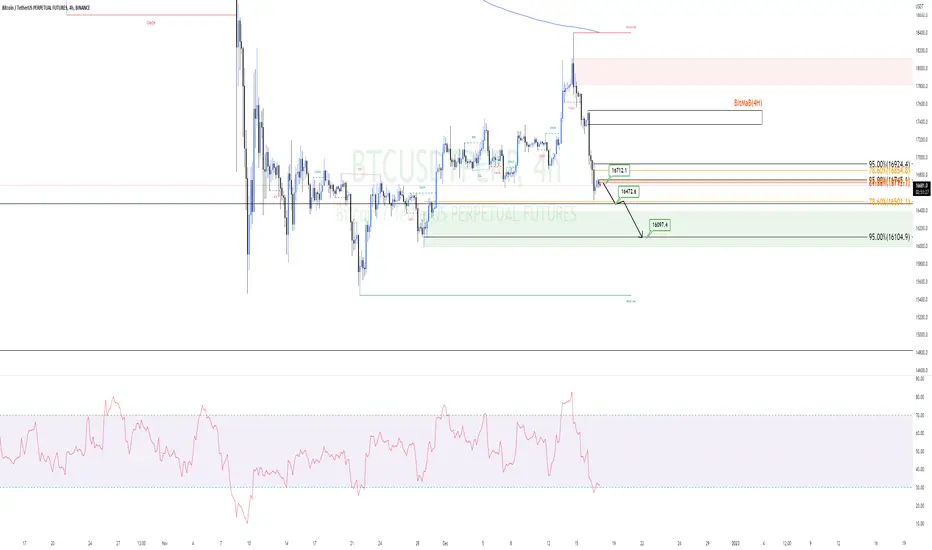
BTCUSDT Are You rdy for SELLHello to all my dear friends, I have done a bitcoin analysis for you.
In this analysis, we want to take the sell of bitcoin, and our entry point will be $16,712, as well as the desired targets, $16,472, $16,097, and $15,591, the loss limit that we have determined. It is 16,788 dollars.
Also, we will enter into this transaction with 50% of the original capital.
Good luck, dear Manouchehr Azar.
💥Bitcoin to rise to $20k before a dump below $15k#BITCOIN (UPDATE)
Clearly shown on the chart is bearish breakout from the trendline support and a pullback in play. When the pullback is complete, then another drop below $15,000
Not a financial advice🙅🏼♂️
Share your opinion in the comment section✍️
Please support this idea with a LIKE👍 if you find it useful🥳
Happy Trading💰🥳🤗

BTC/USDT 4HOUR UPDATEHello, welcome to this BTC/USDT 4Hr chart update by CRYPTOSANDERS.
I have tried to bring the best possible outcome to this chart.
CHART ANALYSIS:-BTC successfully bounced after taking some correction and hunting stops below the mid-range and this could be the completion of the corrective wave.
Currently, bulls are showing momentum and a move above the previous high of $17,424 with a retest above it, would be the indication of the continuation of bullish impulsive waves.
This is not a piece of financial advice.
Hit the like button if you like it and share your charts in the comments section.

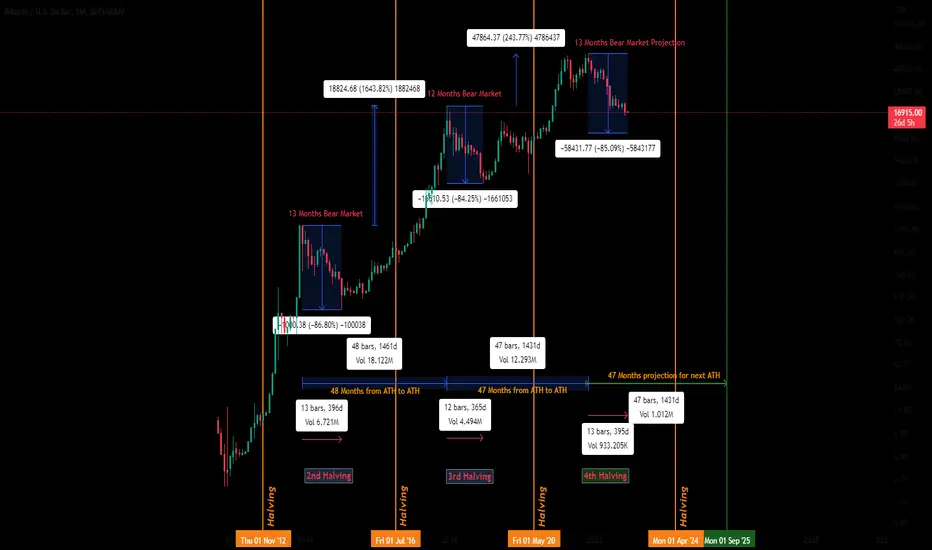
L9 - BTC Trend Analysis (Cycle/Halving)This chart is the study of previous cycles of BTC;
• BTC take appx 47-48 months to create new ATH from the previous one.
o As per the projections next ATH will be created in the Months of Sep-Nov 2025.
• BTC takes 12-13 months to create the bottom of the cycle from ATH of the cycle.
o As per the projections, BTC will create bottom in the months of Dec’ 22 – Jan’ 23.
• BTC normally drops between 84%-86% after creating ATH in next 12-13 months.
o At 85% BTC bottom for the cycle is projected at $10,000
DeGRAM | BITCOIN potential shortBitcoin formed a box after sell off.
Notice how price action is moving: extension, pause, and extension.
We expect further bearish move and break the box then retest the main support
-------------------
Share your opinion in the comments and support the idea with like. Thanks for your support!
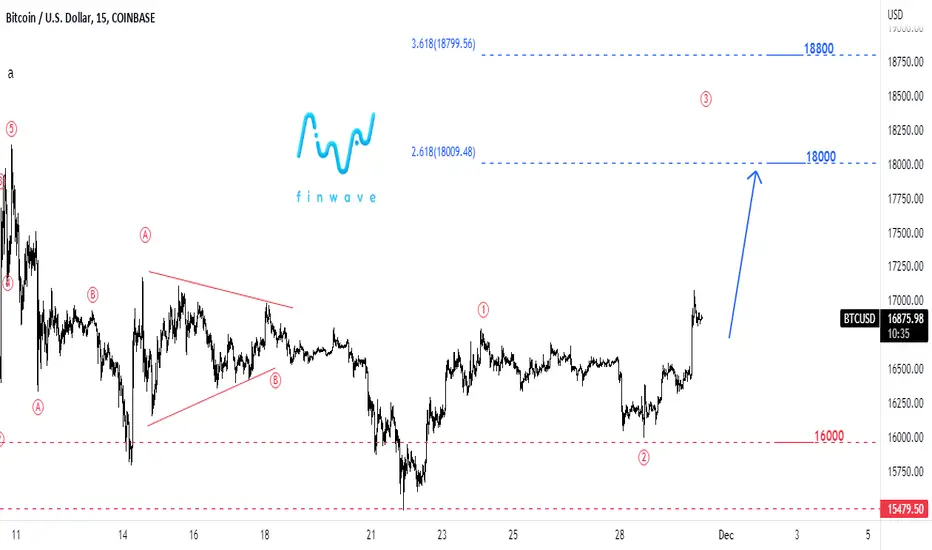
Financial Wave. BTC m15Our scenario for Bitcoin remains unchanged. Growth with the goal of $18,000 -$18,800, falling below $16,000 - scenario cancellation.
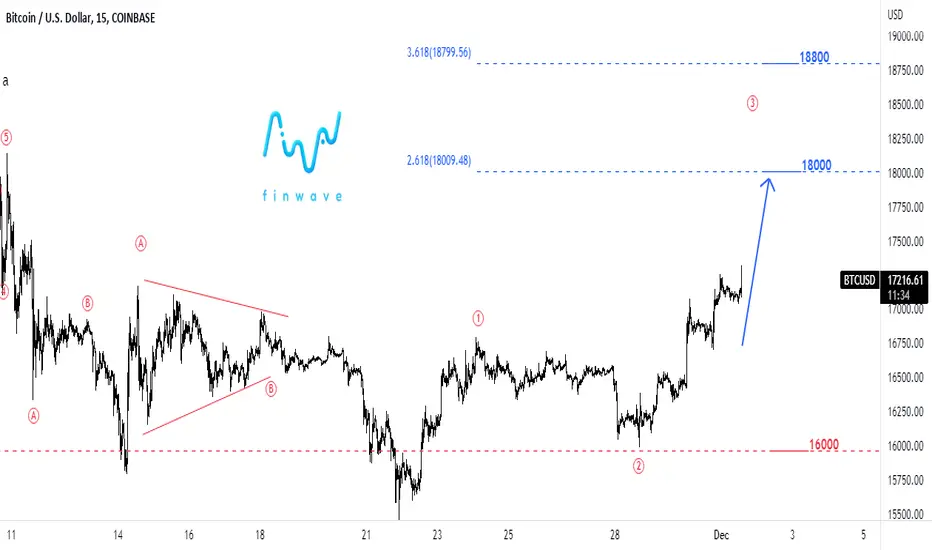
Financial Wave. BTC m15Our preferable scenario for BTC - the rise in wave C to the level of $19500 - remains the same. We have added short-term targets to our wave scenario that BTC can reach quickly. A rise in small wave 3 could take Bitcoin prices to $18,000 and $18,800. A drop in the BTC price below $16,000 cancels this scenario.
📉✌BTC 1H Long Position✌📈BINANCE:BTCUSDT
COINBASE:BTCUSD
Hi traders, first take a look at my previous analysis and positions.
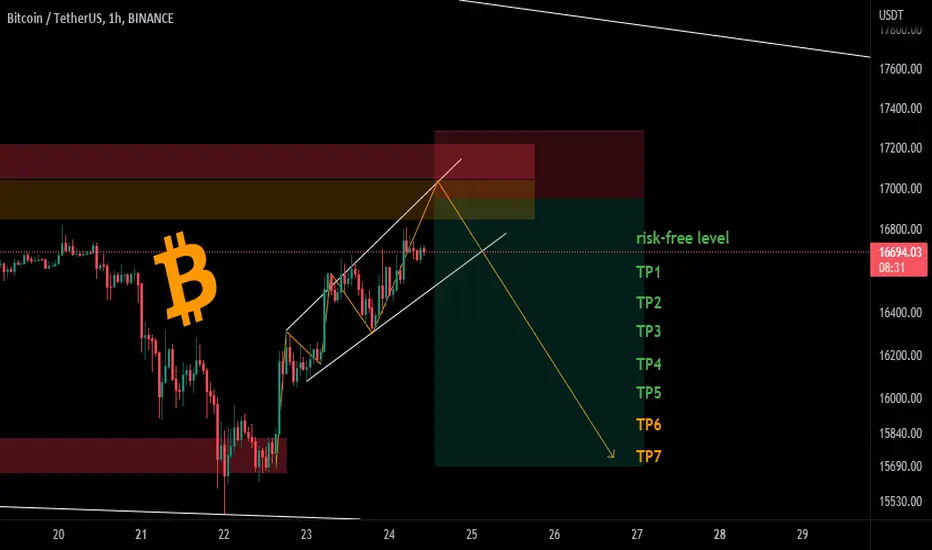
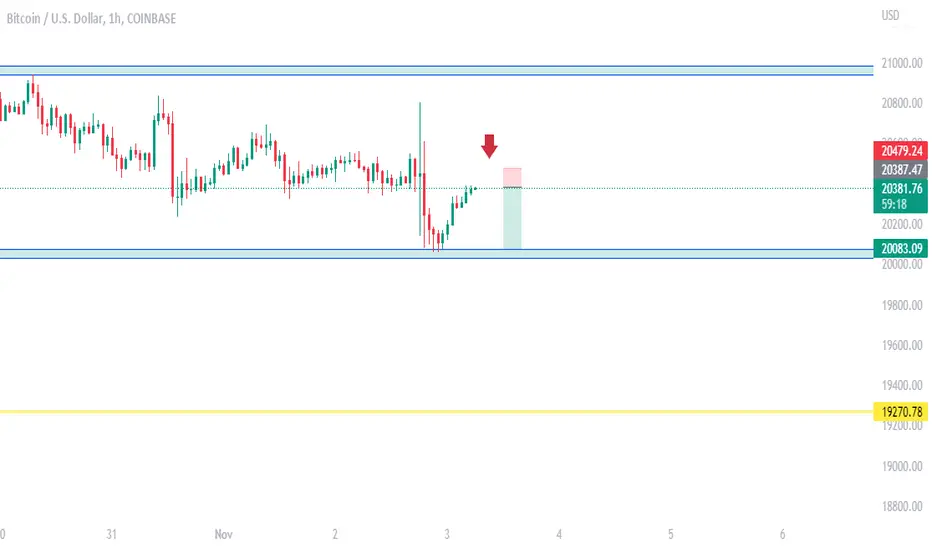
💥Three Drive pattern💥
between now and the yellow area, you can open a short position in two steps.
If the price falls and reaches the risk-free level, you can risk-free the position.
TP1-2-3-4-5-6-7 are on the chart.
The optimum stop-loss is above the determined area.
Please share ideas and leave a comment,
let me know what's your idea.
CrazyS✌
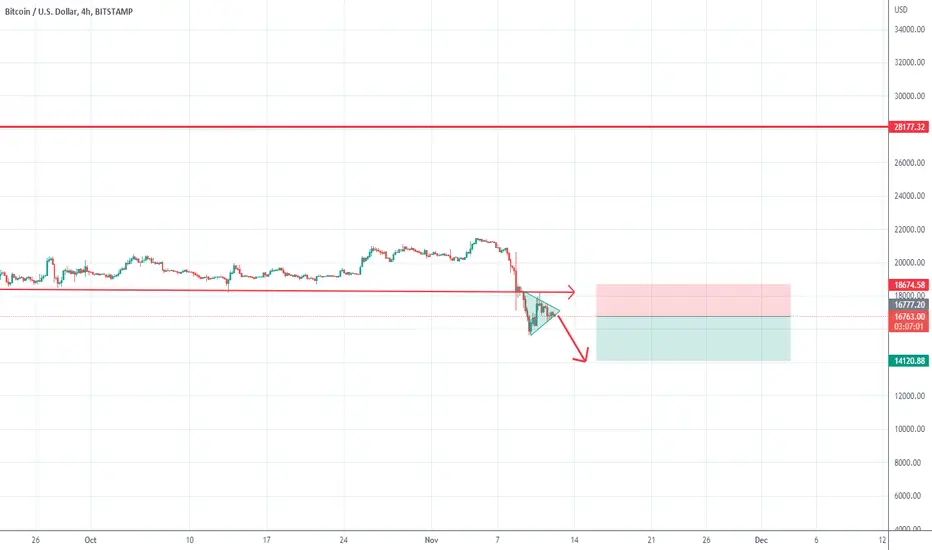
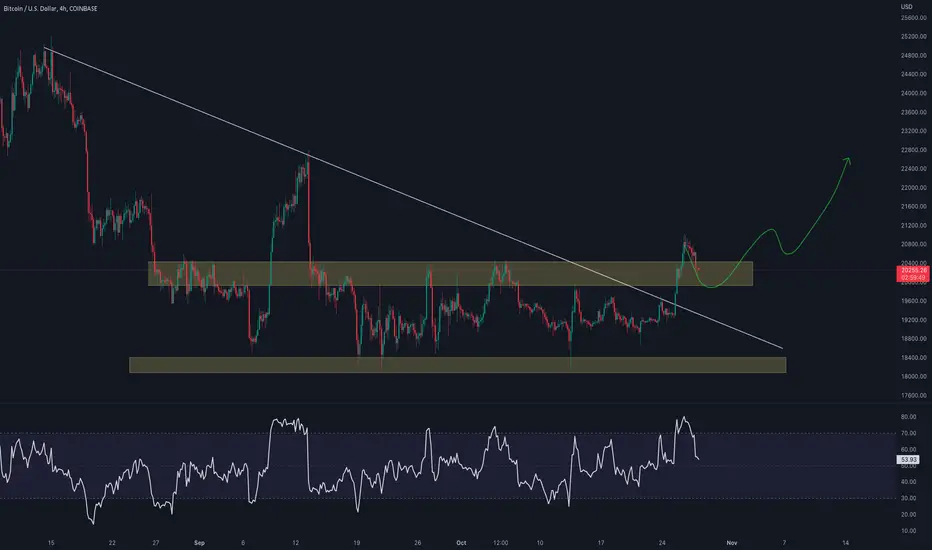
Bitcoin- New leg down?In my previous Bitcoin analysis, I said that in current market conditions selling rallies is the safest way to trade and I indicated 18-18.5k as the zone to do this.
Indeed, after the break of support and the steep drop from the beginning of the week, Bitcoin rose, corrected the dive, and confirmed the 18k zone as new resistance.
The price action from the past 2 days is drawing a small triangle on our short-term chart and this could be an indication of continuation to the downside.
The base of the triangle is around 3kusd and this gives us a target of around 14k for the next drop.
Only the price back above 18-18.5k in terms of daily close would put a pause on the drop and signal a potential range trading for BTC.
BTC Heading Towards 12500$ 💥 👑Hello TradingView community 🚀 and my followers, please if you like the ideas, don't forget to support them with likes and comments, thank you very much and here we go.
Today I want to talk to you about the BTC chart.
At the moment price break the triangle.
Then, I think BTC breaks continue to move down to my goal.
My target is located at charts level.
I expect this scenario.
This is my opinion, I really hope it will be useful for you.
Be prepared and save your money. Make big profits!

Bitcoin-Don't try to catch a falling knife, sell rallies insteadTwo days ago I warned that Bitcoin could fall and since then, the price has lost more than 20%.
After such a dive is normal to expect a correction and this, indeed, is very probable.
However, if you are a short-term trader and you are not a buy-and-hold one, trading against such a strong move is extremely dangerous.
Considering the importance of the break after more than 4 months of consolidation the safest way to trade is to sell rallies.
At this moment 18k-18.5k represents a strong ceiling and in this zone (if is reached) traders should look for selling opportunities.
In my opinion, Bitcoin has not reached the bottom, and a new wave of selling will follow an eventual correction.

BTC LIKELY PRICE DROP OF 3000+ PIPSIts expected for that the price of Bitcoins will drop again today and further depending on what NFP will usher in tomorrow
#BTC/USDT 4HOUR UPDATE !!Hello, welcome to this BTC /USDT 4hr chart update by CRYPTOSANDERS.
I have tried my best to bring the best possible outcome to this chart.
Show some support do hit the like button, follow and comment in the comment section. this motivates me to bring this kind of chart analysis on a regular basis.
CHART ANALYSIS:-The 4-hour chart paints a clearer picture of potential short-term targets for Bitcoin. After weeks of consolidation, the price has finally broken above the $20K resistance level, turning it into a potential support area.
The recent rally was launched after an impulsive bullish breakout from the bearish trendline, and the market is now trying to hold above $20K. If this level remains intact, a continuation toward $22,500 would be likely.
However, the RSI indicator should be closely monitored as it shows massive overbought signals, pointing to a potential reversal. In this case, the recent rally would be considered another bull trap and fake breakout, which would result in the price descending back toward the $18K support area.
This is not a piece of financial advice.
Hit the like button if you like it and share your charts in the comments section.
thank you.
GOLD SETTING UP FOR A DROP OF ABOUT 8000+Gold has been on overall fall and seems to continue as a touch at the .618 & .50 FIB region will trigger the sells momentum and most importantly rewarding SWING TRADERS with over 8000 Pips of the next couple of trading days depending on the volatility in the market + other fundamentals to trigger this technical play out.bring the price to $1620 per Ounce.
PATIENCE IS NEEDED TO ALLOW THE CONFIRMATION OF THE PLAY OUT!

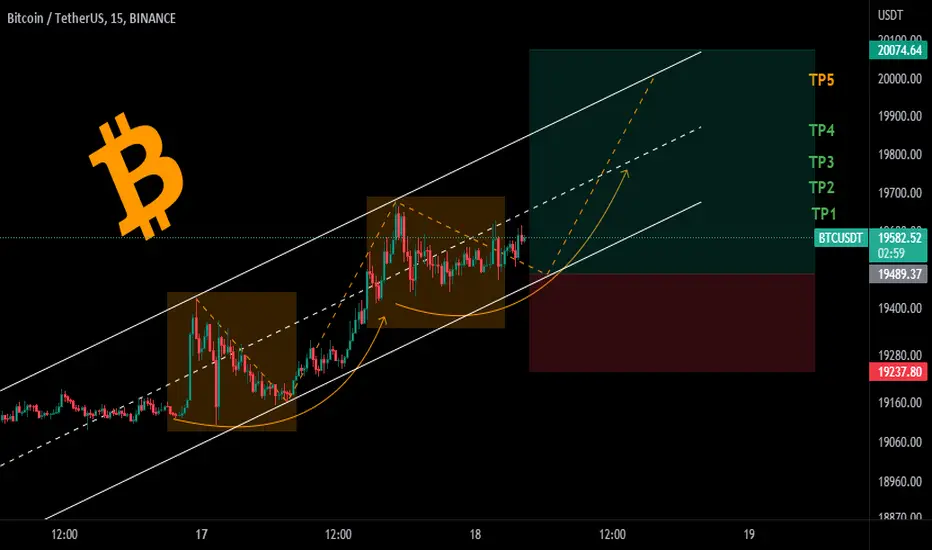
📉✌BTC 15Min long Position✌📈Hi traders,We're back!!!
Between NOW and the entry area, you can open a long position in two steps.
If the price rises and reaches the risk-free level, you can risk-free the position.
TP1-2-3-4-5 are on the chart.
The optimum stop-loss is below the determined area.
!!! If the bottom of the channel got broken with a strong candle, find a suitable exit position as soon as the price returns to the range of the entry point !!!
Please share ideas and leave a comment,
let me know what's your idea.
CrazyS✌
Bitcoin - WATCH OUT ❗ BULL TRAP 📈Hi Traders, Investors and Speculators
Ev here. Been trading crypto since 2017 and later got into stocks. I have 3 board exams on financial markets and studied economics from a top tier university for a year. Daytime job - Math Teacher. 👩🏫
From a chart analysis, I have been watching this major triangular consolidation for a while and optimistically hoped we would see a clean breakout above the white resistance zone. In other words, see a few daily candles CLOSE ABOVE this zone. What we see instead, is lower highs and wicky range trading.
From a technical indicator perspective we can see high volume with little price action. This means, that currently there is an equal amount of buyers and sellers. Nearly the same amount of people are bullish and bearish on Bitcoin, which causes the price to trade in a range. The nest thing to remember, is that range trading attracts algo's / algorithmic trading bots. Algo's specialize in shaking people out of their positions, aka stop hunt. This means that the price might increase to just above the resistance zone where most short sellers will have their stoploss, and then the price falls again to just underneath the support zone where most long buyers have their stop loss set.
So what can we take from all of this? SPOT . If you have to trade now, spot trading is definitely your safest bet during this time of the market phase, which is the accumulation phase according to the Wyckoff Method cycle.
Algo bots are notorious for their activity during the accumulation phase, so don't take low-reward high-risk trades!
Want to know which ALT I am bullish on ? Check out this idea:
_______________________
📢Follow us here on TradingView for daily updates and trade ideas on crypto , stocks and commodities 💎Hit like & Follow 👍
We thank you for your support !
CryptoCheck

📈✌BTC 4H Long Position✌📉BINANCE:BTCUSDT
COINBASE:BTCUSD
Hi traders,We're back!!!
First take a look at my previous analysis and positions on TRXUSDT and others.
between now and the yellow area, you can open a long position in two steps.
If the price rises and reaches the TP1 level, you can risk-free the position.
TP1-2-3-4 are on the chart.
The optimum stop-loss is below the determined area.
Please share ideas and leave a comment,
let me know what's your idea.
CrazyS✌
