BITCOIN just formed the 1D Golden Cross! What's next?Five days ago I posted the following fractal comparison:
I mentioned that even though a repeat of the May fractal was realistic, the emergence of the Golden Cross (i.e. the MA50 (blue trend-line) crossing above the MA200 (orange trend-line)) on the 1D time-frame, could invalidate the pattern and reverse it upwards.
Well today this 1D Golden Cross has been formed and Bitcoin is trying to capitalize on yesterday's rise. So what can prevent this rise from taking place? Since the price is trading within a Megaphone Pattern currently, that inevitably draws more comparisons with May as BTC was also trading within a Megaphone before the flash crash.
It goes without saying that the reasons for the crash were fundamental (Musk and Chinese bans on mining) but there is a certain technical level to look out for. That's the 0.786 Fibonacci retracement level where the price got rejected on May 10th (actually a little below that level). Currently that's at 50460 so we could assume that breaking above it and extending the Megaphone will be the last confirmation (following the 1D Golden Cross) for the invalidation of bearish patterns. If not, then we can expect the price to drop further and seek support on the 1W MA50 (red trend-line). On a side note, see how similar the LMACD patterns are between the Megaphone fractals.
What's your take on this? Will the 1D Golden Cross invalidate the bearish fractals or won't make a change? Feel free to share your work and let me know in the comments section!
Please like, subscribe and share your ideas and charts with the community!
--------------------------------------------------------------------------------------------------------
!! Donations via TradingView coins also help me a great deal at posting more free trading content and signals here !!
🎉 👍 Shout-out to TradingShot's 💰 top TradingView Coin donor 💰 this week ==> Vergnes
--------------------------------------------------------------------------------------------------------
Btcsignals

BTCUSD SentimentsThere has been such little selling that it almost makes it negligible. Long-term holders are already not selling as 10-year old supply just reached an ATH of 2.4 million BTC. And along with them, even the mid-term holders have stepped back when it comes to selling.
In fact, the buying trend is so strong that addresses with balance have reached a 4-month high, matching with May ATH levels. Thus, the wise thing to do right now is to buy Bitcoin ASAP.
The Relative Strength Index (RSI) is already in the bearish-neutral zone. This indicates that a price flip could be coming soon and buying now will result in strong profits later.

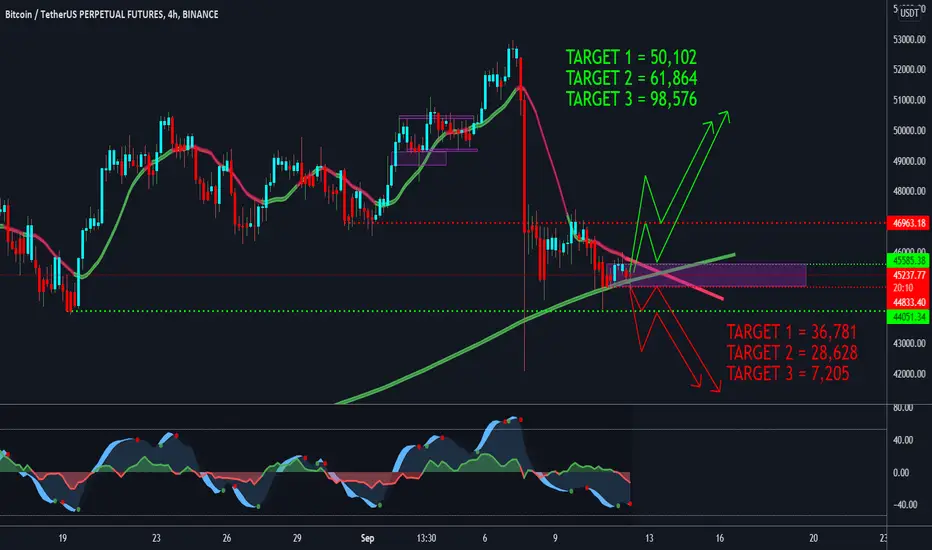
Bitcoin opportunity to grab before BIG moveBitcoin opportunity to grab before BIG move. Keep eye on TARGETS specified. BUY and SELL levels are clearly displayed with support and resistance levels.
TOMOBTC Technical Analysis
⏳ Spot
💎 TOMOBTC has broken above the descending channel. So we expect that the price goes down once for a pullback before it goes up above the channel and reaches the TPs.
🏁 Short & Medium Term
💵 Invest Only 5% of your Portfolio
🎳 Entry at market or 0.00004350
☕️ TP1 0.00005200
🍺 TP2 0.00005450
🍻 TP3 0.00005750
🍾 TP4 0.00006060
🍷 TP5 0.00006550
🍸 TP6 ___________
🍹 TP7 ___________
🎁 TP8 ___________
🚫 SL 0.00003850
Good Luck 🎲
Check the Links in Description and If you LIKE this analysis, Please support our page and Ideas by hitting the LIKE 👍 button. ❤️ Your Support is really appreciated! ❤️
Traders, if you have your own opinion about it, please write your own in the comment box. We will be glad for this.
Feel free to request any pair/instrument analysis or ask any questions in the comment section below.
We will have more FREE forecasts in TradingView soon
Have a Profitable Day

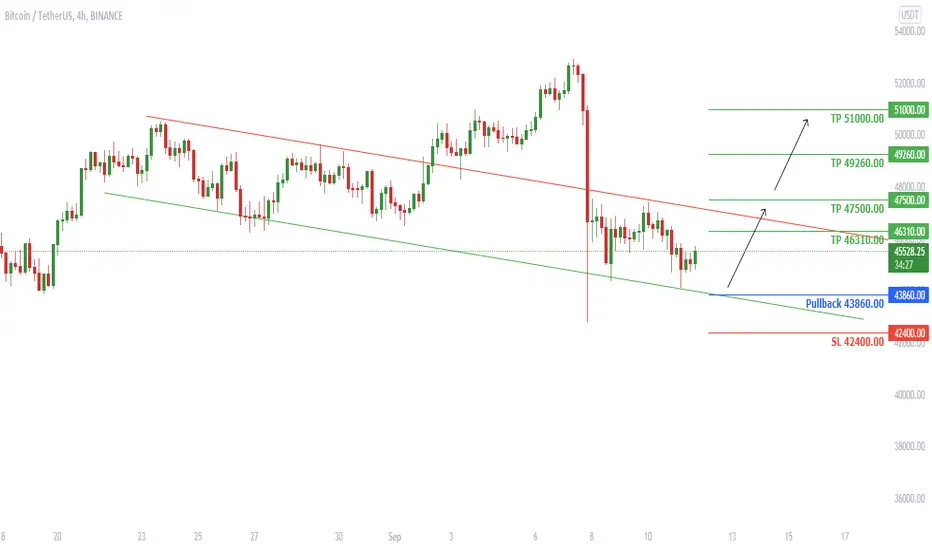
BTCUSDT Technical Analysis
⏳ Spot
💎 BTCUSDT Has got rejected from the bottom of the channel. We also see a Bullish Engulfing candle at the resistance line. The price might go lower to the pullback zone before it goes up to the upper line of the channel.
🏁 Short & Medium Term
💵 Invest Only 5% of your Portfolio
🎳 Entry at market or 43860.00
☕️ TP1 46310.00
🍺 TP2 47500.00
🍻 TP3 49260.00
🍾 TP4 51000.00
🍷 TP5 _________
🍸 TP6 _________
🍹 TP7 _________
🎁 TP8 _________
🚫 SL 42400.00
Good Luck 🎲
Check the Links in Description and If you LIKE this analysis, Please support our page and Ideas by hitting the LIKE 👍 button. ❤️ Your Support is really appreciated! ❤️
Traders, if you have your own opinion about it, please write your own in the comment box. We will be glad for this.
Feel free to request any pair/instrument analysis or ask any questions in the comment section below.
We will have more FREE forecasts in TradingView soon
Have a Profitable Day
BITCOIN Is it realistic to expect a repeat of this fractal?If you followed me for long here on TradingView and on reddit in the past, then you know I am a big supporter of fractal analysis. As a result I had to bring you today's fractal comparison and will explain how it can be invalidated even though so far it has been astonishingly identical.
** Fractal similarities **
First of all, this time I haven't used the log chart, to avoid confusion among people who are not familiar with. The time-frame is on the 1D. I've classified the legs numerically from (a) to (j) (nine in total). As you see Bitcoin has currently completed (h) and is going for a dead-cat bounce to (i). So far it has been replicating the January - May fractal extremely closely. The 1D MA50 (blue trend-line) has been supporting (only recently it broke but the price closed back above it), a Higher Lows trend-line of a 45° angle was supporting both fractals until the (g) leg and the Fibonacci retracement levels have been providing Support on the way up. The only minor difference is that the (h) leg has hit the 0.618 Fib while in April it only hit the 0.5 retracement level. Also the RSI is currently at the same level it was when the April fractal was in the middle of the (g)-(h) sequence.
** The difference maker **
So, until now it looks like an excessively identical fractal. However, the big factor that wasn't present in early May and may make all the difference in the world at invalidating the fractal, is the Golden Cross. As you see, this very bullish MA pattern (when the MA50 (blue trend-line) crosses above the MA200 (orange trend-line) is very close to be formed on this 1D chart. No only BTC wasn't even close to a 1D Golden Cross in late April/ early May but in fact we haven't seen this formation since May 19 2020, so over 1 year ago.
If leg (i) materialized next, then most likely that will form the 1D Golden Cross and that alone can be the difference maker as short-term fractals have to abide to the long-term indicators and the 1D Golden Cross is such. If not, expect the (j) leg to find Support around $38000.
What's your view on that fractal? Do you think it will complete the (j) leg or a potential Golden Cross will invalidate it and break above $53000? Feel free to share your work and let me know in the comments section!
Please like, subscribe and share your ideas and charts with the community!
--------------------------------------------------------------------------------------------------------
!! Donations via TradingView coins also help me a great deal at posting more free trading content and signals here !!
🎉 👍 Shout-out to TradingShot's 💰 top TradingView Coin donor 💰 this week ==> watchtrend
--------------------------------------------------------------------------------------------------------

DOGE Price AnalysisThe daily chart shows the Dogecoin price continues to grind broadly sideways in a narrowing pennant formation.
Forming the lower edge of the formations a trend line at $0.2090. It was this uptrend that provided the catalyst for yesterday’s bounce. Just above the trend line, the 200 EMA at $0.2275 lends its weight to the support. If the price fails to hold above the 200 EMA and the trend line, it will signal an end to the 2021 bull market and likely lead to significant long liquidation.
However, for now, the trend is intact. And as long as that stays the case, DOGE has a chance to recover. The first obstacle is the 100 EMA at $0.2632, followed by the 50-day at $0.2729. Successful clearance of the two moving averages should lead to another attempt at trend resistance, now seen at $0.3183. And above $0.3183, the outlook turns incredibly bullish. However, the early signs are that the downside will prevail. Although, DOGE has a habit of surprising.

BTC Fibonacci IdeaHi guys,
I just want to briefly go over my Fibonacci 0.618 idea. When you pull the Fibonacci extension from the previous bull runs ATH to the low we can see that as the market went for another push it was rejected from the 0.618 quite harshly which was followed by a multi year bear cycle.
Now the real question is will this come to fruition? or will we see this completely invalidated and we continue the super cycle.
History doesn't always repeat but It's an interesting thought.
Thanks for reading
Please leave me a comment and like if you enjoyed my post

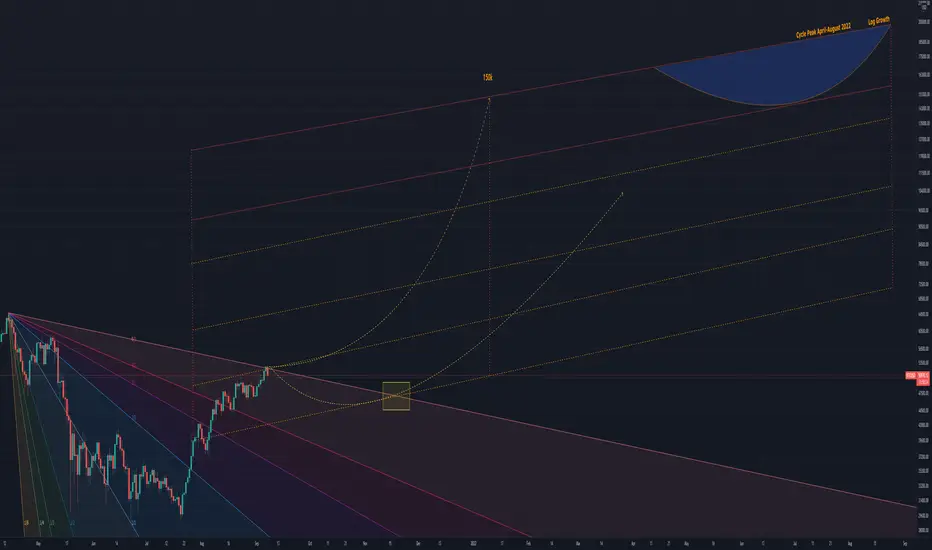
Bull Market Restarts November 2021 The path is clear, a rejection of 8/1 Gann Ratio now will push the cycle top to next year for Bitcoin.
The key month to follow is November 2021 this is when the bull market will most likely restart on full momentum. The crossing of the 8/1 ratio and the log growth is the key.
If we do break the 8/1 ratio this week we can expect the cycle peak much sooner December to January 10 2022.
Bitcoin Roadmap still intact ,financial freedom around the corner for long term holders.
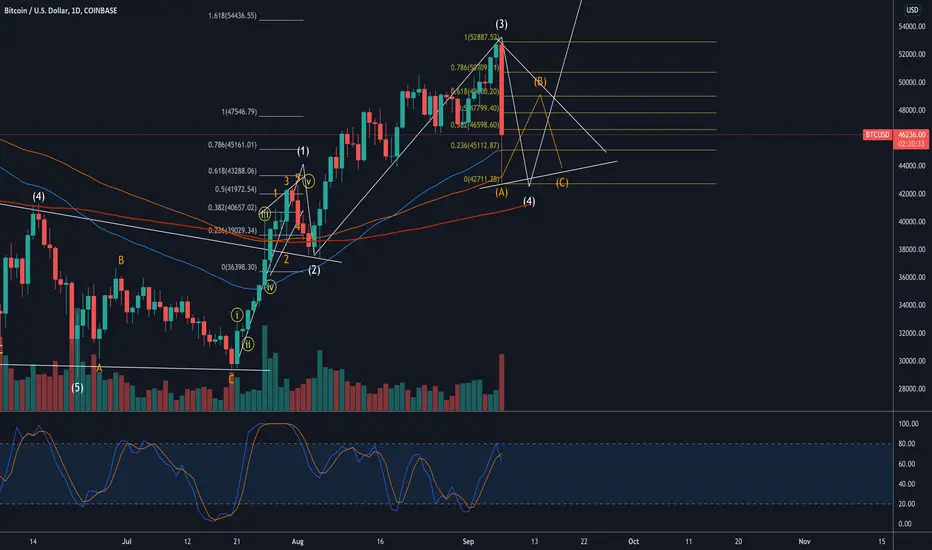
BTCBTC has likely finished W3 and will enter a W 4 here that I only assume will form a triangle as BTC loves to correct with triangle. Most likely becuase the tight range creates low volitility which traders love and then will most likely break up to W5 around $55k plus minus.
BITCOIN -20% correction in a day! Is the bleeding over?On my last Bitcoin analysis I underlined the importance that Fibonacci retracement levels along with the 1D MA50 (blue trend-line) will play on this recovery attempt. Today is a correction day for BTC with the price losing almost -20% intra day so far.
The drop has been contained exactly on the 0.5 Fibonacci retracement level, just below the 1D MA50, confirming its importance bias (so far). If BTC manages to close the session above it, then this pull-back, even though substantial, it will be nothing but a buy opportunity similar that the 1D MA50 gave from October 2020 until the April 14 2021 All Time High (ATH). If not, then the 1W MA50 (bold red trend-line) is the next line of Support.
So naturally the next question is, if the current Support levels hold, what would be the next target? Naturally as the Fibs retracement levels suggest, the next Fib to fill is the 0.786 at roughly 54400. A break above that level, brings BTC to the final barrier before the ATH, the High Volatility Cluster of 53 - 59.7k consisting of the Volatility Zone that Bitcoin traded in before the May 12 collapse started. That Cluster along with the Higher Highs trend-line, may push the price sideways for some time, even lead to the next 1D MA50 correction.
But what is your take on today's -20% drop? Is the bleeding over and we'll start recovering or can we see further correction towards the 1W MA50? Feel free to share your work and let me know in the comments section!
Please like, subscribe and share your ideas and charts with the community!
--------------------------------------------------------------------------------------------------------
!! Donations via TradingView coins also help me a great deal at posting more free trading content and signals here !!
🎉 👍 Shout-out to TradingShot's 💰 top TradingView Coin donor 💰 this week ==> GJMRealEstate
--------------------------------------------------------------------------------------------------------

MATICUSD AnalysisMATIC pictured consolidation and is priced at $1.63 after registering a price hike over the previous day. Currently, MATIC stood few notches below its three months high. The immediate support level for MATIC was at $1.38 and then at $1.28. MATIC hasn’t traded below the $1.28 level in almost three weeks.
Technicals are positive, Buying pressure noted an uptick and the Relative Strength Index stood above the mid-line. Awesome Oscillator flashed green signal bars. Bollinger Bands were converging somewhat and noted low volatility.
In the event of MATIC breaking its rangebound movement on the upside, it might attempt to topple its three-month high of $1.70 and set a new high
Feel free and get in touch for more updates, signals and trade alerts

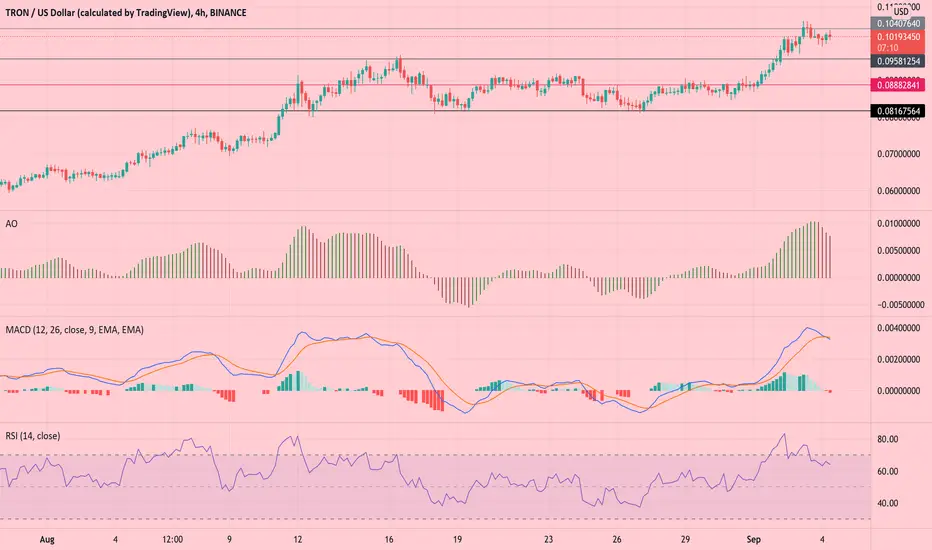
TRXUSD AnalysisTRX slipped down on its charts over the last 24 hours and was trading at $0.102. The altcoin had registered a multi-month high yesterday, however, it failed to topple the $0.104 resistance. Its immediate support zone lay at $0.0958, the additional support lines stood at $0.088 and at $0.0816. it's been three weeks since TRX last traded around $0.0816
Buying pressure fell near the 60-mark on the Relative Strength Index after the asset was overbought over the last 48 hours. Awesome Oscillator registered red signal bars. MACD’s green histogram receded and a red histogram was visible.
Feel free and get in touch for more updates, signals and trade alerts
BITCOIN indicators to consider for a bullish break-out** The Channel Up and Fibonaccis **
Bitcoin is trading inside a Channel Up on the 1D time-frame which has been lately supported by the 1D MA200 (orange trend-line). Since the uptrend started on the July 20 low, the price has filled all major Fibonacci retracement levels except for one, the 0.786 (which is roughly at 54420). That would make an ideal technical Higher High on the Channel Up if hit in the next few days.
** The RSI **
However we need to consider the Lower Highs trend-line on the 1D RSI. This is diverging from the price action as it is giving Higher Highs on the Channel Up for BTC. The longer it holds, the more likely a correction is possible. However a break above the LH trend-line may initiate a strong rally to fill the All Time High (ATH) Gap.
** The LMACD **
At the same time the LMACD is about to make a Bullish Cross. A complete formation would be very bullish for BTCUSD as the last one on July 22 was exactly at the start of this strong rebound.
What's your current view on this? Is this all a strong bullish combination, or the RSI divergence can spoil the party? Feel free to share your work and let me know in the comments section!
Please like, subscribe and share your ideas and charts with the community!
--------------------------------------------------------------------------------------------------------
!! Donations via TradingView coins also help me a great deal at posting more free trading content and signals here !!
🎉 👍 Shout-out to TradingShot's 💰 top TradingView Coin donor 💰 this week ==> v184
--------------------------------------------------------------------------------------------------------

LTCUSDLitecoin is a first-generation cryptocurrency that is often seen as a good alternative to Bitcoin, as a result, the two coins have a close correlation. When Bitcoin rallies, Litecoin follows close by and vice versa. In fact, the LTC is currently in a consolidation phase because Bitcoin has found some resistance at the highest level since last week.
Turning to the chart, we see that the LTC price has been in a strong bullish trend in the past few weeks. At the same time, it has formed what looks like a bullish flag pattern. This pattern tends to be a bullish signal in price action analysis. It has also formed what looks like an inverted head and shoulders pattern.
Therefore, the Litecoin price will likely break out higher as bulls target the key resistance at $250. On the flip side, a drop below $150 will invalidate this view.

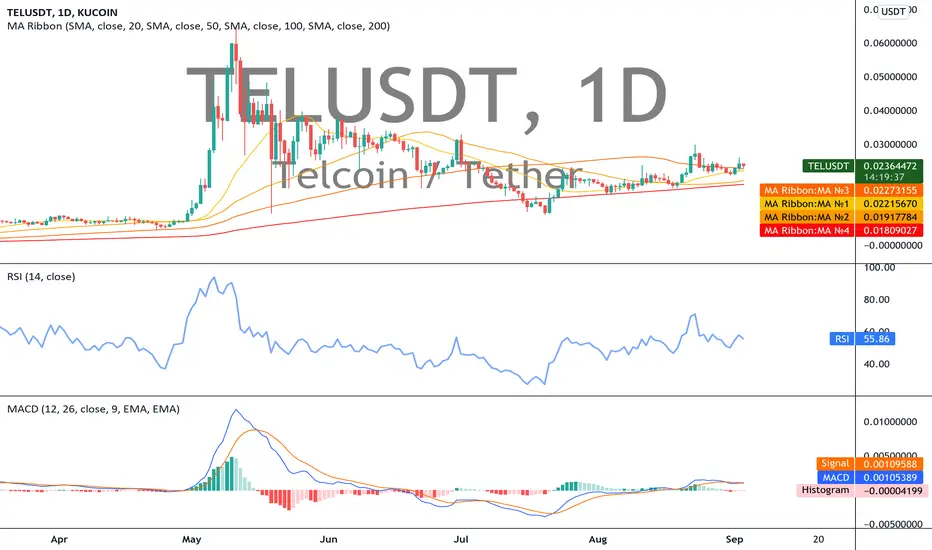
Telcoin Price Chart The daily chart shows that in late July, the Telcoin broke above a descending trend line at $0.2240 on its way to $0.0298. However, the trend breakout failed to attract follow-through buying, and as a result, TEL is retesting the trend, now at $0.0198.
Currently, the trend support is holding up, and TEL has managed to bounce 14% to $0.0238. The tightly grouped 50 and 100-day moving averages sit just above the trend line, reinforcing the robust support. Therefore, this is a significant level and should the price continue to maintain above the trend, it’s likely to head higher, and in this event, a move towards the June high of $0.0385 looks probable.
However, the bullish view relies on trend support. And on that basis, if the price falls below $0.0198, it will invalidate the thesis.
Feel free and get in touch for more updates, signals and trade alerts
LTCUSDT Technical Analysis
⏳ Futures
💎 LTCUSDT has formed a triangle. The price had have several green candles in a row, after the breakout we expect more move to the upside.
🏁 Short Term
💵 Invest Only 5% of your Portfolio
⏲ Leverage 5 - 10 - 20 - 25 - 50 - 75 - 100
🎳 Entry at market or 176.0
☕️ TP1 177.5
🍺 TP2 180.0
🍻 TP3 182.0
🍾 TP4 _____
🍷 TP5 _____
🍸 TP6 _____
🍹 TP7 _____
🎁 TP8 _____
🚫 SL 167.8
Good Luck 🎲
Check the Links in Description and If you LIKE this analysis, Please support our page and Ideas by hitting the LIKE 👍 button. ❤️ Your Support is really appreciated! ❤️
Traders, if you have your own opinion about it, please write your own in the comment box. We will be glad for this.
Feel free to request any pair/instrument analysis or ask any questions in the comment section below.
We will have more FREE forecasts in TradingView soon
Have a Profitable Day

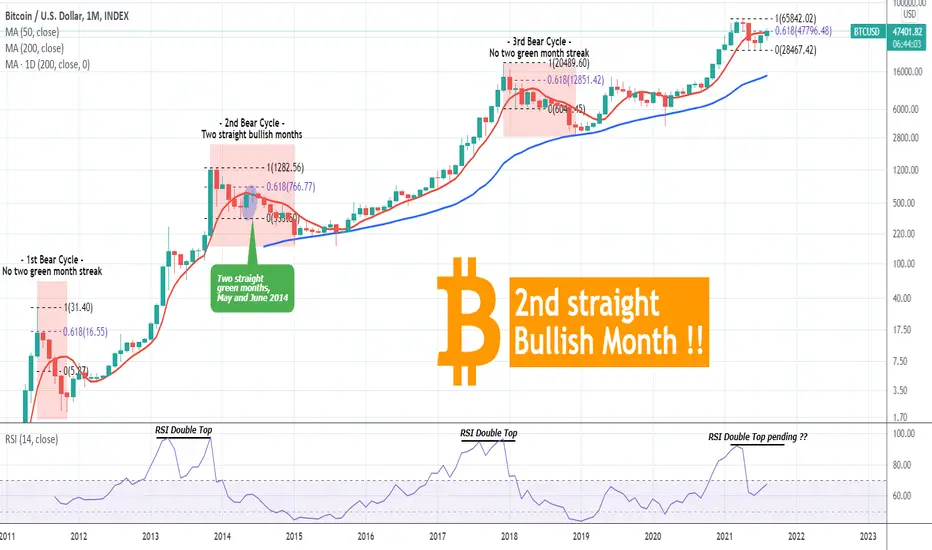
BITCOIN closing the 2nd straight green month!Bull or Bear Cycle?Today Bitcoin is about to complete the 2nd straight green month. Is such feat possible to be in a Bear Cycle?
The answer is yes, it is possible but based on this simple chart, not that probable. And the reason is simple. Out of all three past BTC Bear Cycles, we've only had 2 straight bullish monthly (1M) candles once and that was during the 2nd Bear Cycle on the months of May and June (2014). During the 1st Bear Cycle we had no green (bullish) monthly streaks, same with the 3rd.
This solidifies more and more the notion that the 1M RSI has to make a Double Top as in Cycle 2 and 3 in order for a top to be formed and so far that is pending. Also during the 2nd Bear Cycle, the 2 month bullish streak broke but closed below/ on the 1D MA200 (red trend-line) and failed to even touch the 0.618 Fibonacci retracement level. That is a common characteristic of all Bear Cycles (never closed above the 1D MA200 after breaking it as well as never reaching the 0.618 Fib). On the other hand, the current 2 month bullish streak hit both the 1D MA50 as well as the 0.618 and will most likely close above the 1D MA200 today.
The above sequence of events makes me believe that we have more chances to still be within a Bull Cycle and not approaching the middle of a Bear Cycle. What do you think?
Feel free to share your work and let me know in the comments section!
Please like, subscribe and share your ideas and charts with the community!
--------------------------------------------------------------------------------------------------------
!! Donations via TradingView coins also help me a great deal at posting more free trading content and signals here !!
🎉 👍 Shout-out to TradingShot's 💰 top TradingView Coin donor 💰 this week ==> vychod
--------------------------------------------------------------------------------------------------------
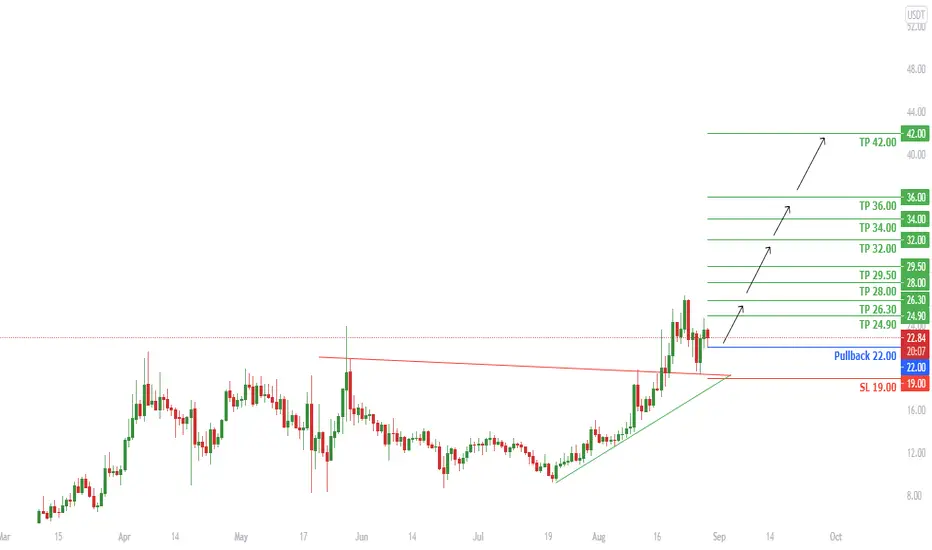
HNTUSDT Technical Analysis
⏳ Spot
💎 HNTUSDT after breaking above the significant resistance and the triangle, has done the retest. it already had a rejection from the Support. It is expected to go higher
🏁 Short & Medium Term
💵 Invest Only 5% of your Portfolio
🎳 Entry at market or 22.00
☕️ TP1 24.90
🍺 TP2 26.30
🍻 TP3 28.00
🍾 TP4 29.00
🍷 TP5 32.00
🍸 TP6 34.00
🍹 TP7 36.00
🎁 TP8 42.00
🚫 SL 19.00
Good Luck 🎲
Check the Links in Description and If you LIKE this analysis, Please support our page and Ideas by hitting the LIKE 👍 button. ❤️ Your Support is really appreciated! ❤️
Traders, if you have your own opinion about it, please write your own in the comment box. We will be glad for this.
Feel free to request any pair/instrument analysis or ask any questions in the comment section below.
We will have more FREE forecasts in TradingView soon
Have a Profitable Day
BTC Update analysisIt did not reach the high blue levels, but it may react to the yellow surface and fall off

BITCOIN fun fractal.. or something more?Those who follow me since my start here on TradingView or even way back on Reddit know that I am a big fun fractal comparison. I have been using this approach extensively especially on long-term technical analysis and more often than not, proves to be quite efficient.
The fractal comparison I am bringing to you today is again a long-term one on Bitcoin's last 18 month price action (after the COVID crash) against S&P500's 18 month price action in 2009/2010 (after the subprime mortgage crash). Now, you will tell me (and rightfully so) what on earth does Bitcoin today have to do with S&P back in 09/10? The answer in practical terms may be 'nothing'. I intend to present today's fractal more for some fun weekend discussion and less for technical analysis and trend recognition. Theoretically though when market psychology comes into play, market structures across different asset classes tend to have more similarities than differences. This goes on to prove than under the pressure of panic, fear (or equally euphoria in bull cycles), the human reactions in seemingly different markets may be exactly the same.
Take this fractal for example. See the common market structures, Golden Crosses, Death Crosses, the Head & Shoulder patterns, even the fake-outs breaking of the Support before the rebounds, all seems quite similar between two very different assets. I am not implying that Bitcoin will continue in the same price action as S&P500 did in 2010, but that fractal certainly proves that it would have been an extremely useful for investors that were looking for markers to buy the Bitcoin dip this May - July.
What do you think about it? Is this to you just a fun fractal for weekend discussion or something more? Feel free to share your work and let me know in the comments section!
Please like, subscribe and share your ideas and charts with the community!
--------------------------------------------------------------------------------------------------------
!! Donations via TradingView coins also help me a great deal at posting more free trading content and signals here !!
🎉 👍 Shout-out to TradingShot's 💰 top TradingView Coin donor 💰 this week ==> nevada999
--------------------------------------------------------------------------------------------------------

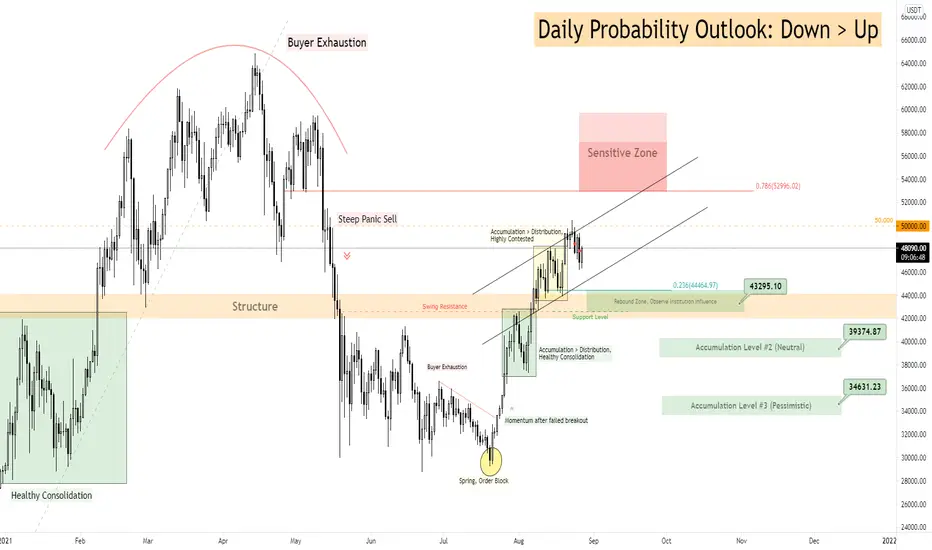
[Long-Term Hodlers Analysis] Waiting for a lower price entry.This is a follow-up from previous day BTC analysis.
From a daily timeframe view, we have seen solid red candle bodies with substantial trading volume backing it's movement.
From a 4-hourly timeframe view, we can observe short-term seller exhaustion.
As such, in the coming hours, we are likely to observe price retesting 48700 ~ 49300 levels.
Depending on the outcome, we can determine if the price has the momentum to retest 50000 level or drop towards 43200 level.
Based on my observation and opinion, a short-term downwards consolidation is likely going happen.
Even if it test 50000, the probability of a reversal still seems more likely.
My first buy order is set at 43200 to capture dropping price, if it happens.
You may check out my YouTube link below for video rundown of the above analysis.
BITCOIN Fibonacci levels showing $76k and $110k possible nextThe recent break-out has turned Bitcoin’s sentiment bullish again, at least on the short-term, but what about the long-term? On this analysis I am looking at the long-term price action, particularly since the benchmark of our times, the COVID market crash. In doing so, I have applied the Fibonacci extension levels (log scale on the chart).
** Fibonacci levels since the COVID crash **
As you see, those levels play quite a significant role in determining Resistance and Support pressure points. Notice how the 10500 level (1.0 Fib) acted as a Resistance (and double top in particular) in May 2020, then how it turned into the Support in October that kickstarted the great parabolic rally of October 2020 - April 2021.
The 2.0 Fib has been the Support since January 2021 and as you see has held on 5 occasions, the most recent one initiated the current rebound of July - August 2021. At the same time, the zone around every 0.5 interval (1.5, 2.5) usually turns into a high volatility area (within the wider .382 - .618 margins).
** Where are we now? **
Currently BTC is within that zone. Does this mean we should expect high volatility ahead and a pause of this July/ August rebound in September? It is not impossible. What is more important is what the target could be once the consolidation breaks.
Based on the two previous times, BTCUSD hit the next available Fib on both with (A) hitting 1.0, while (B) even managed to break above the 2.0 Fib and as high as 2.382 before it consolidated again. We can therefore argue that we are looking at either a High around $76000 (3.0 Fib) based on scenario (A) or even $110000 (3.382 Fib) based on scenario (B).
Time will tell, and it will certainly be interesting to see if history will repeat itself again! Do you think it will and if yes which of the two waves (A or B) is a more probable target? Feel free to share your work and let me know in the comments section!
Please like, subscribe and share your ideas and charts with the community!
--------------------------------------------------------------------------------------------------------
!! Donations via TradingView coins also help me a great deal at posting more free trading content and signals here !!
🎉 👍 Shout-out to TradingShot's 💰 top TradingView Coin donor 💰 this week ==> nevada999
--------------------------------------------------------------------------------------------------------
