BTC/USDT Buy Setup – VSA & Demand Zone Reaction✅ Entry: Current price action near 117,297
🎯 Target: 119,078 (+1.22%)
🛑 Stop Loss (SL): 116,944 (below demand zone)
📊 Technical Insight (Volume Spread Analysis):
Stopping Volume at Lows:
The recent down move halted with a wide spread down-bar on high volume, followed by an immediate rejection. This indicates potential professional buying absorbing supply.
No Supply Confirmation:
After the stopping volume, several narrow spread candles on low volume formed, suggesting weak selling pressure and a lack of commitment from bears.
Bullish Reaction:
Price rebounded from the demand zone with increasing volume on up-bars, showing early signs of demand dominance.
The current consolidation just above the support is typical of absorption before a markup phase.
Risk-Reward Structure:
The setup offers a favorable 2.2:1 R:R ratio, with the stop placed just below the zone to avoid false breakouts while allowing the trade room to breathe.
📌 Trade Plan:
Bias remains bullish as long as price holds above 116,944.
A breakout above the minor resistance (117,828) with volume expansion would confirm the next leg up toward the 119,078 target.
If volume fails to support the move, reassess before committing additional capital.
Btctechnicalanalysis

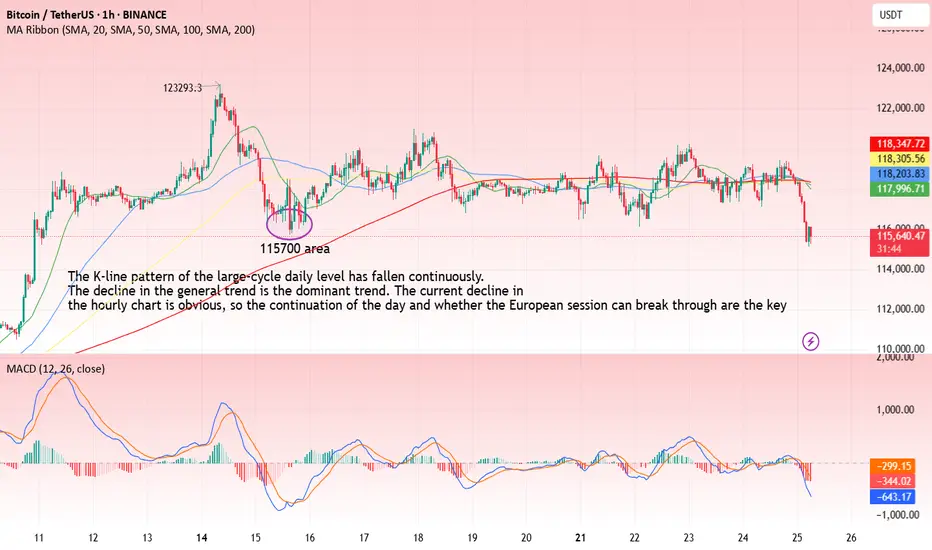
BTC-----Sell around 118000, target 116500 areaTechnical analysis of BTC contract on July 25:
Today, the large-cycle daily level closed with a small negative line yesterday, and the K-line pattern continued to fall. Although the price is at a high level, the attached indicator is dead cross. The current big trend is falling. From the overall trend and the trend law, the pullback is not strong. Instead of breaking the high, the decline is strong and continuous. Then the trend is also slowly changing. The key support position below is 115700 area, which is the position to pay attention to today and next week; the short-cycle hourly chart currently has a continuous negative K-line pattern, the price is below the moving average, and the attached indicator is dead cross. The continuation of the intraday decline is a high probability trend, and whether the European session can continue to break the previous low is the key. The current short-term resistance position is in the 118000 area.
Today's BTC short-term contract trading strategy:
Sell at the 118000 area of the pullback, stop loss at the 1118500 area, and target the 116500 area;
$BTC Breakout Coming?CRYPTOCAP:BTC is coiling up inside a symmetrical triangle on the 2H chart.
A breakout looks close if it clears resistance; we could see a 7.5% move toward the $127K–$128K zone.
Watch for volume confirmation.
DYOR, NFA

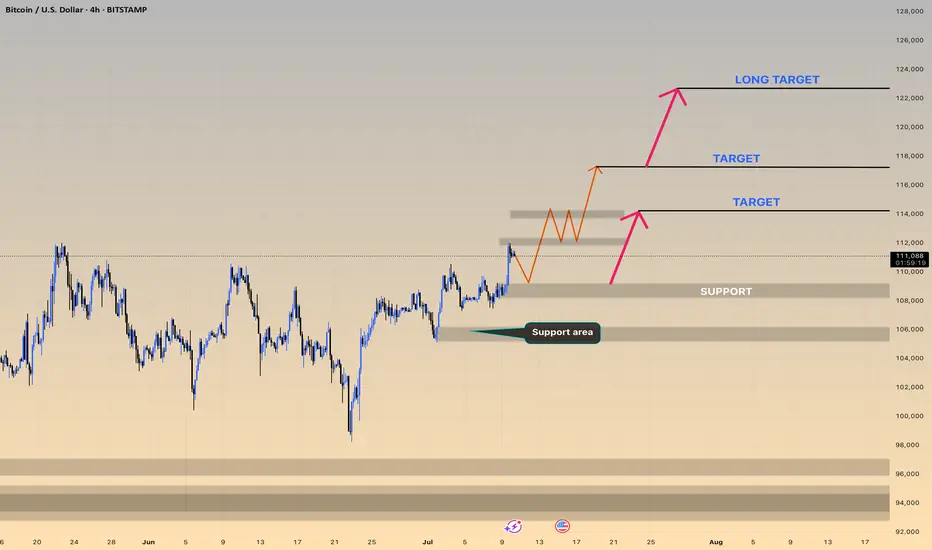
BTC Analysis — Long-Term Buy Zone AheadI'm watching $111,000 as a major buy zone on Bitcoin.
If price retraces to that level, I’ll be ready to enter a long position.
This is not a prediction — it’s a scenario.
Smart traders don’t guess, they prepare.
Let price come to your level. No chasing.
📍Set your alerts and stay patient.
Can Bitcoin reach new highs?Bitcoin reached around 121722, close to the expected target of 130,000. There are two current expectations:
1. Black line: 5-wave rising structure, currently in the 3rd wave rising, and there will be a 5th wave rising after the correction.
2. Purple line: abc rising structure, currently in the last wave c rising, will end the rise ahead of time.
The rise is not yet complete. If it falls below the lower track of the channel, the rise will end.

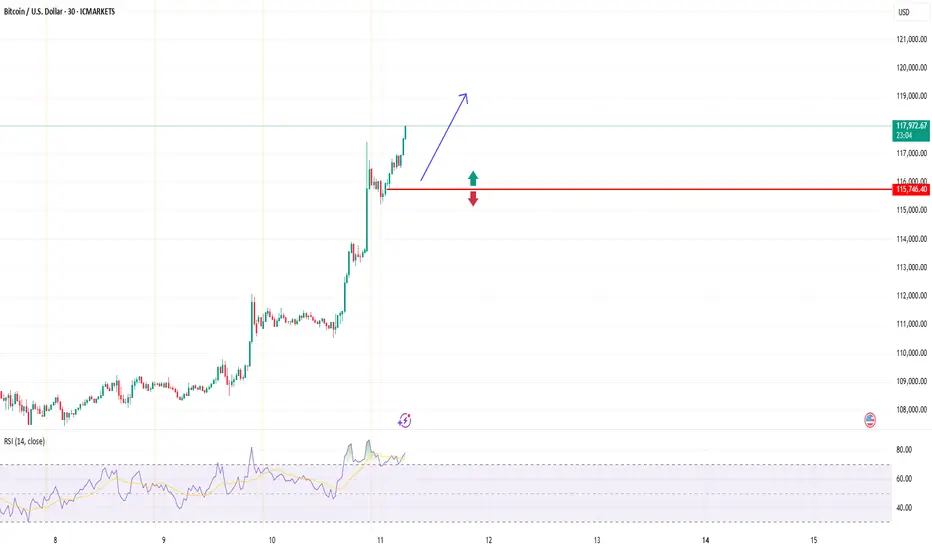
BTCUSD (Bitcoin): Forex Technical AnalysisDate: 11 July 2025
Momentum: Up
First Scenario : long positions above 115,706.14 with targets at 117,269.52, 117,904.51 and 118,513.05
Second Scenario : short positions below 115,706.14 with targets at 114,544.35, 113,774.89 and 113,053.39
Comment: RSI - Bullish.
Supports and resistances :
118,513.05 **
117,904.51 *
117,269.52
116,747.25 - Last price
114,544.35
113,774.89 *
113,053.39 **
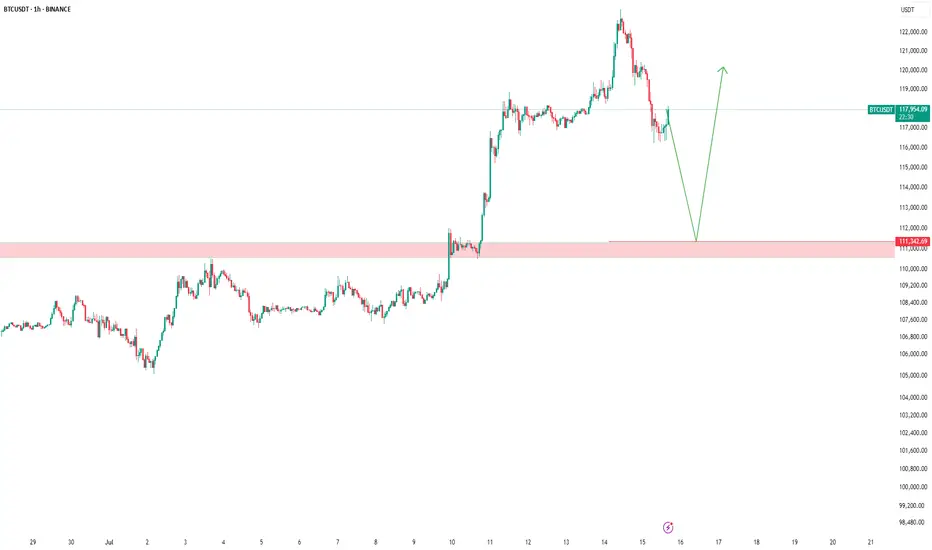
ARE YOU READY FOR 150K+ BTC RALLY !!!BTC has successfully broken out it's bull flag resistance and currently testing above it.
Major resistance resides above is 112K level , if we successfully break and hold above it then easy targets would be 130-150k levels.
Elliott Wave Count final targets 180k level.
If we goes below 106k level then we may see BTC getting into support region of 102-100K region.
For all of this, BTC should remain above 98K level.

BTCUSD BULLISH MORE all time high again The price may briefly break above the 113,000–114,000 level (first target) to trap long positions, then sharply reverse.
Support Break Warning:
If BTC fails to hold the 110,000–108,000 support zone, it could accelerate a drop to deeper supports:
Support Area 1: 106,000
Support Area 2: 102,000
Extreme Bearish Target: 96,000–94,000
What to Watch:
Bearish divergence on lower timeframes
Volume drop on new highs = possible fakeout
Candle rejection from 113,000–114,000 zone
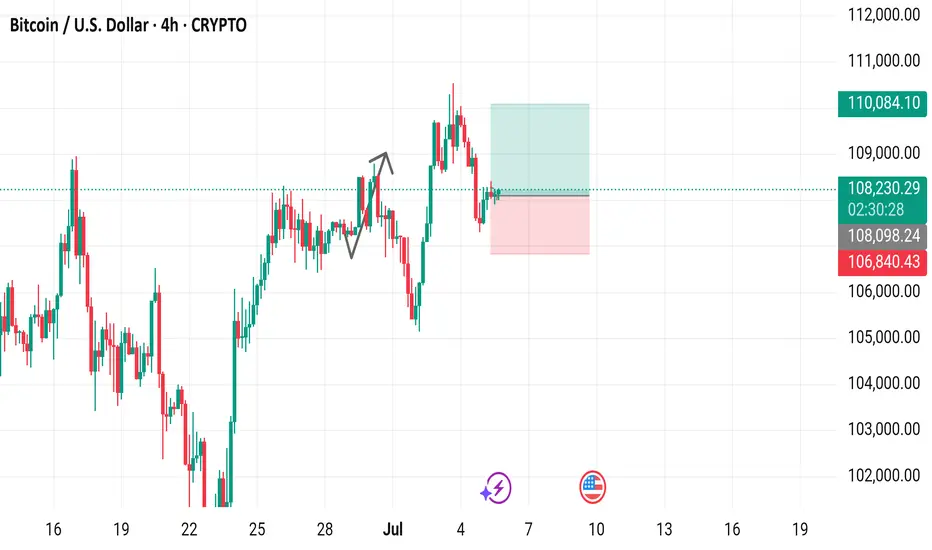
Bitcoin / U.S. Dollar 4-Hour Chart - CRYPTO4-hour candlestick chart displays the Bitcoin (BTC) to U.S. Dollar (USD) price movement, currently at $108,252.17 with a 0.21% increase (+$230.82). The chart highlights a recent upward trend with key price levels marked, including a buy price of $108,252.17 and a sell price at the same level. Support and resistance zones are indicated with a pink shaded area around $106,840.43 to $108,252.17 and a green shaded area near $110,084.10. The chart spans from late June to July 7, 2025, with the latest data point at 06:27 PM PKT on July 5, 2025.
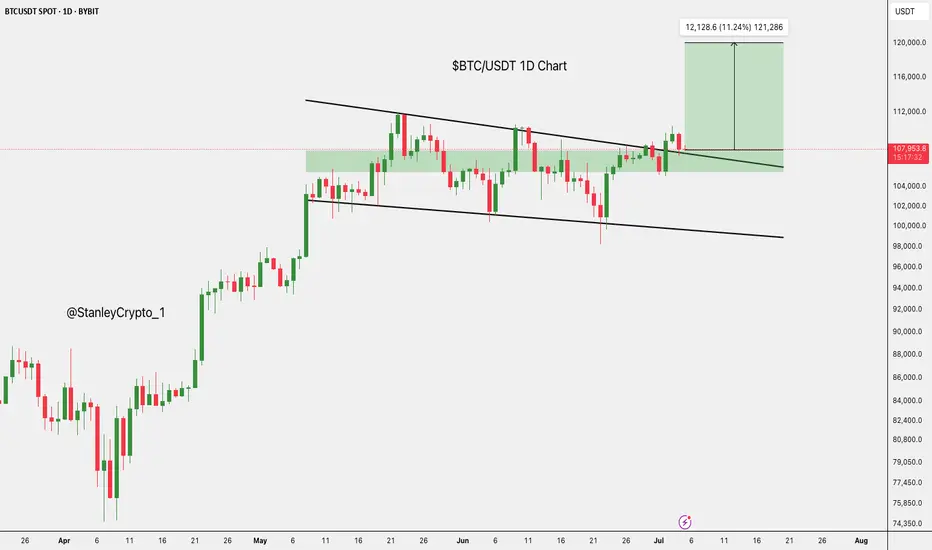
$BTC/USDT daily chart $121K next.CRYPTOCAP:BTC just broke out of a descending wedge on the daily chart, a strong bullish signal.
It’s now holding well above key support and the 50-day moving average, showing buyers are in control.
If BTC stays above $106,400, we could see a move toward $121K next.
DYRO, NFA
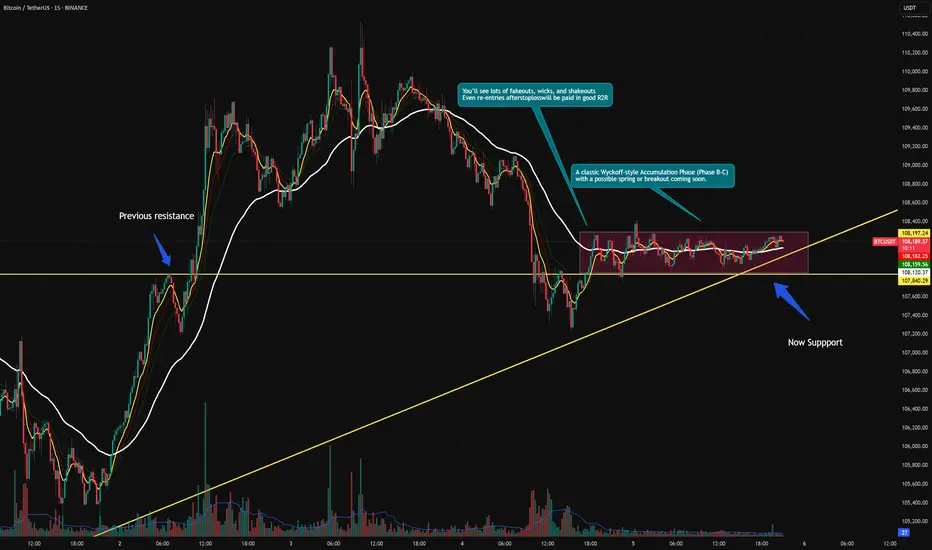
BTCUSDT – Accumulation Confirmed? Wyckoff Blueprint Playing Out Bitcoin continues to compress inside a defined range, resting above both a rising trendline and a former resistance turned support zone. This structure fits cleanly within a Wyckoff-style Accumulation Phase (B-C).
We’re now at a critical moment where smart money may be absorbing supply, preparing for the next phase.
🔍 Key Observations:
Range-bound price action with higher lows and muted volume
Spring-like wick and recovery from the bottom of the range
Support holding at prior breakout zone and ascending trendline
Structure shows signs of stealth accumulation with a possible breakout ahead
Sideways movement with fading volatility
Gradual compression within the range
Strong support defended multiple times (might make the support weaker as well !)
A potential spring/retest event may already be in play
You’ll see fakeouts, wicks, and hesitation in this phase — designed to trap weak hands. But the underlying behavior points to preparation, not distribution.
The quiet before the markup. Let the market reveal its hand. 📈
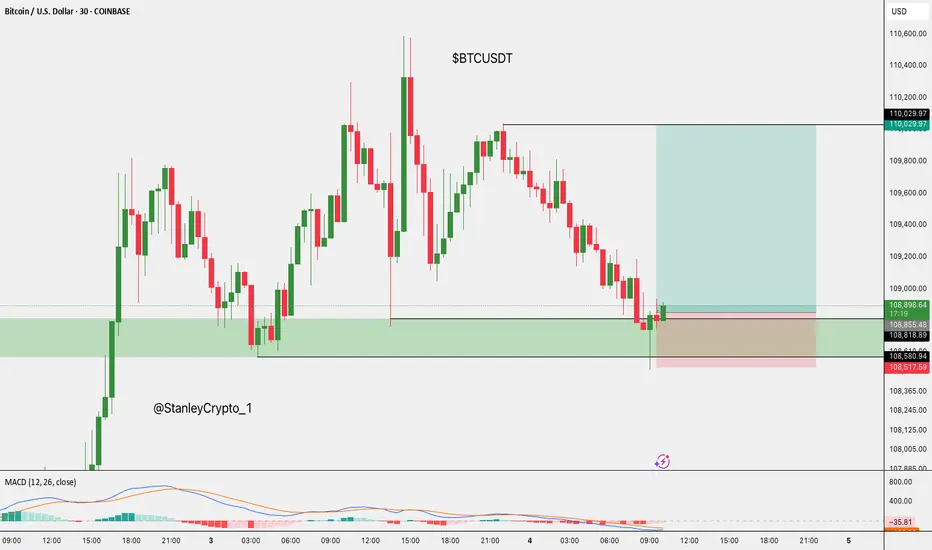
$BTC Long Setup. CRYPTOCAP:BTC Long Setup
Price bounced from the key demand zone.
- Entry: CMP
- SL: $108,517
- TP: $110,030
DYOR, NFA
BTC shorting opportunity comes againBTC climbed above 108000 again, and the short-term bullish power was slightly stronger. According to the current strength, BTC still has room for growth, but it is still under pressure in the 109000-110000 area in the short term; if there is no major positive news, BTC may find it difficult to break through the resistance area in the short term under the current conditions, and may even experience stagflation and retreat again after approaching the resistance area.
Therefore, I think shorting BTC with the help of the resistance area is still the first choice for short-term trading. We can boldly short BTC in the 108500-109500 area and look towards the target area around 106000 again.
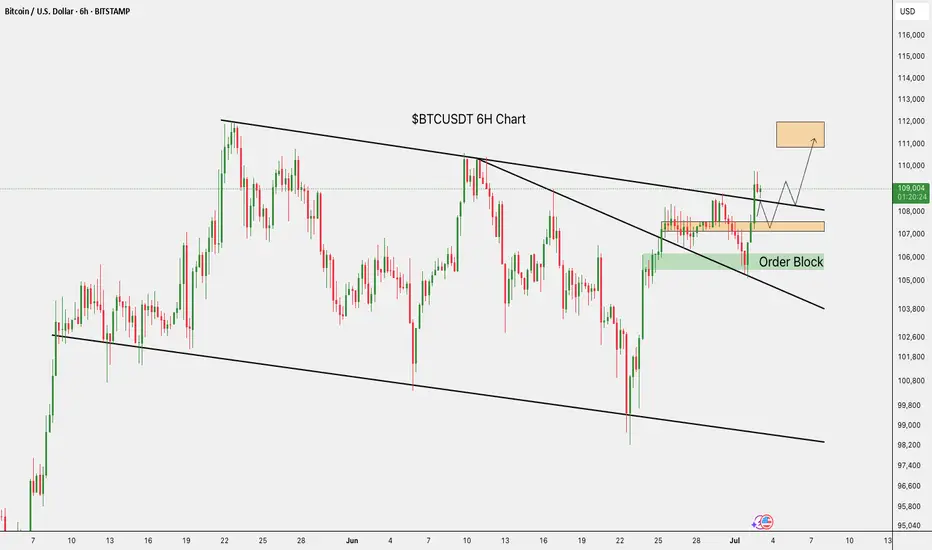
$BTC/USDT 6H Update BTC has broken out and is now retesting the breakout zone.
If this level holds, we could see a push toward $111K–$112K.
Key support remains around $108K.
DYRO, NFA
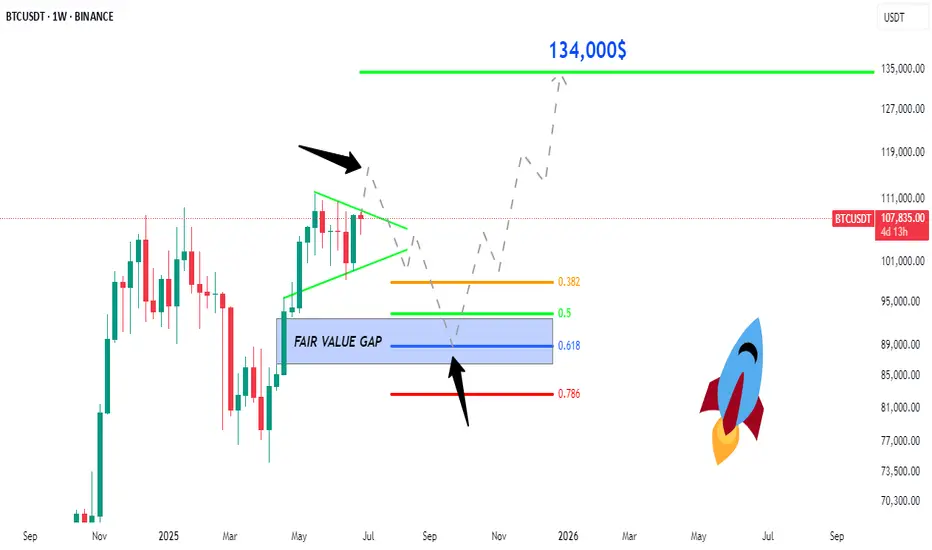
BTC: Price to 134,500$ , FVG, Fib 0.5 and 0.618 ratio ?Price to 134,500$:
Bitcoin is now moving in a triangle pattern, which is getting smaller. The price is around $107,758. Here is possible move is a breakout to the downside first, where the price may drop to fill the "Fair Value Gap" area, which is marked in purple. This area is between the Fibonacci levels of 0.5 and 0.618. After that, Bitcoin could go up again and reach the price of $134,000.
Trade Ideas:
I marked 2 areas with arrow let the price reach here and wait for confirmation in both areas. Specially in Fair Value Gap area.
Trade Signal:
I will provide both trade signal here so follow my account and you can check my previous analysis regarding BITCOIN. So don't miss trade opportunity so follow must.
BINANCE:BTCUSDT BITSTAMP:BTCUSD COINBASE:BTCUSD COINBASE:BTCUSD BINANCE:BTCUSDT.P CRYPTO:BTCUSD BYBIT:BTCUSDT.P BINANCE:BTCUSD
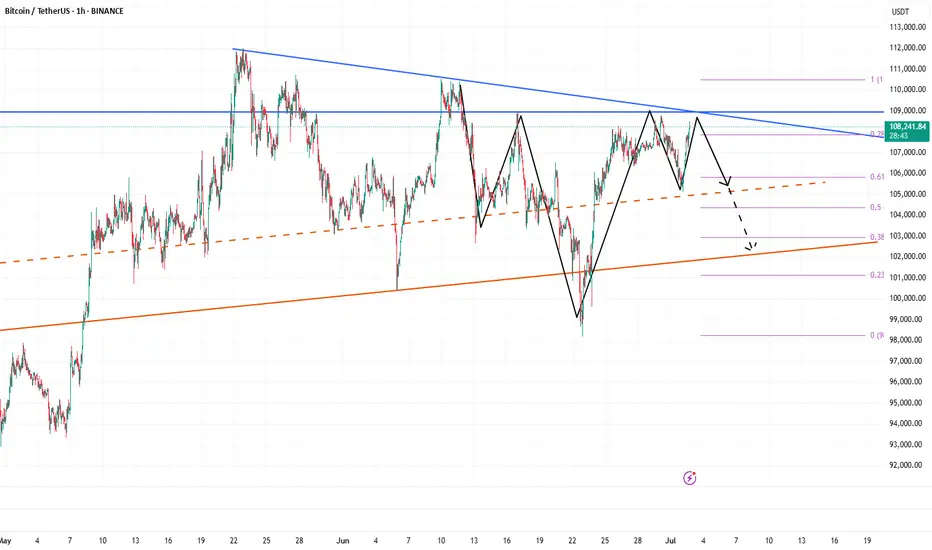
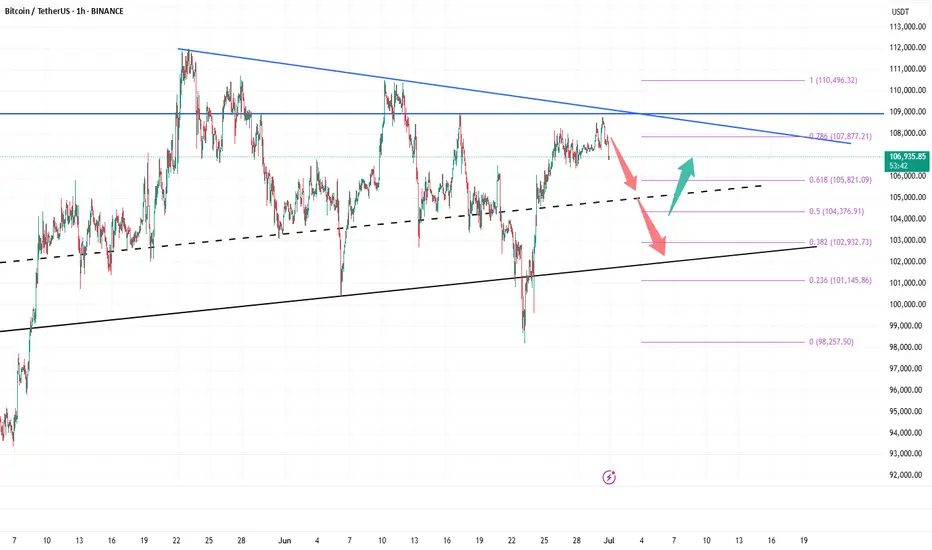
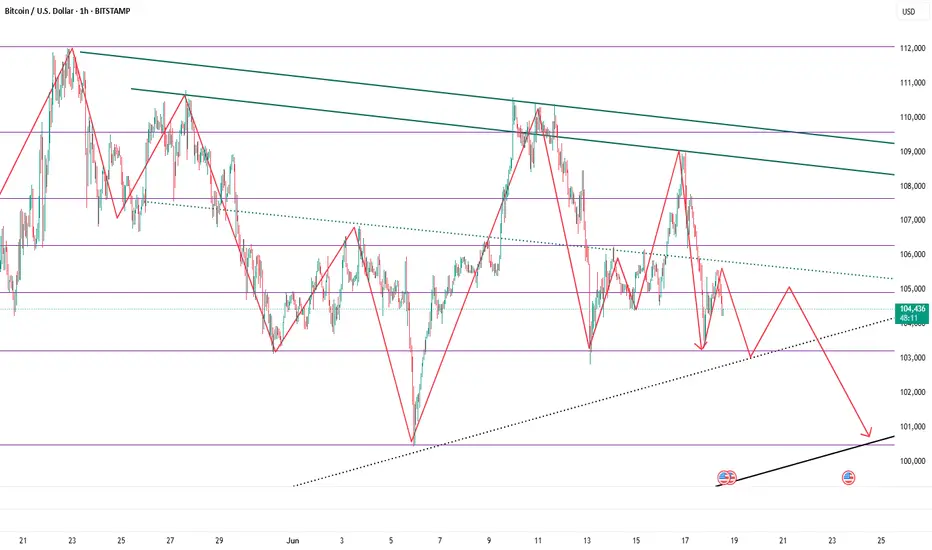
Short BTC, it is about to retrace and test 100000 again!As BTC gradually fell back, the rebound did not stand above 110,000 in the short term, proving that there is strong selling pressure above, and the trend line formed by the technical high point 111,000 and the second high point 110,000 formed an important resistance area, which limited the rebound space of BTC and strengthened the demand for BTC's short-term retracement.
According to the current trend, the short-term oscillation bottom area of 106,000 may be broken at any time. Once it falls below the oscillation area, it may arouse a certain degree of profit-taking chips and stimulate BTC to accelerate its decline. I think BTC will at least test the 105,000-104,000 area again during the retracement, and may even test the 100,000 integer mark again.
Therefore, shorting BTC is still the preferred option for current short-term trading.
Consider shorting BTC in the 108,000-109,000 area, and the target area in the short term is 104,500-103,500. After breaking this area, the target can be extended to 101,000-100,000.
BINANCE:BTCUSDT BINANCE:BTCUSDT BITSTAMP:BTCUSD
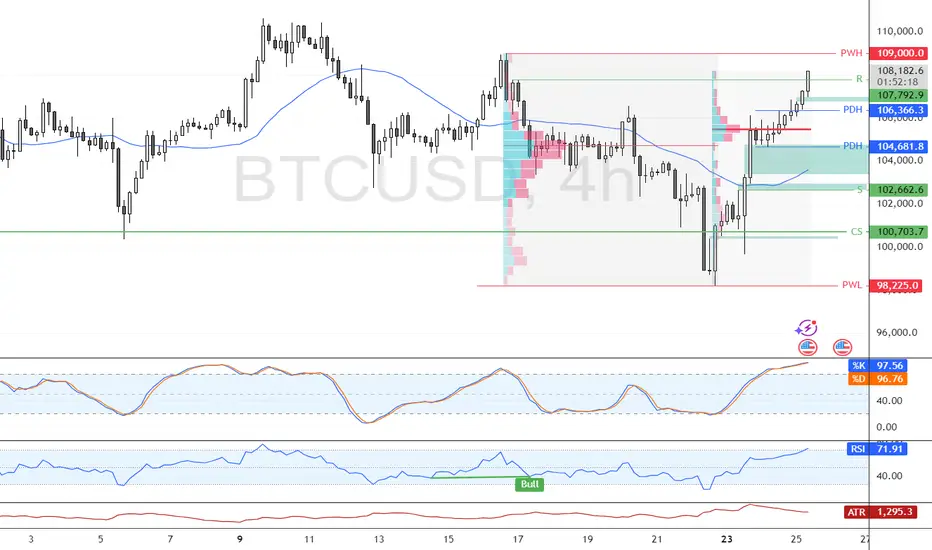
Bitcoin Climbs Above $107K with Overbought Signals in PlayBitcoin closed above the 107,792 resistance after breaking the previous day's high. RSI and Stochastic indicators show overbought conditions, signaling short-term overpricing.
BTC may test the $109,000.00 resistance next, followed by a potential pullback toward $104,618.00, offering a favorable entry point for bulls.
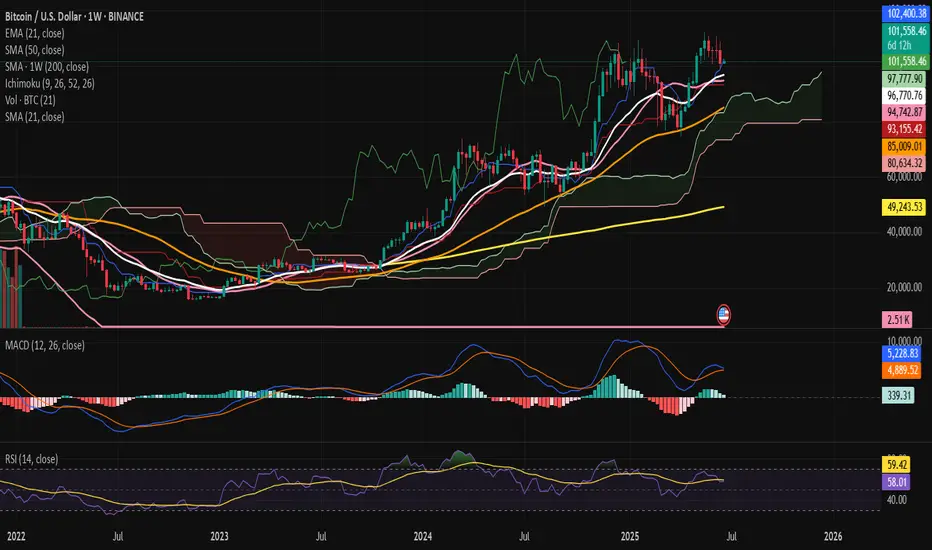
Bitcoin Between Conviction and Caution - The Market Suspended?⊢
⟁ BTC/USD – BINANCE – (CHART: 1W) – (Date: June 23, 2025).
⟐ Analysis Price: $101,226.28.
⊢
⨀ I. Temporal Axis – Strategic Interval – (1W):
▦ EMA21 – ($96,740.64):
∴ Price remains above the 21EMA, confirming bullish structural integrity in medium trend;
∴ The slope of EMA21 remains positive, reinforcing sustained market momentum;
∴ Most recent candle printed a higher low above the 21EMA, reaffirming it as dynamic support.
✴️ Conclusion: The 21EMA upholds the current cycle's bullish engine - it is the first invalidation level for any mid-term reversal.
⊢
▦ SMA50 – ($85,002.38):
∴ SMA50 sits considerably below current price, reflecting distance from mean reversion zones;
∴ Market remains extended, but no immediate signs of pullback toward this structural level;
∴ The last interaction with SMA50 was in late 2023, when it confirmed trend resumption.
✴️ Conclusion: SMA50 defines the core mid-range support - no threat to it unless a breakdown accelerates below EMA21.
⊢
▦ SMA200 – ($49,241.87):
∴ SMA200 remains deeply below market, showing that the macro bullish structure remains unchallenged;
∴ Distance from SMA200 reflects the strength and maturity of this cycle’s trend;
∴ Long-term investors remain in profit and structurally supported.
✴️ Conclusion: No macro breakdown as long as price stays well above SMA200 - the secular bull phase is intact.
⊢
▦ Ichimoku Cloud – (Kumo, Tenkan, Kijun, Chikou Span):
∴ Price is trading clearly above the Kumo (cloud), showing sustained bullish dominance;
∴ Tenkan-sen and Kijun-sen lines are positively stacked, with Tenkan still leading;
∴ Chikou Span is above price and cloud, confirming long-term bullish alignment.
✴️ Conclusion: All Ichimoku components confirm bullish control - weakening only upon Tenkan/Kijun flattening or bearish cross.
⊢
▦ MACD – (MACD: 318.17 | Signal: 4,884.24):
∴ MACD line is far below the signal line, though attempting a bottoming curve;
∴ The histogram remains red but with decreasing amplitude - bearish momentum is fading;
∴ No bullish crossover yet - momentum remains negative but weakening.
✴️ Conclusion: MACD suggests waning bearish cycle, but no official reversal signal until crossover and histogram neutralization.
⊢
▦ RSI + EMA21 – (RSI: 57.71 | RSI EMA: 59.39):
∴ RSI remains in bullish territory above 50, although flattening below its EMA;
∴ No bearish divergence observed yet - RSI is consolidating;
∴ If RSI reclaims its EMA, strength may resume; if rejected again, loss of momentum may escalate.
✴️ Conclusion: RSI reflects structural strength, but cautious momentum - monitoring RSI/EMA relationship is critical.
⊢
▦ Volume + SMA21 – (Vol: 2.51K):
∴ Weekly volume remains below the 21-week average, indicating weakening participation;
∴ Last few candles show declining volume despite price stability - possible distribution;
∴ Absence of buyer aggression may limit further upside near-term.
✴️ Conclusion: Volume suggests lack of conviction - momentum exists, but crowd participation is thinning.
⊢
🜎 Strategic Insight – Technical Oracle:
∴ Bitcoin's weekly chart maintains bullish structural posture above all key moving averages, yet momentum indicators reflect hesitation;
∴ The Ichimoku system confirms trend dominance, but MACD and RSI signal that internal strength is not expanding - only sustaining;
∴ Volume contraction reveals market indecision or fatigue, potentially foreshadowing consolidation or rebalancing phases;
∴ Despite no structural breakdown, directional conviction is lacking - further upside demands renewed volume and momentum alignment.
⊢
☍ II - GAP CME – BTC1! – Chicago Mercantile Exchange:
▦ Previous CME Close – ($99,640.00) + Spot Opening Binance – ($100,980.77):
∴ A clear upside gap is present between the institutional close and the retail spot open, measuring approximately $1,340.77, thus defining a latent Magnet Zone for downward pullback;
∴ This CME gap forms a critical vacuum range between $99.640 and $100.980, which will likely act as a liquidity reabsorption zone if spot retraces;
∴ No immediate fill has occurred, suggesting current bullish momentum persists despite latent imbalance.
∴ The latest weekly CME candle closes with a smaller real body and a pronounced upper wick — a classical signal of buy-side exhaustion below macro resistance ($102K–$103K);
∴ Despite the weakening thrust, no breakdown has yet been printed — the bullish structure remains technically intact above previous weekly lows;
∴ Volume prints are non-expansive, indicating lack of conviction among institutional buyers at this level — vigilance is required.
✴️ Conclusion: The CME structure reveals a latent institutional gap magnet to the downside, with price now suspended above an untested imbalance. The technical structure remains constructive but fragile. Further confirmation from the spot market will determine whether continuation or reversion will manifest in the coming cycle.
⊢
∫ III. On-Chain Intelligence – (Source: CryptoQuant):
▦ Exchange Inflow Total – (All Exchanges):
∴ A recent spike in total Bitcoin inflows aligns directly with the $101K zone, signaling increased movement of coins from wallets to exchanges;
∴ Historically, such inflow spikes near local tops indicate preparation for distribution or profit-taking by large holders;
∴ Current inflow levels exceed previous consolidation phases, amplifying the risk of sell pressure activation.
✴️ Conclusion: The market is facing elevated short-term risk from exchange-bound liquidity — inflows confirm readiness to sell into strength.
⊢
▦ Spot Taker CVD – (Cumulative Volume Delta, 90-Day) – (All Exchanges):
∴ The 90-day CVD curve shows clear flattening and early reversal near resistance, indicating a shift in taker behavior;
∴ Passive sell-side absorption appears to dominate, reducing the strength of buy-side aggression;
∴ Price action continues upward while CVD retreats, forming a classic hidden distribution divergence.
✴️ Conclusion: CVD reveals taker exhaustion - without resurgence in spot demand, current price levels are vulnerable to sell-offs.
⊢
▦ Exchange Inflow Mean – (7-Day Moving Average) – (All Exchanges):
∴ The 7DMA of inflow mean remains elevated, suggesting sustained presence of large-sized transactions heading toward exchanges;
∴ This behavior often precedes institutional or strategic sales, especially when combined with total inflow spikes;
∴ No decline in the inflow mean implies continuous preparation for short-term distribution.
✴️ Conclusion: Elevated inflow mean confirms that whales and large actors are preparing or executing strategic exits.
⊢
▦ Funding Rate – (All Exchanges):
∴ Rates across global derivatives platforms remain slightly positive but without speculative imbalance;
∴ The neutral-positive range suggests cautious optimism among traders - not overleveraged, but not afraid;
∴ No signs of euphoric long build-ups, which reduces liquidation risk but weakens breakout fuel.
✴️ Conclusion: A neutral funding environment supports consolidation, not explosive upside — no immediate directional conviction.
⊢
▦ Funding Rate – (Binance):
∴ Binance-specific funding remains tightly aligned with global averages, reflecting no localized distortion;
∴ Positive, stable readings indicate low speculative friction, but also lack of trend-defining aggression;
∴ Historical patterns show that breakout rallies typically require a surge in funding rate — not present yet.
✴️ Conclusion: Binance traders are balanced - not short-squeezed nor euphoric - bias remains neutral until imbalance arises.
⊢
▦ Realized Price – Short-Term Holders (MVRV-STH) – (~$47.5K):
∴ Price trades far above the STH realized price, indicating most recent buyers are deep in unrealized profit;
∴ This dynamic historically increases the chance of sell pressure at resistance zones, especially when inflows are high;
∴ No downward compression or convergence - suggesting strength remains, but realization is a persistent risk.
✴️ Conclusion: STH's are exposed to high profit levels - the market is primed for potential realization, but not structural weakness.
⊢
🜎 Strategic Insight – On-Chain Oracle:
∴ Exchange-based signals (Inflow Total, Mean) confirm active preparation for sell-side flow;
∴ Spot aggression is fading as per CVD divergence, weakening breakout thesis despite strong price structure;
∴ Neutral funding and passive miner/on-holder behavior reflect structural balance - not panic, not euphoria.
✴️ Conclusion: The market rests in a zone of speculative tension - directionally undecided, but operationally sensitive to imbalance triggers.
⊢
⌘ Codicillus Silentii – Strategic Note:
∴ The temporal structure signals resilience, but lacks expansion - technical relief exists without structural thrust;
∴ On-chain flows unveil transactional friction at current levels, with capital cycling toward liquidity zones (exchanges);
∴ Market energy is neither compressed for breakout nor collapsed into capitulation - a state of coiled hesitation;
∴ Asymmetry remains hidden within equilibrium - vigilance, not movement, defines the moment.
⊢
𓂀 Stoic-Structural Interpretation:
▦ Structurally Neutral:
∴ Price holds above key macro supports (EMA21, SMA50), confirming preservation of the bullish superstructure;
∴ Long-term holder behavior and miner flows remain passive - structural integrity is undisturbed;
∴ However, no active thrust or trend validation emerges - the system sustains but does not ascend.
⊢
▦ Tactically Cautious:
∴ Exchange inflows and CVD divergence signal short-term vulnerability near key resistances;
∴ Technical indicators (MACD, RSI, Volume) reflect a condition of deceleration - momentum is reactionary, not foundational;
∴ Until price reclaims volume-weighted levels with confirmation, the posture remains defensive and watchful.
⊢
⧉
⚜️ Magister Arcanvm (𝟙⟠) – Vox Primordialis!
𓂀 Wisdom begins in silence. Precision unfolds in strategy.
⧉
⊢
Bitcoin Price Analysis: Potential Rebound Ahead?4-hour Bitcoin price chart reveals a potential rebound opportunity. After a sharp decline, the price has stabilized around $97,245.43, forming a support level. The green and red box annotations suggest a possible price range breakout, with an upward arrow indicating a potential price increase. The current price stands at $100,461.58, down 1.63% from its recent peak. Will Bitcoin bounce back or continue its downward trend?

BTC is expected to continue its decline to 100,000BTC has encountered resistance and fallen back several times near 110,000, forming an absolute suppression in the short term. It is difficult for BTC to overcome this resistance area in the short term. As BTC has been unable to break through for a long time, some profit-taking and panic selling will cause BTC to gradually collapse. At present, BTC has fallen back to around 104,000. During the retracement, it has built a short-term resistance area of 105,500-106,000, which limits the rebound space in the short term and will further strengthen the bearish sentiment in the market. BTC will completely open up the downward space.
At present, the 103,000-102,500 area still has a certain support effect on BTC. As BTC shows a volatile downward trend, this support area will be broken again and continue to fall to the area near 100,000. Therefore, in short-term trading, we can consider shorting BTC in the 105,000-105,500 area.
BINANCE:BTCUSDT BITSTAMP:BTCUSD BINANCE:BTCUSDT COINBASE:BTCUSD
Bitcoin / U.S. Dollar 2-Hour Chart (BTCUSD)2-hour chart displays the recent price movement of Bitcoin (BTC) against the U.S. Dollar (USD), showing a current price of $102,459.21 with a decline of $853.19 (-0.83%) over the period. The chart highlights a significant drop from a peak near $105,898.45, with a shaded area indicating a potential support zone between $101,682.19 and $99,732.49, and a resistance level around $103,000. The timeframe spans from 9:00 to 29:00, with technical indicators and price levels marked for analysis.

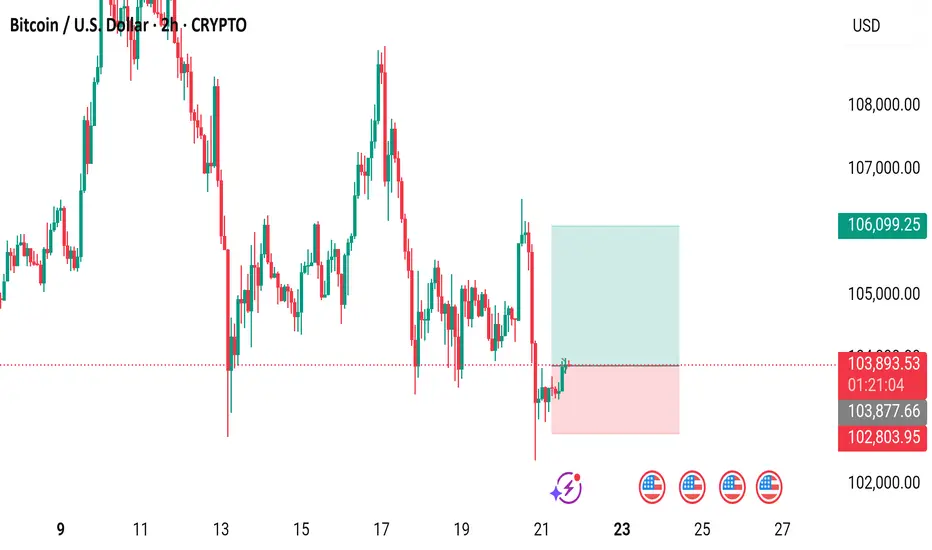
Bitcoin (BTC/USD) 2-Hour Candlestick Chart2-hour candlestick chart displays the recent price movement of Bitcoin (BTC) against the U.S. Dollar (USD), showing a current price of $103,904.89 with a gain of $595.12 (+0.58%) as of 01:22:41. The chart highlights a volatile period with significant price fluctuations, including a sharp drop followed by a recovery, and includes key price levels such as $106,099.25 and $102,803.95. The chart also features a highlighted support zone in pink and a resistance zone in light blue