Is Bitcoin (BTC) Setting Up for a Pullback and An Opportunity?👀 👉 Bitcoin (BTC) has recently dipped from a key liquidity area and is now revisiting previous highs. This movement has traders watching closely for what could come next. I'm eyeing a possible buying setup, but only if it retraces to a balanced price level and confirms with a bullish structural shift. 🛠️ Disclaimer: This video is for educational purposes only and does not serve as financial advice. Always do your own due diligence and trade responsibly. 📢
Btctechnicalanalysis

Is Bitcoin on the Verge of a Major Crash? Warning Signs Ahead!👀👉 Bitcoin (BTC) has recently surged to all-time highs, but is the rally about to reverse? On the 1M monthly timeframe, a key horizontal resistance level is flashing warning signals. BTC appears heavily overbought, and the trend shows clear signs of overextension.
📉 Using advanced trading concepts like Wyckoff theory and ICT methodology, this video breaks down:
- How historical price action reveals similar overextended moves that led to significant pullbacks.
- Why the Fibonacci tool suggests a potential retracement to equilibrium after a parabolic price swing.
- The lack of smart money accumulation since the last major price breakout, signaling potential vulnerabilities.
🔍 We’ll examine two key scenarios:
1. Bearish Opportunity: If price action breaks structure and takes out existing range lows, it could signal a deeper correction.
2. Bullish Opportunity: If BTC trades into a discounted zone below equilibrium, this could present a strong buy opportunity for longer-term positioning.
📊 This analysis is for educational purposes only and highlights the importance of managing risk in a market known for its volatility. Past performance is no guarantee of future results—trade wisely and always assess your risk tolerance!
👉 Don’t miss this critical breakdown. Learn how to read the charts like a pro and prepare for what’s next in Bitcoin’s journey!📊

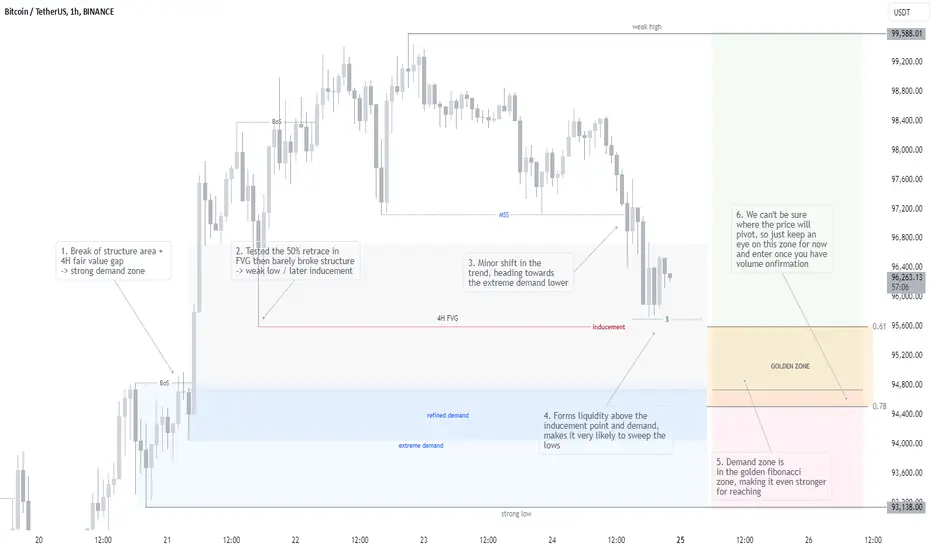
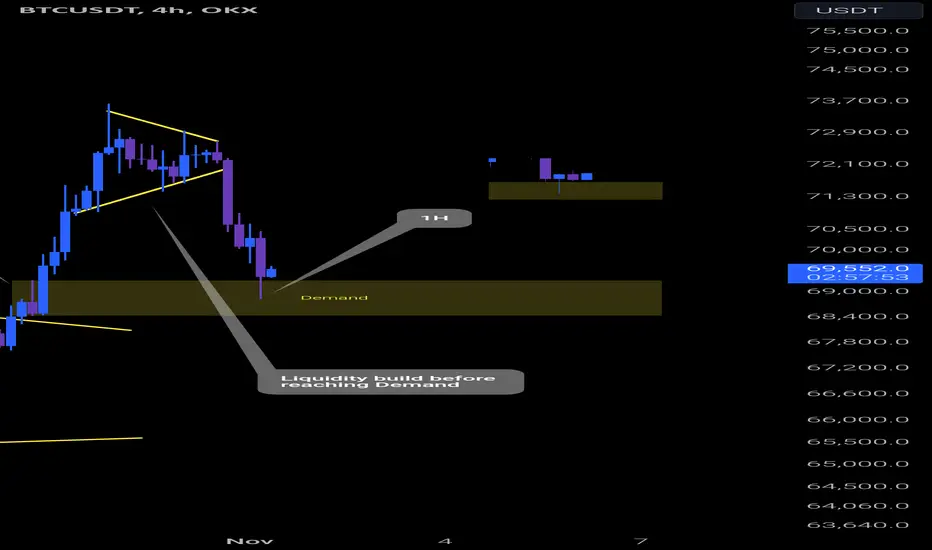
#BTC Price Update - Last pullback before $100KAre you ready to catch this juicy pullback before the legendary leg to $100k+?
This is a great moment in history so mark profit with this trade!
we are now in the 4H fair value gap
liquidity is forming right above the extreme demand zone
stochastic RSI is forming a massive hidden bullish divergence
It's gonna be a big one so make sure to watch the golden zone
Elliot wave idea for BitcoinA potential scenario for Bitcoin to surprise everybody can be like this and why I think it might happen.
1.Fed balance sheet is still shrinking
2.When they cut the rates at some point the bad data will come (High unemployment ,risk of reccesion)
3.This time there is a big lag between ETH/Alts and Bitcoin
I might be wrong but I will not be surprised if this happens.Confirmation will be in December - January 2025.

BTC Next Corrective Move! Read CaptionCRYPTOCAP:BTC Next corrective move will be 81900, 5 impulsive move done, 2 corrective move also done ( A, B) of Elliot Wave Now the 3rd (C) Wave coming!

Bitcoin Price Movement ExpectationsYou all are on board, now you gotta realize that everyone cant go.
They Will shake people out, make sure you are not overleveraged and play accordingly.
Good Luck!

BTC/USDT.P updateDaily candle closed belowed the mid point of a major seller zone, meaning seller are in control and we are likely to see some more bearish action this coming week.... We have also completed a bearish Crab harmonic pattern with TP1 set for 76397.5 and potentially TP2 for 65889. HTF harmonics are usually pretty accurate so I think the daily time frame retrace I've been looking for is potentially coming soon. Be ready. @Nate Alert
Please don't blindly trade short lol, make sure you do proper risk management and only enter at price points that are reaction zones
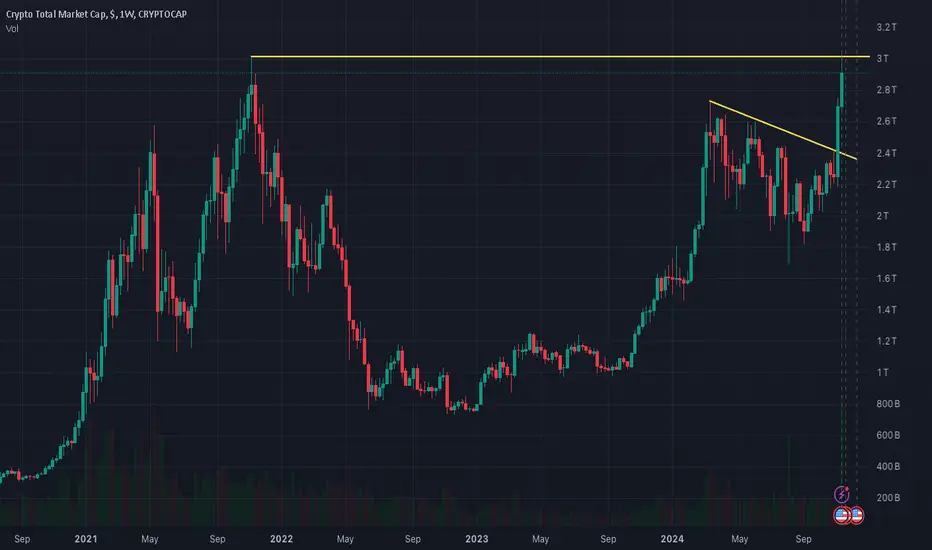
Why we are not going to 100k in BTC?It is because we are at 3T resistance once clear we can see 100k and we need some more good news to move forward. For now we just need to hold this important level.
ALT season will start when BTC dominance will drop to 50%.
#BTC/USDT hiTS $93K What's next? Urgent Update! Bitcoin is straightforward: Watch for liquidity around $88,083 and $89,696 on the hourly chart. These are critical levels for the bulls to defend.
With no significant resistance, a move to the $100K mark seems likely. However, since everyone is eyeing $100K, we might not reach it as quickly as expected.
BTC has enjoyed a massive rally over the past few weeks and may need a halt, but you never know!
Invalidation: a close below $85,314.
Let me know your thoughts in the comments!
#PEACE

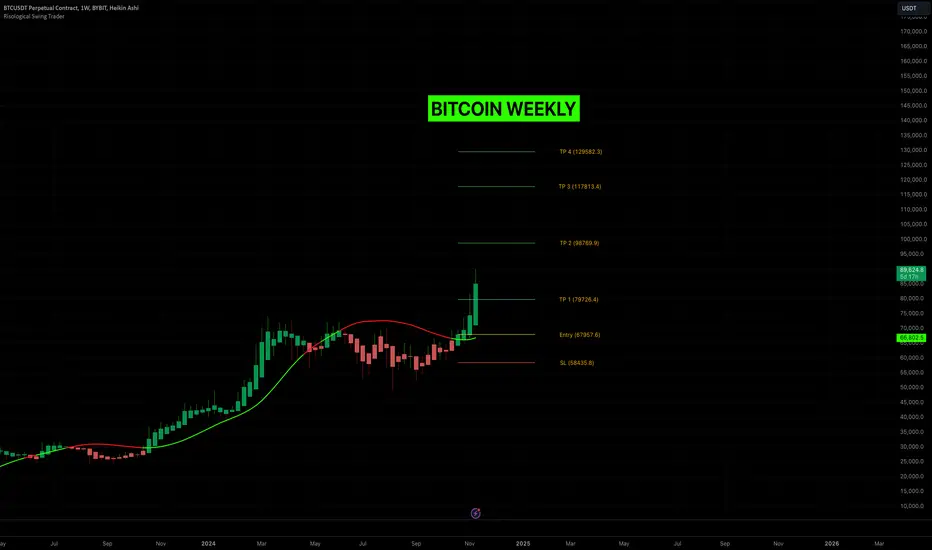
BITCOIN Weekly Chart Targets Massive $129,500!!BTCUSDT Analysis:
The Bitcoin Weekly Chart is setting the stage for a monumental move with TP1 already achieved, and all eyes now on the higher targets. The final target of $129,582.3 suggests the potential for a historic rally as technical indicators and market sentiment align in favor of the bulls.
BITCOIN Trade Overview:
Entry: $67,957.6
Stop Loss (SL): $58,435.8
INDICATOR USED: Risological Swing Trader
BITCOIN LONG TRADE TARGETS:
TP1: $79,726.4 ✅
TP2: $98,769.9
TP3: $117,813.4
TP4: $129,582.3
Key Observations:
Weekly Breakout: Bitcoin's weekly chart shows a significant breakout from key resistance levels, with strong momentum driving prices higher.
Moving Averages Cross: A bullish cross of the moving averages underpins the ongoing rally, signaling sustained buyer strength.
Market Sentiment: Bitcoin is riding a wave of positive sentiment, bolstered by institutional interest and increasing adoption narratives.
BTC Outlook:
Bitcoin’s momentum on the weekly timeframe suggests a continued rally towards TP2 and TP3, with the possibility of reaching TP4 under strong market conditions. Traders should monitor weekly closes to confirm the rally's sustainability, while maintaining risk management strategies.
Conclusion:
Bitcoin’s long-term technical setup is firing on all cylinders. With TP1 already hit, the path toward the final $129K target could unfold as momentum builds. This is a trade that will be remembered for years to come!
HOW TO GET RICH PREDICTING BITCOINS BULL RUN & CRASH! TUTORIALCOINBASE:BTCUSD NASDAQ:IBIT AMEX:BITX
HOW TO GET RICH PREDICTING BITCOINS BULL RUNS & CRASHES! TUTORIAL
In this must-watch tutorial, I'll reveal the secrets to predicting Bitcoin's rise and fall with stunning accuracy. Join me as I walk you through four distinct indicators that you can use to jump into Bitcoin before massive runups and dodge huge crashes. Whether you're a seasoned trader or a crypto newbie, these insights will transform how you approach the market. Don't miss out on this exclusive analysis that could change your financial future!
Smash that like button and follow for more game-changing strategies, ideas, and tutorials!

Bitcoin update before enter the weekendA small bitcoin update before we go into the weekend... I expect a small correction due the LTF distribution of Bitcoin...

BTC Trade IdeaBTC BITCOIN is overextended, Im looking for a break of the range low and continuation for a counter trend short. Not financial advice.

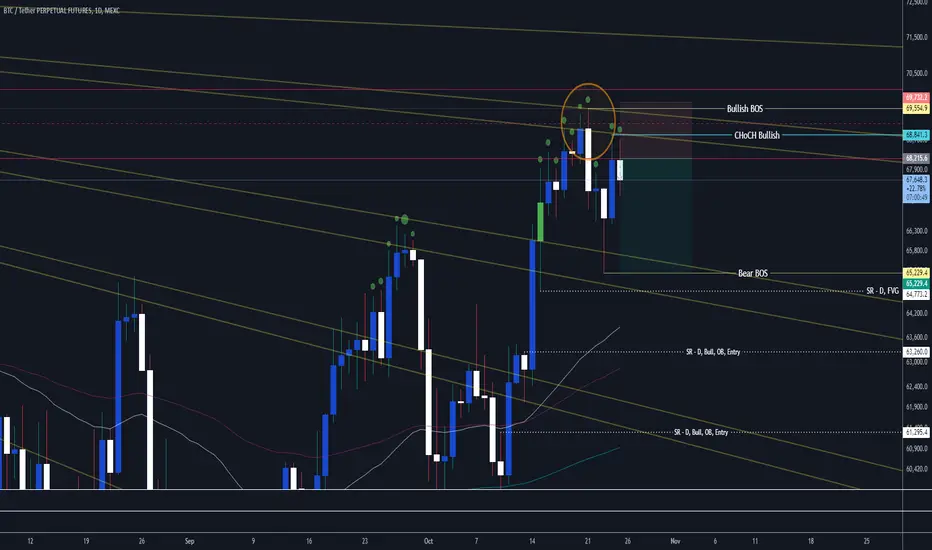
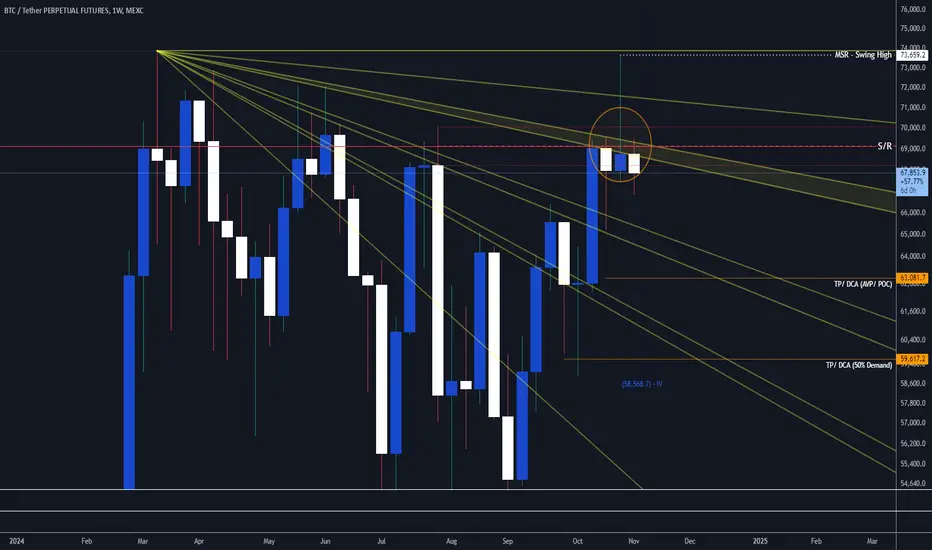
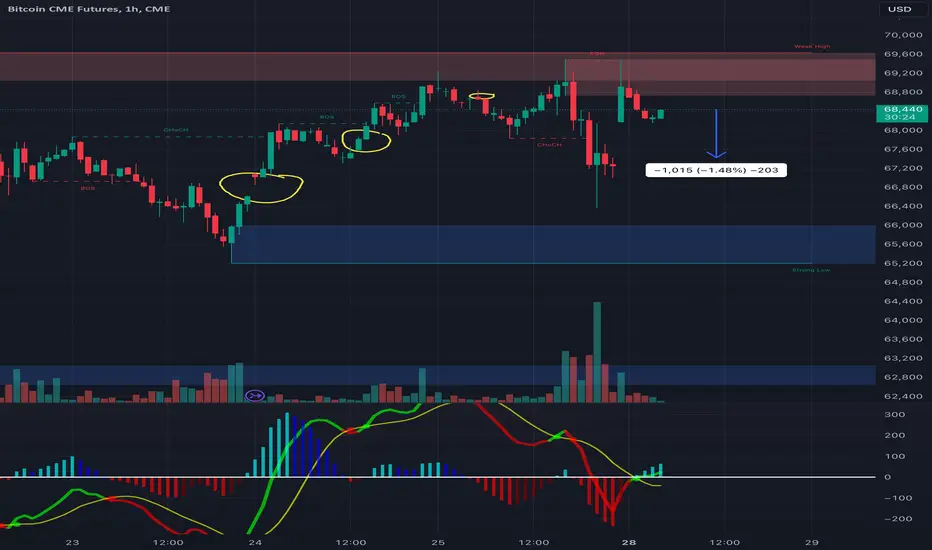
BTC/USDT.P update - Post ElectionThere are two potential scenarios currently. One is that we continue to push into price discovery and the bull run officially starts, or we will have a decent pull back that traps all the easy retail loans at the top before the actual bull starts....
I think both are likely and I'm not here to predict, but I am going to prepare for both situations.
I've marked in yellow circle indicating where the pull back is likely to land if we do see one. If we don't, I am already packed with previous accumulations and I'm happy to ride this bull with some left over sideline capital.
It's never a good idea to spend all your resources at any given time, that is like "show hand", you can play it where you always have left over resource to do something and put yourself in an advantage. It is my opinion of course, but it's been working out great for me so far. Trade safely guys, no matter what, something is about to get down LOL. @Nate Alert

BTC/USDT.P UpdateIf we ignore the election, we had a bearish weekly candle close this past week so I anticipate a sizeable pull back. If we considering election effects, usually the election week is bearish and then an unconditional rally comes soon after; typically it will last till the end of the year. If this pattern holds true, I would personally hedge a trade to profit on both sides. I'm still long term BTC bullish, but this week, I will consider shorting to hedge against my longs. I have marked a few places where I would take TPs on the short and DCA for my longs for you to reference. Trade safely! @Nate Alert
BTCUSDHigh Quality Pullback or Continuation Trade according to SMC defined everything in this chart even 1H demand conformation and entry conformation.
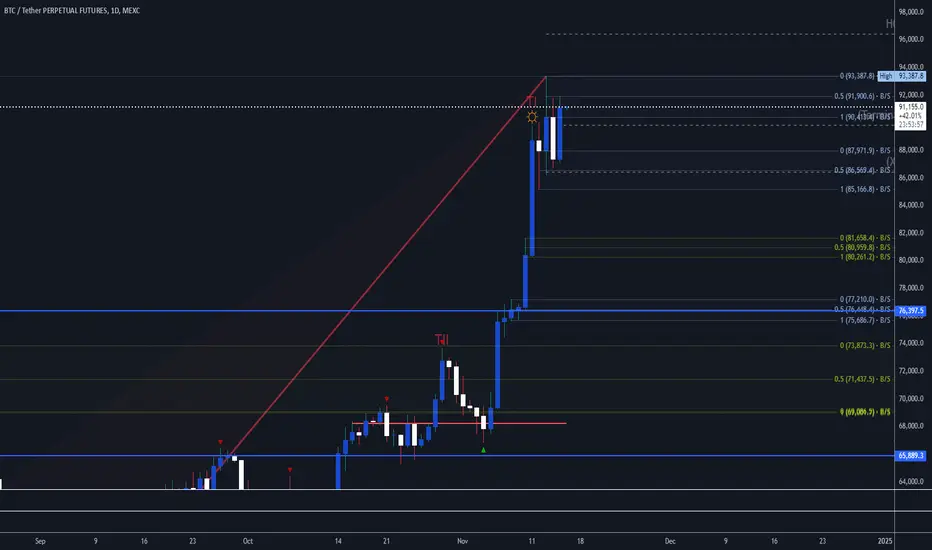
BTC/USDT.P UpdateIf you haven't already, you might want to take advantage of this retrace to start building towards BTC ath breakout that is most likely coming in the near future. Here are some great DCA points you can take advantage of if that is what you would like to do. This is what I'm doing 😄
Trade safely, and remember to play on both sides! @Nate Alert
USTD.D updateThis is USDT.D, a reverse indication to how BTC will perform based on money flow concepts. It looks like USDT.D is starting to form a bullish harmonic pattern and if it does and plays out, BTC will dump. Now only that, the PRZ (potential reversal zone) on the harmonic pattern has weight being based on both yearly VWAP as well as a trend line that is based on Fib levels. Therefore, I am looking for quick short scalps today as I believe a retrace is coming.
Analysis can always be wrong based on these, so no matter what or how much you trust me, trade safely and have back up plans! @Nate Alert

BTC TargetsBitcoin next targets Fibo
We could see Bitcoin reach the targets shown in chart using fibo
Always do your research

BTC/USDT.P UpdateI know you guys are excited about the bull action that finally came after a long wait, but this is where things can get volatile due to manipulation. Remember, if the price action is this obvious all the time, everyone would have been billionaires lol.
Always keep an eye behind you and play on both sides of the market is the best way to go. With that said, we actually did not have a daily candle close "above" the previous major swing high, that is also what I considered as the CHOCH for the bullish trend change. I would be very interested to see if we can give it another attempt today and finally close above that major swing level at 70078. If we close above it on the daily candle, I'll be more bullish, until then, I expect pull backs to grab more liquidity. If it does dump, I'll be ready to accumulate more into my long positions.
Trade safely guys! @Nate Alert
PS** congrats to all the wins from last night's stream, glad to see so many of you making money!

BTC Gap created We may see the Bitcoin gap closed sooner than later, the last 2 were close when the fake news about USDT and Israel-Iran attack happened. We may see some volatile moves this weeks. Crude Oil drop, USA Yields rising as well as the SP500 big companies earnings.
Always do your research
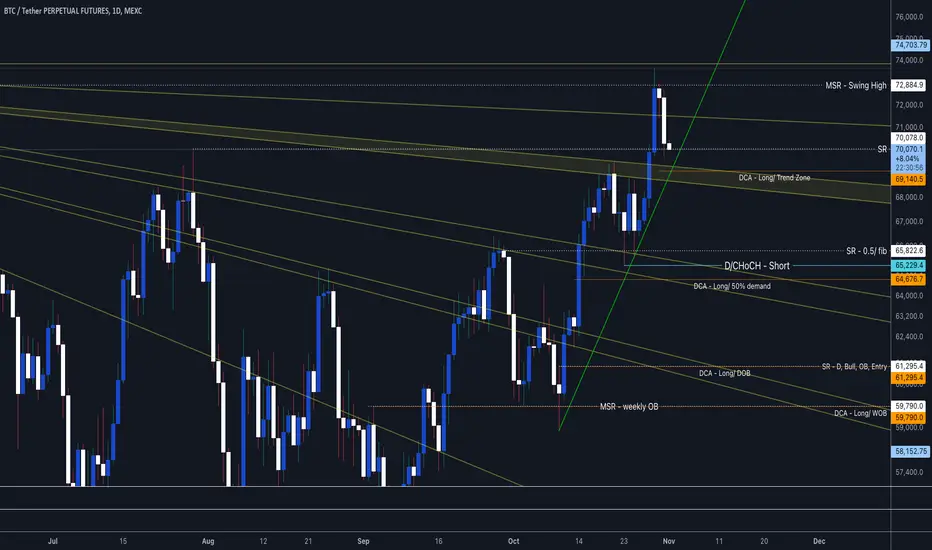
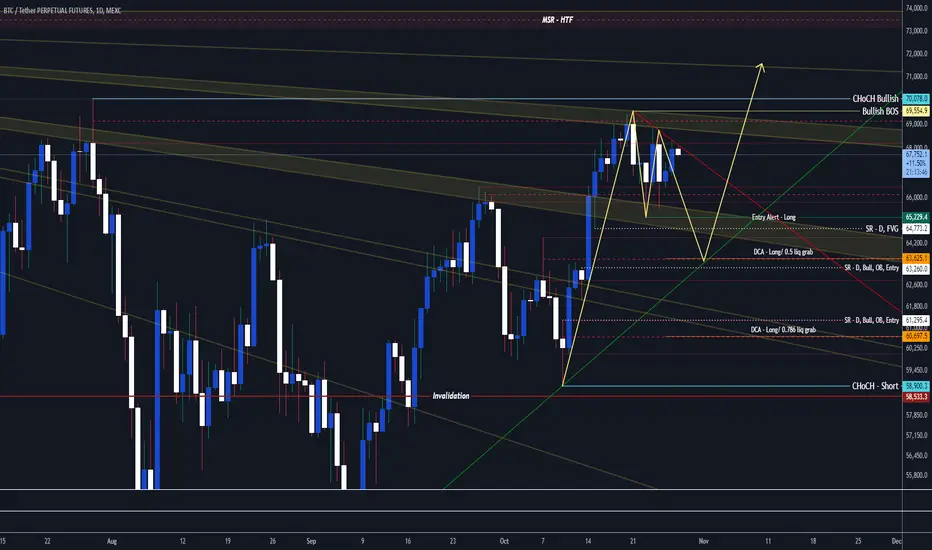
BTC/USDT.P UpdateNew week, new start. Here we are closing the week without any new bullish momentum which makes me suspect we are gonna need to seek out more liquidity before breaking above this trend line level.
I've in this daily tf chart marked potential levels of where it could retrace to. It would be a swing trade or you can see this as potentially building your position before the bull rally starts to finally break that ATH into price discovery.
I still think you need to trade with risk management regardless, because there are a lot of potential event volatilities coming up in the near future. I'll be scalping more in streams and swing in these market updates. Trade safely!
BTC/USDT.P Trade setupSwing Trade:
if today's daily candle closes confirming the lower high, I would be interested to get into a swing short as we are likely retracing further down for a lower low retest some of the previous broke out areas.
However, if in 7 hours and today's candle closes bullish and continues the the trend upwards, then this idea would be invalidated.
I would not get into this trade until the this daily candle closes. It is Friday, and price action can get crazy (as you can see for the past few hours lol), trade safely.