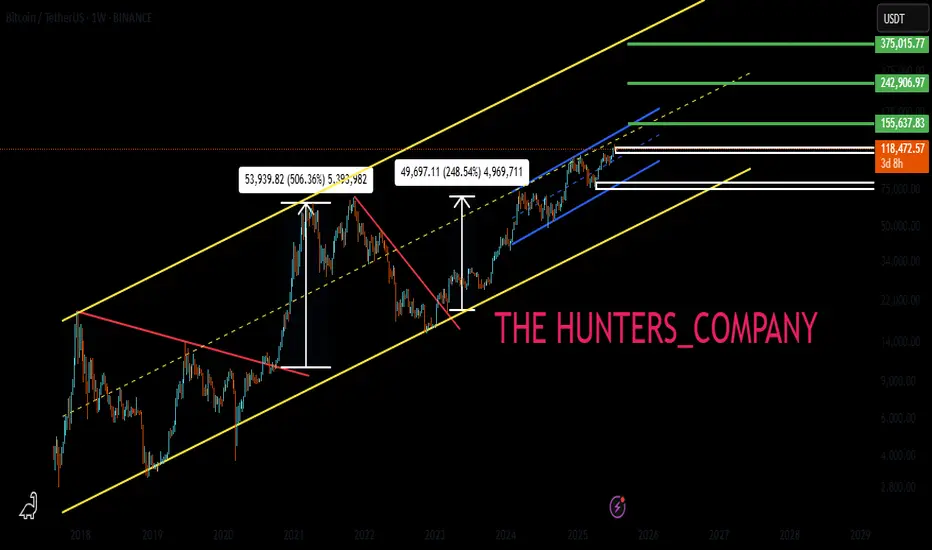
BTC : The future of Bitcoin...Hello friends🙌
👀According to the price history, the price has always been bullish and is in a long-term bullish channel.
📈Now that the price is struggling in the middle of the channel and is gathering strength for a big move, which is expected to break the middle of the channel in the form of a resistance or middle channel, the price will move to the ceiling of the channel.
⚠Don't forget risk and capital management.
🔥Follow us for more signals🔥
*Trade safely with us*
Btctrade
BTC:LIVE TRADEHello friends🙌
📉Given the decline we had, we now had a good price rebound in the specified support area, which shows the power of buyers. Now, with capital and risk management, we can buy at the specified points in a stepwise manner and move to the specified targets.
🔥Follow us for more signals🔥
*Trade safely with us*

Reversal from Channel Bottom or a Real Breakdown? Identifying th
🎯 BTCUSDT - Analysis
🔹 Analysis Date: 1 August 2025
📉BTCUSDT:
Price is currently moving inside an ascending channel and has touched the bottom of the channel again, offering a potential buy opportunity.
However, for those seeking a low-risk entry, the zone around 118,000 could be ideal—if price returns to the channel and confirms support.
Although it seems the channel’s lower boundary might break, this could be a fake break to mislead traders before a rebound.
The support at 110,000 is a crucial short-term level; if it fails, a deeper correction toward 98,090 or even 94,000 is likely.
Our targets remain at the upper boundary of the channel.
⚠️ Risk Management Tip: Wait for confirmation near 118,000 if unsure, and always size positions based on overall volatility.

BTC/USDT Buy Setup – VSA & Demand Zone Reaction✅ Entry: Current price action near 117,297
🎯 Target: 119,078 (+1.22%)
🛑 Stop Loss (SL): 116,944 (below demand zone)
📊 Technical Insight (Volume Spread Analysis):
Stopping Volume at Lows:
The recent down move halted with a wide spread down-bar on high volume, followed by an immediate rejection. This indicates potential professional buying absorbing supply.
No Supply Confirmation:
After the stopping volume, several narrow spread candles on low volume formed, suggesting weak selling pressure and a lack of commitment from bears.
Bullish Reaction:
Price rebounded from the demand zone with increasing volume on up-bars, showing early signs of demand dominance.
The current consolidation just above the support is typical of absorption before a markup phase.
Risk-Reward Structure:
The setup offers a favorable 2.2:1 R:R ratio, with the stop placed just below the zone to avoid false breakouts while allowing the trade room to breathe.
📌 Trade Plan:
Bias remains bullish as long as price holds above 116,944.
A breakout above the minor resistance (117,828) with volume expansion would confirm the next leg up toward the 119,078 target.
If volume fails to support the move, reassess before committing additional capital.

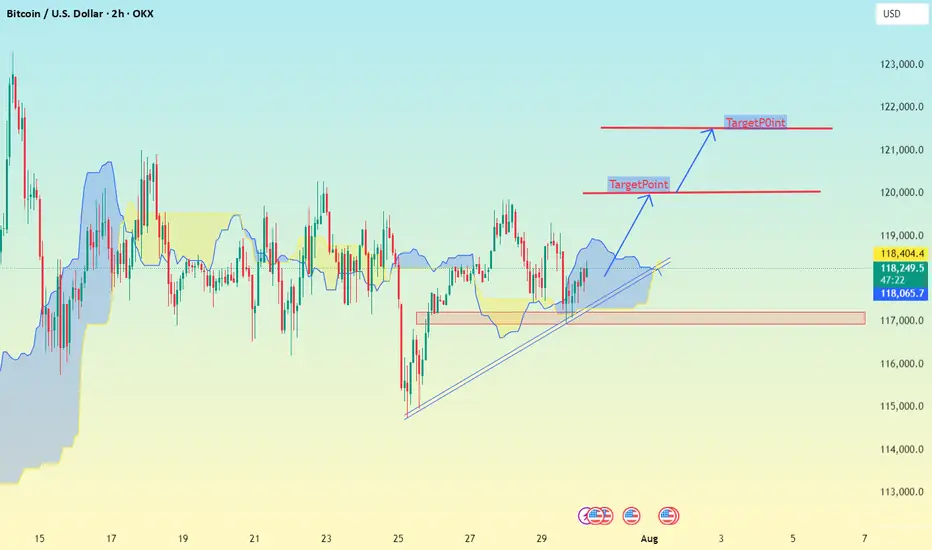
Chart Analysis (2h Timeframe)✅ Chart Analysis (2h Timeframe)
MY using Ichimoku Cloud, support/resistance zones, and trend lines.
Price is currently around 118,319 USD.
It has broken out of the Ichimoku cloud and is respecting the trendline support, indicating bullish momentum.
---
🎯 Upside Target Levels
🔵 Target 1:
Level: ~120,000 USD
Reason: Horizontal resistance (clearly marked)
Action: Minor profit-taking or partial exit
🔵 Target 2 (Main):
Level: ~122,000 USD
Reason: Second resistance zone & projected move from breakout
Action: Ideal full target zone
---
🔻 Support & Invalidations
🟡 Immediate Support Zone:
Levels:
118,404
118,296
118,065
These are dynamic Ichimoku & short-term support levels
BTCUSDT.PThe best area to buy MARKETSCOM:BITCOIN is $119,000 and wait for the pullback to be complete.
But for selling and shorting, be sure to wait for $115,000 to break down.
⚠️Please control risk managements.
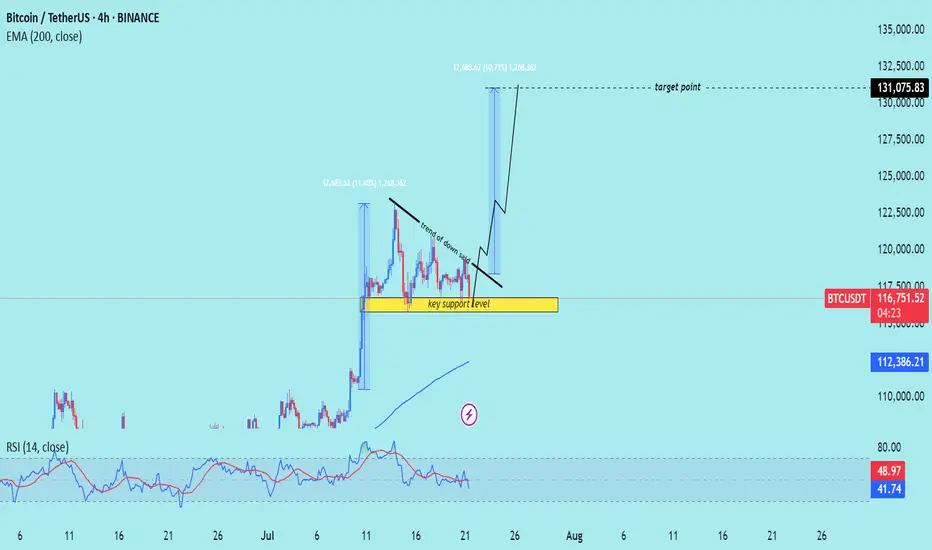
BTC/USD) Bullish Analysis Read The captionSMC Trading point update
Technical analysis of Bitcoin (BTC/USDT) on the 4-hour timeframe, with a focus on smart money concepts like FVG (Fair Value Gap) and support/resistance zones.
---
Technical Breakdown:
1. Price Structure & Path Projection:
BTC is currently in a sideways range, but the drawn projection suggests a potential bullish reversal from the key support zone or the FVG level.
Two bullish paths are suggested:
One bounces from the key support zone (~114,725).
The other dips deeper into the FVG level, sweeping liquidity before heading higher.
2. Key Zones:
Key Support Level: Around 114,700–114,800, aligning with the EMA 200 and prior reaction levels.
FVG Level (Fair Value Gap): Just below the support zone — marked as a potential liquidity sweep area before bullish continuation.
Resistance Zone: 123,069.65, where partial profit could be taken.
Final Target Point: 130,312.02, projecting a strong bullish move from the base.
3. EMA 200 (Blue):
EMA sits around 114,685.97, acting as a strong dynamic support, supporting the bullish scenario.
4. RSI (14):
RSI is neutral at 51.10, providing room for bullish momentum without being overbought.
Mr SMC Trading point
---
Trade Idea Summary:
Bias: Bullish
Entry Zone:
Conservative: Near 114,725.18 (key support + EMA 200)
Aggressive: Deeper at FVG level if price sweeps that zone
Targets:
TP1: 123,069.65 (resistance zone)
TP2: 130,312.02 (main target)
Invalidation: Break and close below FVG zone would negate the setup
---
Please support boost 🚀 this analysis)

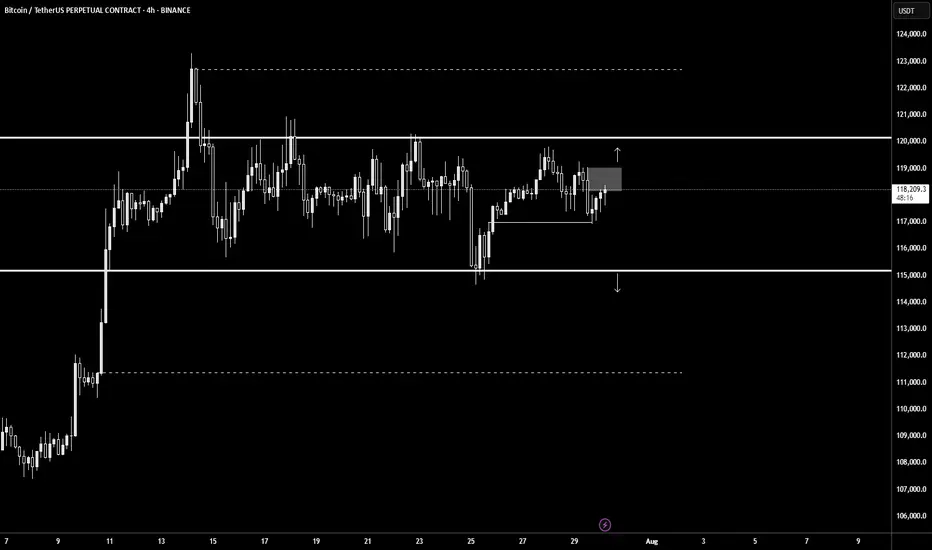
BTC Trade Plan: Watching for Break and Retest Above Daily Range🟠 Bitcoin (BTC) is currently trading range-bound on the daily timeframe ⏳📉📈. I’m monitoring price action for a bullish break and retest 🔓🔁 of the current range to confirm a potential long entry 🎯.
📍 Key levels are already marked on the chart 🗺️—
🛑 Stop-loss would sit just below the previous swing low,
🎯 Target aligns with the higher price zone marked out to the left of the chart 🔼👈.
This is a classic range breakout setup—patience and precision are key.
🧠 As always, this is not financial advice.

BTC- Following the TrendLine since YEARS, ExactlyYear on Year , each cycle BTC is adhering to this trend line, and also hit the 2 FIB EXACTLY for now - rejected there. It must cross this to test higher levels, but that may need a few weeks more of sideways moves. Keep a watch cause another rejection at this trend line will probably indicate we are not going higher.

Navigating BTC Tremors on the Path to a Million Dollar New Bitcoin Paradigm: Navigating Short-Term Tremors on the Deliberate Path to a Million-Dollar Valuation
The Bitcoin market is currently a paradox, a theater of conflicting signals where short-term jitters coexist with audacious, long-term prophecies. On one hand, the price experiences sharp, gut-wrenching drops, with a recent dip to $118,000 attributed to institutional selling, sending waves of anxiety through the retail sector. On the other, the world’s most formidable financial institutions are issuing forecasts that seem to border on the fantastical, with one Wall Street banking giant boldly predicting a $200,000 Bitcoin by the end of December. This schizophrenic market sentiment is the new normal for an asset in the midst of a profound transformation. Bitcoin is no longer the fringe digital curiosity of a decade ago; it is a maturing global asset class being integrated into the very heart of the traditional financial system. This integration brings with it immense capital, but also new complexities and a different rhythm of growth. The story of Bitcoin today is one of navigating immediate volatility, fueled by market maker games and institutional repositioning, while keeping an eye on a future where corporate adoption, macroeconomic shifts, and a new, more deliberate growth pattern could methodically pave the way to a once-unthinkable $1,000,000 valuation.
The current landscape is a confluence of powerful, often opposing, forces. While institutional capital is the primary engine of this bull cycle, it is also a source of calculated selling pressure. At the same time, a steady drumbeat of corporate adoption continues, with companies like the UK-based The Smarter Web Company quietly adding hundreds of Bitcoin to their balance sheets. This is happening against a backdrop of favorable macroeconomic tailwinds, including what some are calling the "biggest trade deal ever" sealed by the United States, an event that subtly reinforces Bitcoin's role as a neutral, global store of value. And just when the narrative seems set, a new player like the mysterious "WeWake" enters the stage with a "big launch" that stuns investors, hinting at a new frontier of consumer-level adoption that could dwarf previous catalysts. This intricate dance between short-term technicals and long-term fundamentals defines Bitcoin's current journey—a journey that is less about the parabolic explosions of the past and more about a calculated, powerful ascent.
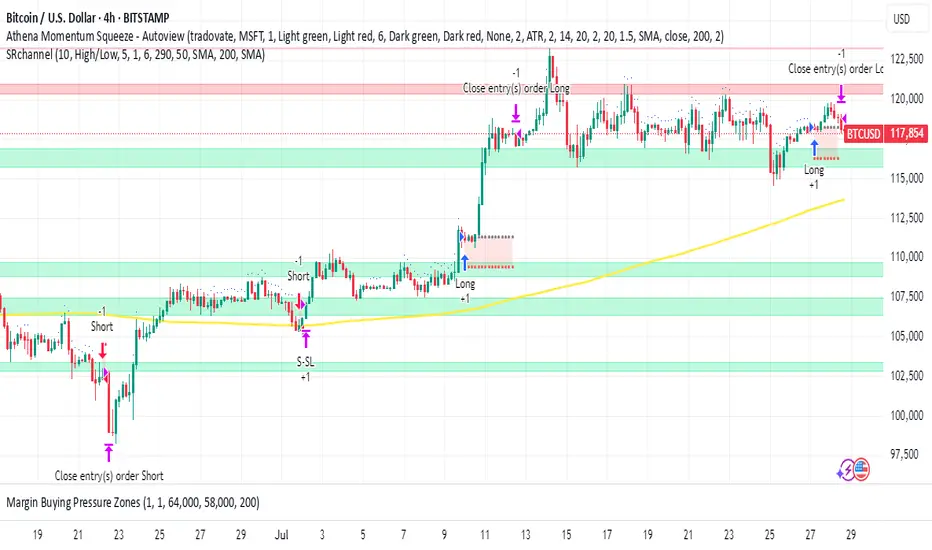
The Immediate Battleground: Volatility, Support, and the $123,000 Squeeze
To understand Bitcoin's path to six figures and beyond, one must first dissect the trench warfare happening at current price levels. The recent plunge to $118,000 served as a stark reminder that the road up is paved with volatility. While alarming, this dip was not seen as a catastrophic failure by seasoned analysts, but rather as a textbook example of institutional mechanics at play. Unlike retail investors who may hold with unwavering conviction, institutional desks are constantly managing risk, rebalancing portfolios, and taking profits to meet quarterly targets. The selling that triggered the drop was likely not a sign of lost faith, but a strategic repositioning, shaking out over-leveraged positions and creating liquidity for larger players to re-enter at more favorable prices.
This is precisely where the concept of the "ideal long zone" comes into play. For bullish traders and institutions, these orchestrated dips are not a crisis but an opportunity. An "ideal long zone" is a price range where multiple technical support indicators converge, creating a high-probability area for a price reversal. This zone might be defined by a combination of a key moving average (like the 50-day or 200-day), a significant Fibonacci retracement level drawn from a previous major low to a high, and a historical price range where the asset has previously found strong buying support. The fact that bulls were able to gain traction in this zone following the $118,000 dip indicates that this calculated selling was met with equally calculated buying. The market is currently engaged in a reversal campaign with an initial, modest target of reclaiming the $121,000 level, a crucial psychological pivot point.
However, a far more explosive scenario is brewing just beneath the surface: the potential for a massive short squeeze. Market makers, the large entities that provide liquidity to exchanges, are reportedly setting a "trap" for traders betting against Bitcoin. A short squeeze is a powerful market phenomenon that occurs when a heavily shorted asset begins to rise in price. The initial price increase forces short sellers to buy back the asset to close their positions and cut their losses. This wave of forced buying creates a feedback loop, driving the price even higher and forcing more short sellers to capitulate. It's a cascade of liquidations that can lead to rapid, vertical price movements.
Analysts believe that market makers are intentionally allowing short positions to build up around the current range, creating a pool of rocket fuel. The target for igniting this fuel appears to be a decisive break above $123,000. If Bitcoin can push past this level, it could trigger a chain reaction of short liquidations, propelling the price upwards with violent speed. This is not organic buying pressure but a technical event driven by market structure.
Looking at the week ahead, two primary scenarios emerge from this tense setup. The bullish scenario involves Bitcoin successfully bouncing from the current support zone, holding its ground, and making a concerted push towards $123,000. A break of this level would likely trigger the short squeeze, leading to a rapid retest of recent highs and potentially pushing into the $125,000-$130,000 range. The bearish scenario, conversely, would see Bitcoin fail to hold this "ideal long zone." A break below the recent lows around $118,000 would invalidate the immediate bullish thesis, suggesting that the institutional selling pressure is more significant than anticipated. This could lead to a deeper correction, potentially testing support levels closer to $100,000-$110,000. The outcome of this short-term battle is critical, as it sets the stage for the remainder of the year and will determine whether the more ambitious price targets remain in play. Adding to the tension, the market is heading into August, a month that analysts have flagged as being filled with potential volatility catalysts, from central bank policy announcements to major options expiry dates, ensuring that the current state of high alert will persist.
The Wall Street Endorsement: The Race to Six Figures by Year-End
While traders battle over short-term levels, Wall Street has its eyes fixed on a much grander prize. The narrative of this bull run has been fundamentally defined by the legitimization of Bitcoin as an institutional asset, and the price targets now emanating from the heart of traditional finance reflect this new reality. In a stunning vote of confidence, a major, unnamed banking giant has put forth a research note predicting that Bitcoin could reach an astonishing $200,000 by December of this year.
This is not a casual prediction from a rogue analyst; it represents a calculated forecast from an institution with immense resources and influence. Such a bold call from a pillar of Wall Street signifies a deep conviction in the asset's trajectory, likely based on proprietary models of capital inflows from ETFs, corporate treasuries, and high-net-worth individuals. It serves as a powerful signal to the rest of the financial world, effectively giving institutional clients the green light to allocate significant capital to Bitcoin. This prediction, along with a growing consensus that Bitcoin is expected to exceed $150,000 by the end of the year, creates a powerful psychological anchor. When institutions of this caliber set such high targets, they can become self-fulfilling, as asset managers and funds feel compelled to gain exposure, lest they miss out on the anticipated rally.
These bullish forecasts are not based on sentiment alone; they are supported by increasingly sophisticated on-chain analysis. One of the most-watched metrics in this cycle is the MVRV (Market Value to Realized Value) ratio. In simple terms, the MVRV ratio compares Bitcoin's current market price to the average price at which all coins in circulation were last moved. When the ratio is high, it suggests the market is overheated and holders are in significant profit, increasing the likelihood of selling. When it's low, it suggests the asset is undervalued.
Analysts have taken this a step further by creating MVRV Pricing Bands. These bands represent standard deviation levels above and below the "realized price," creating a data-driven framework for identifying potential market tops and bottoms. Currently, these pricing bands are hinting at a cycle peak valuation of around $130,000. This provides a more conservative, data-grounded target that aligns with the lower end of the Wall Street predictions. However, this on-chain model comes with a critical caveat: it is only valid if Bitcoin's price holds its current macro support level. This elegantly connects the long-term on-chain outlook with the immediate price battle discussed earlier. A failure to hold the line in the short term could invalidate the assumptions underpinning these models, forcing a recalibration of year-end targets. The path to $130,000, $150,000, or even $200,000 is contingent on winning the present fight.
The New Adoption Paradigm: Corporate Strategy, Macro Shifts, and the "WeWake" Wildcard
The fuel for Wall Street's bullish fire is coming from tangible, real-world adoption. The trend of corporations adding Bitcoin to their balance sheets, pioneered by MicroStrategy, is quietly but powerfully continuing. A recent example is The Smarter Web Company, a UK-based firm that recently announced the addition of 225 BTC to its holdings. While not on the scale of a multi-billion dollar purchase, this move is incredibly significant. It demonstrates that the corporate treasury thesis is expanding beyond a few high-profile early adopters and is becoming a global phenomenon, embraced by small and medium-sized enterprises who view Bitcoin as a superior long-term store of value and a hedge against currency debasement. Each of these purchases, while small individually, collectively contributes to a persistent supply shock, as more coins are moved from the open market into corporate treasuries for long-term holding.
This steady corporate accumulation is occurring against a highly favorable macroeconomic backdrop. News that the United States has successfully sealed what some insiders are calling the "biggest trade deal ever" is being interpreted as a significant long-term tailwind for Bitcoin. Large-scale international trade agreements often involve complex currency fluctuations and settlements. In a world of increasing geopolitical friction and competitive currency devaluations, Bitcoin's properties as a neutral, apolitical, and globally accessible settlement asset become increasingly attractive. Such trade deals can increase global liquidity and put pressure on national currencies, subtly reinforcing the value proposition of a decentralized, non-sovereign store of value.
Just as the market was beginning to digest this new landscape of institutional flows and macro support, a wildcard has entered the fray. A company named "WeWake" has reportedly stunned investors with a "big launch," creating a new, unexpected catalyst. While details remain scarce, the market chatter suggests WeWake is not another financial firm or institutional player, but a major consumer-facing technology company. The speculation centers on a groundbreaking integration of Bitcoin's Lightning Network for micropayments within a massively popular application or service.
If true, this would represent a paradigm shift in adoption. To date, the primary use case driving this cycle has been Bitcoin as "digital gold"—a store of value for institutions and corporations. The WeWake launch hints at the reawakening of Bitcoin's other primary narrative: a peer-to-peer electronic cash system. A successful, large-scale consumer integration would prove that Bitcoin can function not only as a reserve asset but also as a transactional currency for everyday use, opening up an entirely new dimension of demand. The shock and excitement from this launch stem from its potential to onboard millions of new users to the network, not as investors, but as active participants in a new digital economy. This move from passive investment to active utility could be the key to unlocking the next major phase of exponential growth.
The Long Road to a Million: A Mature Asset's "Pump and Consolidate" Journey
With year-end targets of $200,000 now part of the mainstream conversation, the once-fringe prediction of a $1,000,000 Bitcoin is being re-evaluated with newfound seriousness. However, a key analyst has offered a crucial insight that reframes this journey: "The days of parabolic Bitcoin bull runs are over." This statement may sound bearish, but it is, in fact, a sign of Bitcoin's profound maturation as an asset class. The wild, untamed, 100x rallies of the early cycles, driven by retail mania and a lack of liquidity, are being replaced by a more structured and powerful, albeit less explosive, pattern of growth.
The new path to $1,000,000, according to this expert view, will be a "slow and steady" process defined by a "pump and consolidate" pattern. This model envisions a market that behaves less like a volatile penny stock and more like a blue-chip technology giant. The "pumps" will be powerful, rapid upward movements, but they will be driven by specific, fundamental catalysts—the approval of a new wave of ETFs, a landmark corporate adoption by a Fortune 100 company, a major nation-state adding Bitcoin to its reserves, or a successful consumer integration like the one hinted at by WeWake.
Following each of these catalyst-driven pumps, the market will enter a prolonged "consolidate" phase. Instead of a dramatic crash, Bitcoin will establish a new, higher plateau of price discovery. During these consolidation periods, which could last for months, the market will build liquidity, institutional players will accumulate and distribute positions, and the new price level will be normalized and accepted as a baseline. This creates a far more stable foundation for the next leg up. This methodical, stair-step ascent is the hallmark of a mature market with deep, two-sided liquidity provided by institutional players who both buy and sell, preventing the extreme parabolic blow-off tops and subsequent 80-90% crashes of the past.
This "pump and consolidate" model makes the journey to $1,000,000 seem not only more plausible but almost inevitable, assuming the underlying drivers of adoption continue. It is a path built on structural strength rather than pure speculation. Each consolidation phase absorbs selling pressure and builds a stronger floor, making the entire structure more resilient to shocks.
In conclusion, Bitcoin stands at a fascinating and pivotal juncture. It is weathering the short-term storms of institutional profit-taking and the intricate games of market makers, fighting to establish a firm footing above the critical $120,000 level. At the same time, its long-term trajectory is being underwritten by the full faith and credit of Wall Street, with audacious year-end targets of $150,000 to $200,000 now serving as the institutional base case. This optimism is fueled by a relentless wave of corporate adoption and favorable macroeconomic winds, and has been supercharged by surprising new catalysts that hint at a future of mass consumer utility.
The ultimate destination may be the long-fabled million-dollar mark, but the journey will look different this time. The wild, parabolic arcs of youth are giving way to the measured, powerful, and deliberate steps of a mature global asset. The "pump and consolidate" rhythm is the new heartbeat of a market driven by institutional capital and fundamental adoption. While the path will undoubtedly be fraught with volatility, corrections, and periods of agonizing consolidation, the underlying narrative has never been stronger. Bitcoin is navigating the tremors of the present as it builds the foundations for a truly monumental future.
btc on selling#BTCUSD on multiple price rejection at 119k,now we await final touch before a fall below 116487-110k.
Sell at 119436, target 116487-110k, stop loss 120372.
Bullish range isn't strong

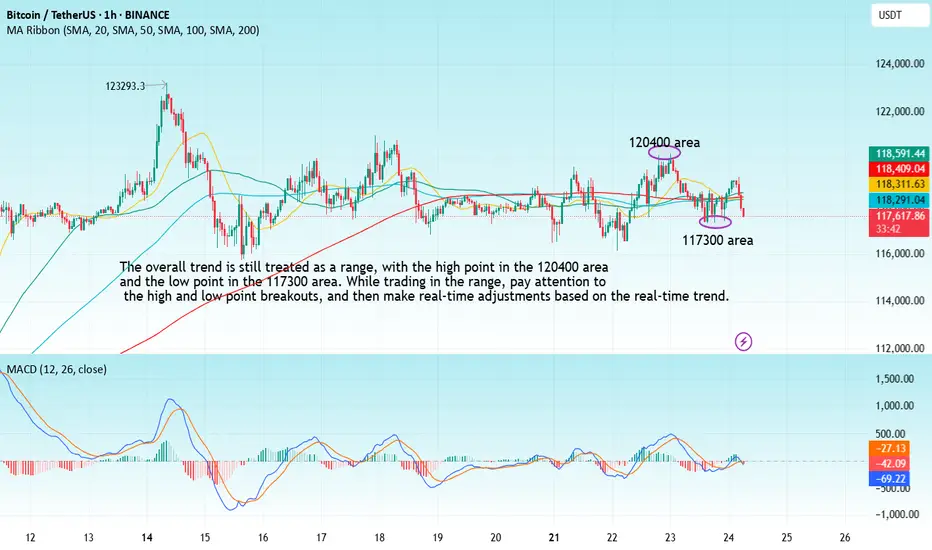
BTC-----Buy around 119000, target 120000-1205000 areaTechnical analysis of BTC contract on July 28:
Today, the daily level of the large cycle closed with a small positive line yesterday, the K-line pattern continued to rise, the price was above the moving average, and the attached indicator was dead cross. The general trend of rising is still very obvious, but from the trend law, it is not a very strong trend at present. The trend of oscillating upward and range is highly likely. In this case, we must find a good rhythm for trading, keep short-term, and don’t be greedy, otherwise it is easy to have profit-taking problems; the short-term cycle hourly chart yesterday’s US market rose and then fell under pressure to correct the low position near the 118700 area. The current K-line pattern is continuous, and the price is at a high level. The attached indicator is golden cross and shrinking. In general, the trend is still strong and the retracement is relatively small. If we look at the continuation of the rise today, it is still the old rule. The retracement cannot be large and cannot break the intraday low.
Today’s BTC short-term contract trading strategy:
Trade in the 119000 area when retreating, stop loss in the 118500 area, target 120000 and break to the 120500 area;

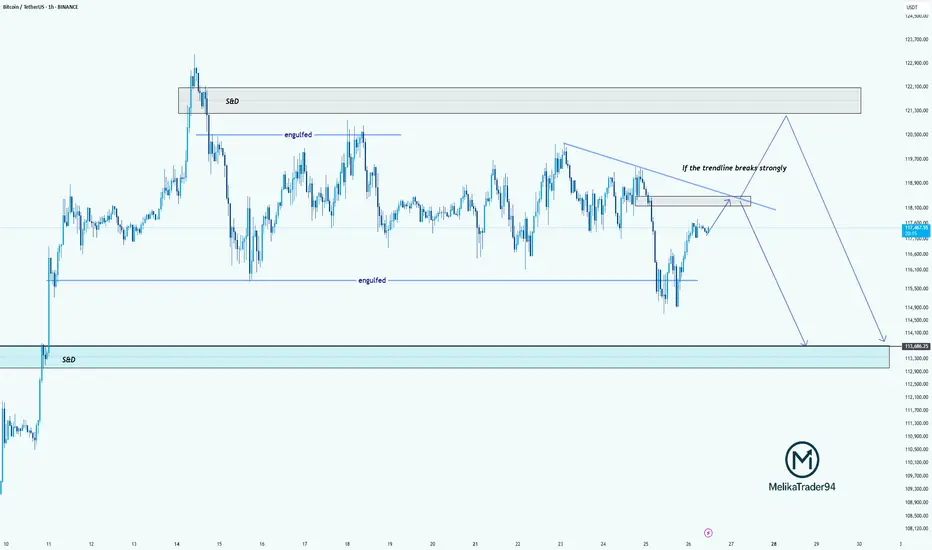
TC Analysis – Watching That Trendline Closely!Hello guys!
Bitcoin is currently approaching a key decision point. As highlighted on the chart, we’ve got a descending trendline acting as strong resistance. If this trendline breaks with strength, we may see price push up into the supply & demand zone around 121,000–122,000 before potentially reversing.
However, if the trendline holds, this current move could be a retest, setting up for another drop. The engulfed level at 114,000 has already been tested once, and if we break below that again, the price could slide down into the S&D demand zone around 113,000–112,000.
summry:
Trendline resistance is critical right now
Watch for a strong breakout or a fakeout & rejection
Possible bearish continuation if we fail to reclaim above 118,500
Let’s see how BTC reacts around this zone.
Why Bitcoin's Bull Run Hits a WallBitcoin's Bull Run Hits a Wall: A Deep Dive into the $115K Correction, Record Leverage, and the Battle for Market Control
A sudden and violent tremor has shaken the cryptocurrency market to its core. After a period of quiet range-bound trading, Bitcoin has decisively moved from consolidation to a sharp correction, plunging below the critical $116,000 support level and briefly touching $115,000. The abrupt downturn triggered a "bloodbath for crypto longs," liquidating hundreds of thousands of traders and wiping out nearly $600 million in leveraged positions. Yet, as the dust settles, a complex and contradictory picture emerges. While institutional sell-offs and cascading liquidations paint a grim short-term picture, record-high open interest, significant liquidity grabs, and bullish on-chain signals suggest the long-term uptrend may be far from over. This article delves into the anatomy of the crash, the forces that fueled it, and the fierce battle between bearish catalysts and bullish undercurrents that will define Bitcoin's next move.
Part 1: The Anatomy of the Correction - From Sideways to Sell-Off
For weeks, Bitcoin's price action was characterized by consolidation, a phase where an asset trades within a defined range, reflecting market indecisiveness. After a strong upward trend that pushed Bitcoin to new highs above $120,000, this period of sideways movement was seen by many as a healthy pause before the next leg up. However, this placid surface masked building pressure. The transition from this consolidation phase to a full-blown correction was swift and brutal.
A market correction is defined as a rapid price change, often a decline of at least 10% but less severe than a crash, that disrupts an asset's prevailing trend. The recent tumble below $116,000 fits this description perfectly. The sell-off was not a gradual slide but a violent dislocation, breaking through established support levels and triggering a wave of panic.
This dramatic shift was exacerbated by several key factors. On-chain data revealed that a significant institutional player, Galaxy Digital, unleashed a massive sell-off, reportedly moving billions in Bitcoin to exchanges. This sudden injection of supply into the market acted as a powerful catalyst, overwhelming buy-side pressure and initiating the downward price spiral. The market's reaction was immediate, with the price slicing through the psychological support at $116,000 and heading towards the next major liquidity zone around $115,000.
Part 2: The Cascade - A $600 Million Bloodbath for Leveraged Traders
The speed of the price drop had a devastating impact on the derivatives market, a space where traders use borrowed funds to amplify their bets on price movements. The sudden downturn resulted in one of the most significant liquidation events in recent memory, with 213,729 traders liquidated for a total of nearly $600 million over a 24-hour period.
What is a Liquidation?
In crypto futures trading, liquidation is the forced closure of a trader's position by an exchange. This happens when a trader can no longer meet the margin requirements for their leveraged position, meaning their collateral is insufficient to cover their mounting losses. For example, a trader using 20x leverage on a $1,000 position controls $20,000 worth of Bitcoin. However, a mere 5% price move against them can wipe out their entire initial capital, triggering a liquidation.
The recent event was a "bloodbath for crypto longs," meaning traders who had bet on the price of Bitcoin increasing were the primary victims. As the price fell, these long positions became unprofitable, and once they crossed their liquidation price, exchanges automatically sold the collateral on the open market to cover the losses.
This process created a deadly feedback loop known as a liquidation cascade. The first wave of forced selling from liquidated longs added more downward pressure on the price. This, in turn, pushed the price down further, triggering the liquidation of another set of long positions whose liquidation prices were slightly lower. This domino effect—where liquidations cause lower prices, which in turn cause more liquidations—is what transforms a standard price dip into a violent market crash. This automated, rapid chain reaction is a hallmark of the highly leveraged and volatile crypto markets.
Part 3: The Fuel for the Fire - Open Interest Reaches a Record $44 Billion
Underpinning this massive liquidation event was an unprecedented buildup of leverage in the market, best measured by a metric called Open Interest (OI). Open Interest represents the total number of active or unsettled futures contracts in the market. It’s a measure of the total capital and number of positions committed to the derivatives market, distinct from trading volume, which counts both opened and closed positions. An increase in OI signifies that new money and new positions are entering the market, often leading to higher volatility.
In a stunning development, as Bitcoin's price began to plunge, the total Open Interest surged to a new all-time high of $44 billion. This unusual divergence—where price falls while open interest rises—suggested that a significant number of new short positions were being opened to bet against the market, while many longs remained trapped, hoping for a reversal. This created a powder keg of leverage.
Further fueling this was a notable surge on the world's largest crypto exchange. On-chain data showed that traders added 10,000 Bitcoin worth of open interest to the BTCUSDT perpetual contract on Binance alone. This single-day surge in open interest on a key trading pair signaled a massive influx of speculative capital.
High open interest acts as fuel for volatility. With so many leveraged contracts open, any sharp price movement can trigger the kind of cascading liquidations that were just witnessed. The record-breaking $44 billion in open positions meant the market was more susceptible than ever to a violent deleveraging event.
Part 4: The Big Players - A Tale of Two Whales
The recent market turmoil cannot be fully understood without examining the actions of its largest participants: the whales and institutions. Their movements often create the initial waves that retail traders are forced to navigate.
On the bearish side, the primary catalyst for the sell-off appears to be Galaxy Digital. The digital asset financial services firm was observed moving tens of thousands of Bitcoin, worth billions of dollars, to centralized exchanges. These flows were reportedly part of a larger liquidation of holdings from a dormant "Satoshi-era" whale, with Galaxy acting as the intermediary to facilitate the sale. By strategically offloading such a massive amount, even if through over-the-counter (OTC) desks to minimize initial impact, the sheer volume of sell pressure eventually spilled into the public markets, triggering the correction. The firm's subsequent withdrawal of over a billion dollars in stablecoins from exchanges further suggests a large-scale profit-taking or strategic de-risking maneuver.
However, this institutional selling pressure is contrasted by a powerful bullish undercurrent. Even as the market reeled, other large players were making bold, long-term bets. Reports surfaced of a significant whale bet on Bitcoin reaching a staggering $200,000 by the end of the year. This dichotomy highlights the deep division in market sentiment. While some large entities are taking profits or repositioning, others view this correction as a prime accumulation opportunity, demonstrating unwavering conviction in Bitcoin's long-term trajectory.
This clash of titans—the institutional seller and the long-term bullish whale—defines the current market structure. The price is caught in a tug-of-war between immediate, heavy supply and deep-pocketed, long-term demand.
Part 5: Reading the Tea Leaves - A Healthy Reset or the Start of a Bear Market?
While the headlines scream "bloodbath" and "crash," a deeper analysis of market mechanics and on-chain data offers a more nuanced perspective. Several key indicators suggest that this brutal pullback, while painful, may be a healthy reset rather than the beginning of a sustained bear market.
Argument 1: The Pullback Remains Within Normal Volatility Range
Bitcoin is notoriously volatile, and sharp corrections are a historical feature of its bull markets. Drawdowns of 30-40% have been common pit stops during previous bull runs. While a drop from over $120,000 to $115,000 is significant, analysts point out that such moves are not out of character for the asset. Historically, major cycle-ending bear markets have seen drawdowns exceeding 75-80%. In contrast, mid-cycle corrections serve to wipe out excess leverage, shake out weak hands, and build a more sustainable foundation for future growth. This event, though severe for leveraged traders, may fall into the category of a standard, albeit sharp, bull market correction.
Argument 2: A Necessary Liquidity Grab
Sophisticated market analysis suggests the plunge below $115,000 was a textbook liquidity grab. This is a maneuver, often initiated by large players or "smart money," where the price is intentionally pushed to a level where a high concentration of stop-loss and liquidation orders are known to exist. By triggering these sell orders, large buyers can absorb the resulting liquidity to fill their own large positions at more favorable prices before reversing the market direction. The area just below a key psychological level like $115,000 is a prime location for such a maneuver. The rapid dip followed by a stabilization could indicate that this was not a panic-driven crash, but a calculated move to hunt liquidity before the next leg up.
Argument 3: Bullish Signals from Spot Markets and On-Chain Data
While the derivatives market was in turmoil, other indicators flashed bullish signals. One analyst pointed to a strong correlation between surges in Binance's spot trading volume and subsequent price upswings. Recently, Binance's share of the spot market volume surged significantly, a move that has historically preceded rallies. High spot volume indicates genuine buying and selling activity, as opposed to the paper bets of the futures market, and can signal strong underlying demand.
Furthermore, key on-chain metrics suggest the long-term bullish scenario remains intact. Analysts highlighted that Bitcoin's price found support near the "Realized Price" for short-term holders, indicating that recent buyers were not panic-selling in large numbers. Other metrics, such as those showing that major long-term holders are retaining their assets despite record prices, paint a picture of underlying market strength that contrasts with the short-term speculative chaos.
Conclusion: A Market at a Crossroads
The dramatic plunge to $115,000 was a multifaceted event, a perfect storm of institutional profit-taking, extreme leverage, and the brutal mechanics of the crypto derivatives market. For the over-leveraged trader, it was a catastrophe. For the long-term investor, it may have been a fleeting opportunity.
The market now stands at a critical juncture, defined by conflicting forces. On one hand, the specter of institutional selling, exemplified by the Galaxy Digital offload, looms large. The record-high open interest, though slightly diminished after the liquidations, still represents a significant amount of leverage that could fuel further volatility.
On the other hand, the arguments for a bullish continuation are compelling. The idea that the crash was a calculated liquidity grab, the historical precedent for sharp bull market corrections, the strength in spot market volumes, and the conviction of long-term holders all suggest that the core uptrend is resilient. The whale betting on a $200,000 price by year-end serves as a potent symbol of this underlying confidence.
The coming weeks will be crucial in determining which of these forces will prevail. The battle between the short-term pressures of deleveraging and the long-term thesis of accumulation will be fought in the charts and on the blockchain. While the bloodbath for longs served as a stark reminder of the perils of leverage, it may have also been the violent, necessary purge required to cleanse the market and pave the way for a more sustainable ascent.
BTC-----Buy around 117600, target 118000-119000 areaTechnical analysis of BTC contract on July 24:
Today, the large-cycle daily level closed with a small negative line yesterday, the K-line pattern was single negative and single positive, the price was at a high level, and the attached indicator was dead cross running, but note that the overall trend has entered the range of fluctuations, and there is no continuation of price increases and decreases. In this case, we should pay attention to the rhythm of washing the plate, which is a very common trend rule, and it is also the trend that many trading friends are most likely to lose money. If you can't find the rhythm and are not calm enough, then the result is back and forth stop loss; the short-cycle hourly chart fell yesterday without breaking the low US market and the price consolidated in the early morning. The Asian morning rose continuously. The current attached indicator is golden cross running, and the price is above the moving average, so today's trend is still rising during the day and then retreating under pressure. It is likely to remain in the range of fluctuations, with a high point near the 121000 area and a low point of 115700 area.
Today's BTC short-term contract trading strategy:
More in the 117600 area, stop loss in the 117000 area, target 118000-119000 area;
Accumulate BTC over 115K💎 BTC PLAN UPDATE (July 23rd)
NOTABLE NEWS ABOUT BTC
Bitcoin (BTC) and Ripple (XRP) are approaching their all-time highs, while Ethereum (ETH) continues to grow steadily toward the important $4,000 mark. These top three cryptocurrencies by market capitalization are showing signs of a new bullish momentum, supported by strong technical structures and increasing investor interest.
TECHNICAL ANALYSIS PERSPECTIVE
1. Main Trend
The overall trend remains bullish, with a clearly rising price channel (black diagonal line).
However, BTC is currently in a short-term correction phase, consolidating sideways after the recent strong surge.
2. Key Price Levels
🔵 Strong Support Zone: 116,000 – 117,000 USDT
This zone includes the 200-day moving average (MA200), horizontal support, and a previous bottom — making it a decisive area for the short-term trend.
If this zone breaks, BTC could fall to a deeper support area around 111,000 USDT.
🔴 Resistance Zone: 122,000 – 123,000 USDT
This is a previous peak and a recently “false breakout” area — a strong psychological resistance.
If broken convincingly, BTC could surge to the 130,000 USDT zone (Fibonacci extension 1.618).
3. Possible Scenarios
✅ Bullish Scenario:
Price retests the 116,000 – 117,000 support zone and then bounces.
If it breaks through the 122K resistance, the next target is 130,000 USDT.
❌ Bearish Scenario:
If price breaks below MA200 and the 116K support zone → it could drop to the deeper zone around 111,000 USDT.
4. Technical Signals
There is a triangle accumulation pattern (with flat tops and bottoms).
The “false breakout” at the resistance zone shows that buyers are not yet strong enough and a retest of support is needed.
Follow the channel for the latest and continuous updates on XAUUSD, CURRENCIES, and BTC.
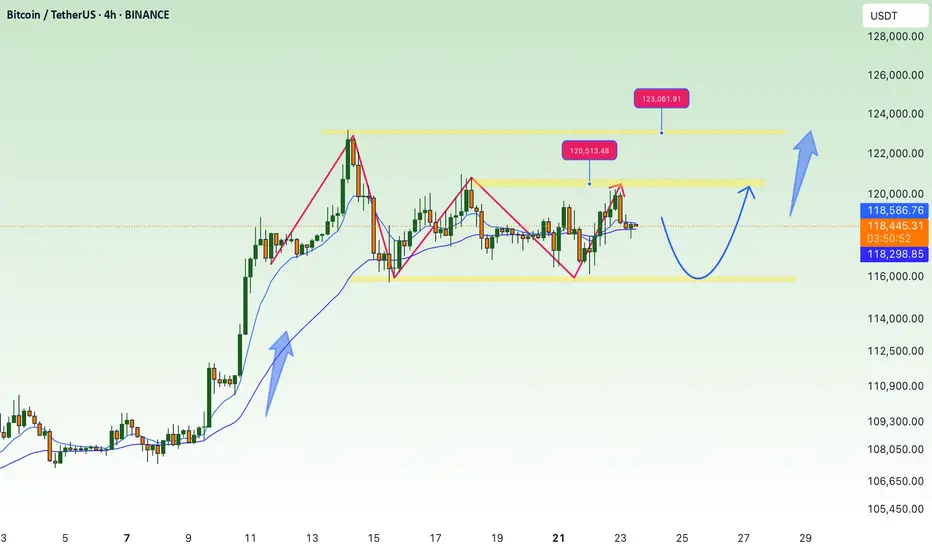
BTC/USD) Bullish trend analysis Read The captionSMC Trading point update
Technical analysis of Bitcoin (BTC/USDT) on the 4-hour timeframe, indicating a potential upward continuation after a period of consolidation above a key support level.
---
Analysis Summary
Pair: BTC/USDT
Timeframe: 4H
Current Price: 116,810.90
Bias: Bullish breakout continuation
---
Key Technical Insights
1. Key Support Zone:
The yellow box marks a strong support level, where price has bounced multiple times.
Acts as a launchpad for the next move higher.
2. Descending Trendline:
A trend of lower highs suggests short-term selling pressure.
Break above this trendline would signal a bullish breakout.
3. Projected Move:
If the breakout occurs, the projected target is around 131,075.83, representing a ~12% gain.
Similar move structure as the previous breakout earlier this month.
4. EMA 200 (Supportive):
Price remains above the 200 EMA at 112,386.80, affirming bullish trend bias.
5. RSI (14):
RSI hovering around 42–49, slightly oversold area, suggesting upside potential remains.
---
Target Point
Target: 131,075.83 USDT
Stop-Loss Suggestion: Below key support zone (~114,000)
---
Trade Idea
Direction Entry Stop-Loss Target
Buy Break above 118,000 Below 114,000 131,000–132,000
Mr SMC Trading point
---
Summary
Bitcoin is consolidating above a strong support zone and under a descending trendline. A confirmed breakout from this pattern could lead to a bullish rally toward 131,000+.
-
Please support boost 🚀 this analysis)
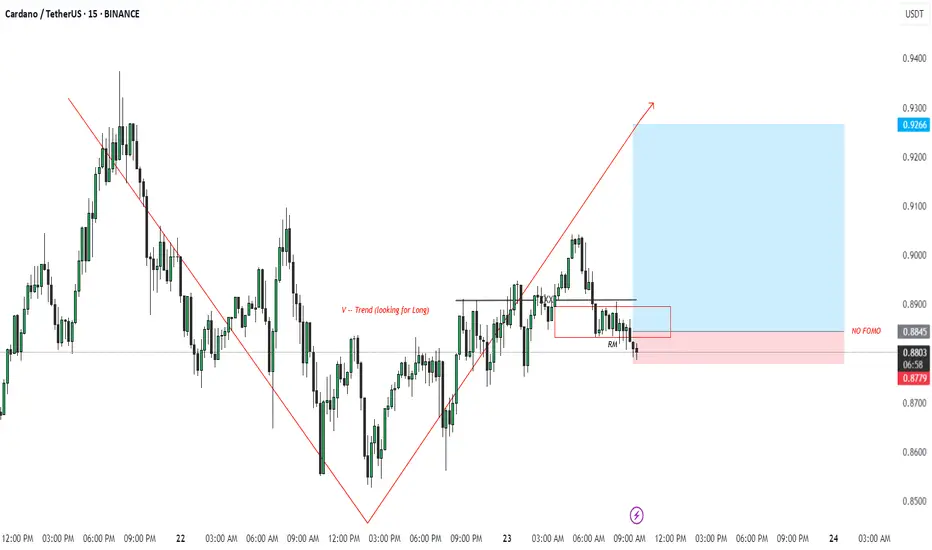
ADA/USDT Trade Idea – 15m (Following V–Trend Setup)Bias: LONG
🔍 Trade Breakdown:
V-Structure Identified:
Market formed a clear V-reversal structure, shifting from a bearish downtrend into a bullish uptrend. This is a key part of my setup — I look for these V-shaped reversals as confirmation of potential long entries.
Trendline Break + Structure Shift:
The red descending trendline was broken with strong bullish candles. Price also broke above a key structure level, confirming the bullish trend shift.
Risk Management Zone (RM):
Price pulled back into my Risk Management Zone (RM) — a demand zone marked by previous consolidation and imbalance. I do not enter on impulse, instead I wait for price to return to this zone for a safer entry.
NO FOMO Zone:
Highlighted in red — I avoid entering if price doesn't respect this zone. It helps me stay disciplined and avoid emotional trades.
Entry & Target:
Entry: Within RM zone (~0.8780–0.8845)
Stop Loss: Below RM zone (~0.8739)
Target: 0.9266
This gives a solid risk-to-reward setup in alignment with the trend.
✅ Strategy Checklist:
V-shaped recovery ✅
Structure break ✅
Pullback into RM ✅
No FOMO entry ✅
RR > 1:3 ✅
📌 Let the market come to you. Stay disciplined, trust the setup.
#ADAUSDT #CryptoTrading #VTrend #SmartMoney #PriceAction #NoFOMO #15mSetup #TradingView
BTCUSD (Bitcoin) Buy Setup – VSA & Market Structure Analysis✅ Entry: As marked on chart
🎯 Take Profit 1 (TP1): Highlighted zone on chart
🎯 Take Profit 2 (TP2): Highlighted zone on chart
🛑 Stop Loss (SL): Defined below recent demand zone
📊 Technical Insight (VSA & Market Structure):
The recent decline into the support zone occurred on diminishing volume, indicating a lack of selling pressure.
A climactic volume spike (stopping volume) followed by a wide spread bullish candle suggests strong professional buying activity.
Subsequent bars show narrow range candles with low volume, characteristic of an absorption phase, hinting at smart money accumulation.
Price is now attempting to break above the previous minor resistance, which would confirm demand overcoming supply.
The broader market structure aligns with this setup: Bitcoin is in a higher timeframe accumulation range, and this move could initiate a markup phase as per Wyckoff/VSA principles.
📍 As long as price holds above the stop loss zone, we expect a bullish leg towards TP1 and TP2, in line with the emerging demand dominance.

Bitcoin May Pull Back Slightly Before Resuming Uptrend📊 Market Overview
• Bitcoin is currently trading around $116,934, slightly down after hitting an intraday high of $119,524.
• The earlier rally was supported by inflows into Bitcoin ETFs, accumulation by major holders like Trump Media and MicroStrategy, and a pro-crypto regulatory stance in the U.S. (e.g., Genius Act, CLARITY Act).
• However, a surge in whale transfers to exchanges and declining BTC dominance suggests profit-taking and potential short-term volatility.
📉 Technical Analysis
• Key Resistance: ~$119,500 – $120,000 (intraday high and recent ATH)
• Nearest Support: ~$115,000 – $116,000, then $110,000
• EMA 09/20: Price is hovering around EMA 9/20 on H1–H4 timeframes, indicating a short-term uptrend but needing a pause or correction.
• Momentum / Volume: RSI is near overbought territory; falling volume hints at consolidation or a mild pullback. The overall trend remains bullish but slightly unstable.
📌 Opinion
Bitcoin is likely to pull back slightly in the short term toward the $115,000 – $116,000 zone due to profit-taking pressure, before potentially resuming the uptrend if it can break and hold above $119,500 – $120,000 with strong volume.
💡 Trade Setup
SELL BTC/USD at: $118,500 – $119,000
🎯 TP: $116,500
❌ SL: $120,000
BUY BTC/USD at: $115,000 – $116,000
🎯 TP: $118,500 – $119,500
❌ SL: $114,000

BTC-----Sell around 118100, target 116500 areaTechnical analysis of BTC contract on July 22:
Today, the large-cycle daily level closed with a small positive cross yesterday, and the price was below the moving average. The attached indicator was dead cross. The general trend is currently biased towards a downward trend. From the overall trend, we can see that the current trend is consistent and strong, but there is no room for rebound, and the continuous sluggish trend is also quite obvious, so the idea of selling down in the future market has become the main idea; the short-cycle hourly chart showed that the US market fell and rebounded yesterday, and the pressure continued to fall and broke down in the morning, and the correction high was near the 118000 area. The current K-line pattern is a single positive line. According to the trend rule, if the decline continues today, the rebound strength cannot be large, and the high point of the US market correction is resistance.
Today's BTC short-term contract trading strategy:
Sell at the current price of 118100, stop loss at 118500, and target 116500;

BTC-----Sell around 118300, target 116000 areaTechnical analysis of BTC contract on July 21:
Today, the large-cycle daily level closed with a small negative line yesterday, the K-line pattern continued to fall, the price was below the moving average, and the fast and slow lines of the attached indicator showed signs of a dead cross, and the overall trend has been in a sluggish state recently. The trend in the big trend also showed obvious signs of falling, so we have to pay attention to the strength and continuation of the retracement next; the short-cycle hourly chart price fell under pressure in the early morning, and the current K-line pattern continued to fall, the price was below the moving average, and the attached indicator was dead cross, so the price fell to the previous low of 115700 area. So you can sell after the pullback during the day, and pay attention to the breakout and strength and weakness trend of the European session.
Today's BTC short-term contract trading strategy:
Sell in the 118300 area, stop loss in the 118600 area, and target the 116000 area;
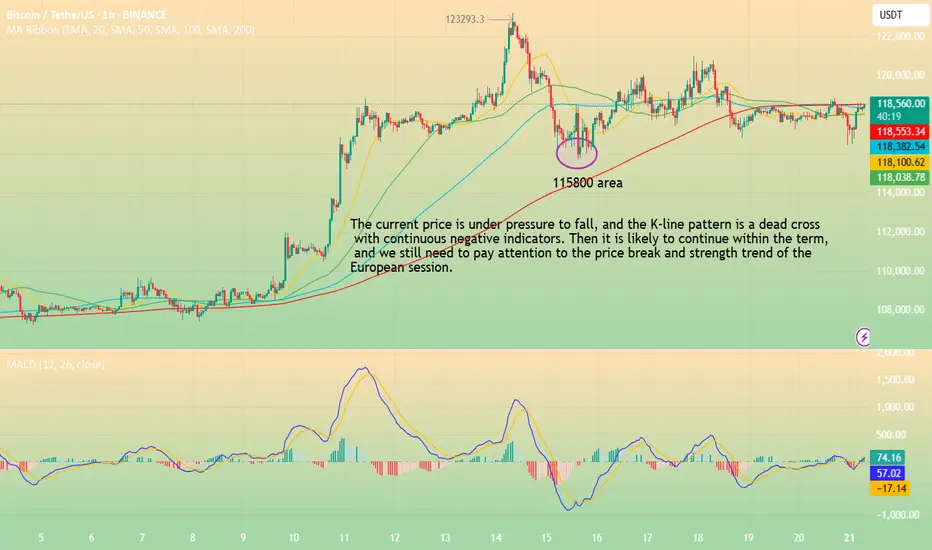
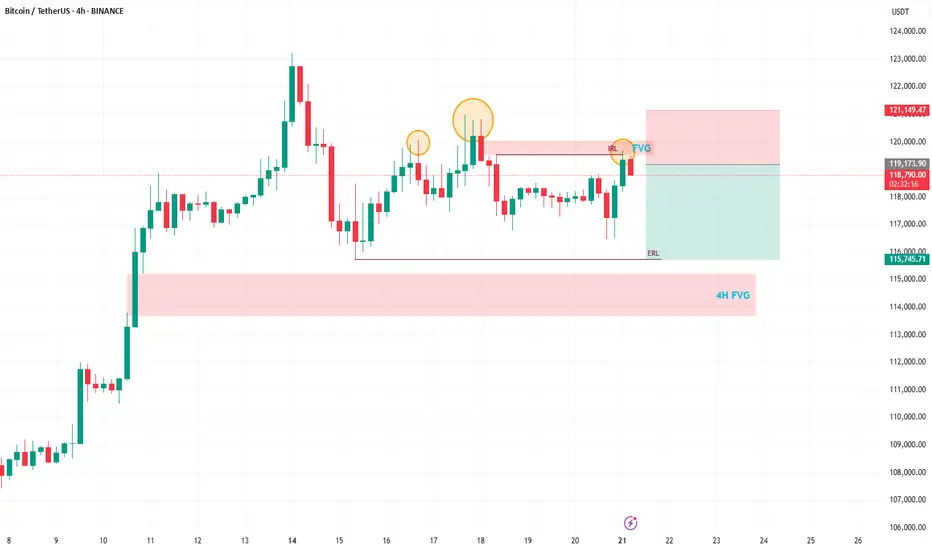
Bitcoin Trading Update: Consolidation, Patterns, and What's NextHey Fellow Traders! 👋
Bitcoin (BTC) has been on a wild ride after hitting its all-time high (ATH)! 📈 Since then, it’s been consolidating, generating liquidity, and setting the stage for the next big move. Meanwhile, altcoins are absolutely booming, stealing the spotlight! 💥 As we kick off the week, let’s dive into what’s happening with BTC and what to watch for.
📊 Technical Analysis Breakdown
Here’s what I’m seeing on the charts:
Head and Shoulders Pattern: A clear head and shoulders has formed on BTC, signaling a potential bearish move. 🐻
Daily Timeframe Order Blocks: These are in play, showing key levels of support and resistance.
Filled Fair Value Gap (FVG): A recent FVG on the daily chart has been filled, but there’s still a beautiful 4H FVG waiting to be tested below.
Liquidity Sweep: After the ATH, BTC needs to clear the liquidity from the past few days before it can push for new highs.
🔍 What’s Next for BTC?
I’m expecting a bearish reaction in the near term, with BTC targeting the sell-side liquidity around $115,800. This move should also fill the 4H FVG, setting the stage for a potential bounce and another shot at the ATH. 🚪 Keep an eye on these levels, as they’ll be critical for the next big move!
🔔 Stay in the Loop!
Let’s keep the conversation going! 💬 Follow for more updates, like if you found this helpful, and drop a comment with your thoughts or what you’re seeing in the markets. Are you trading BTC or riding the altcoin wave? Let’s hear it! 👇
Happy trading, and let’s make this week count! 💪
#Crypto #Bitcoin #Trading #TechnicalAnalysis