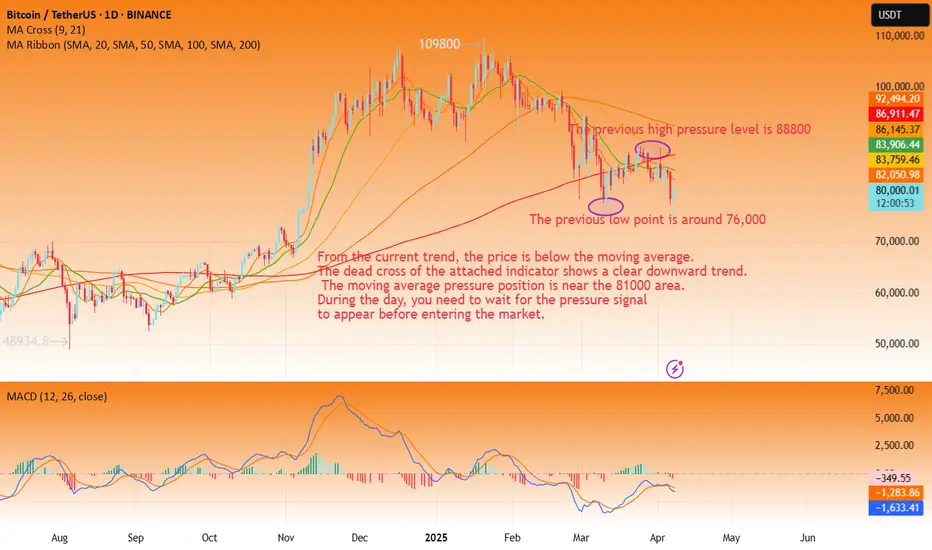
BTC-----Sell around 81600, target 80500 areaTechnical analysis of BTC contract on April 11:
Today, the large-cycle daily level closed with a small negative line yesterday, and the K-line pattern was a single negative and a single positive. The price was at a low level, and the attached indicator was dead cross. However, the price fluctuation seemed large, but in fact there was no amplitude. Yesterday, the price fell, and the support rebounded in the early morning, basically smoothing out the decline. In this way, the current trend is still in correction, but it does not mean that you can take risks to go long. I think shorting at high levels is still the best choice; the short-cycle hourly chart showed that the decline in the European session continued in the US session yesterday, but it did not continue in the early morning but was a correction of the trend. The current K-line pattern is continuous positive, and the attached indicator is running in a golden cross. Yesterday, the high point of the opening of the decline was near the 82,500 area. Today, we still rely on this position for defense.
Today's BTC short-term contract trading strategy: sell at the rebound of the 81,600 area, stop loss at the 82,100 area, and target the 80,500 area;
Btctrade
Bitcoin Trade Setup: Bullish Breakout Targeting $87K!🔹 Key Levels Identified:
📌 Target Point: 87,008.21 USD 🏁🔵
👉 Expected price move (+9.07%) 🚀
📌 Entry Point: 79,719.00 USD ✅
👉 Suggested buying level in demand zone 🏦
📌 Stop Loss: 78,213.25 USD ❌🔻
👉 Risk management level 📉
📊 Technical Analysis:
📈 Trendline Support:
🔵 The price bounced off the trendline 📊, confirming an uptrend 📈
🔵 Demand Zone:
🟦 Marked blue area = Buyer interest 📊
💰 Expected reversal zone if price retests
📊 Moving Average (DEMA 9):
🔸 82,343.85 USD (current level)
🔺 Price slightly below DEMA ➝ possible bullish reversal 🚀
⚡ Trade Setup:
✔️ Risk-to-Reward Ratio:
🟢 Potential profit: +7,220.76 USD
🔴 Risk: -1,500 USD
📊 Favorable trade setup with high reward vs low risk ✅
✔️ Momentum Confirmation:
🟢 Above 79,719 USD = 🚀 Bullish breakout
🔴 Below 78,213.25 USD = ❌ Stop Loss triggered
🔮 Conclusion:
🔥 Bullish setup if price holds demand zone!
🚀 Target: 87,008 USD
⚠️ Manage risk with stop loss! 📉
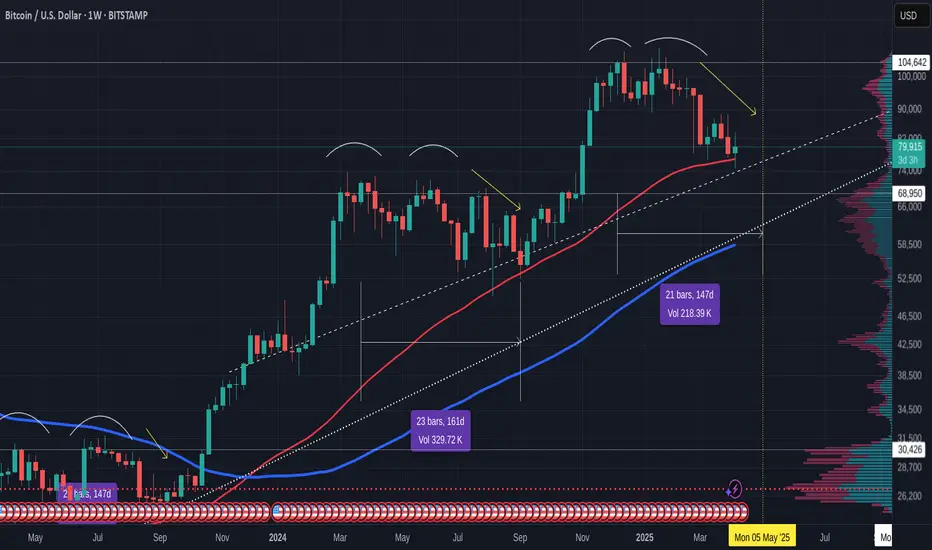
BITCOIN weekly and 50 SMA - has VERY good newsAs you can easily See, despite all the unsettled News and events in recent days, the current Week candle has returned to GREEN having hit that 50 SMA.
To remind you, we began the week with a RED candle BELOW that 50 SMA.
This is Very important for sentiment. We bounced off that 50 back in 2024 and went to ATH.
To remind you, we have hit the 50 at the same time as the weekly MACD has entered a Bounce Zone, very near Neutral.
The MACD chart above shows you that the Histogram bar has also returned to White, showing a possible turn of favour from Bearish to Bullish.
BITCOIN IS SO READY TO GO
We just need the investors that are pouring money into the Snail called GOLD, to realise the Future is BITCOIN
We wait
BTCUSDT | Waiting for Precision – Not Just Price LevelsMany were tempted to short BTCUSDT around the $83,000 region, and I was closely watching it too. However, as always, I don’t take trades based solely on price levels. What separates professional trading from guesswork is the data behind the scenes, and in this case, CDV (Cumulative Delta Volume) did not show any bearish divergence. That’s why I completely passed on this level without hesitation.
🎯 What’s Next?
Upper Blue Box is My Focus: I’ve now shifted my attention to the next key upper blue box, where I’ll be looking for serious short opportunities, but only if LTF confirmations such as orderflow shifts, CDV divergences, or volume traps appear.
Why I Wait: Just because a price hits a “zone” doesn’t mean we react. Professional traders wait for confluence, confirmation, and controlled risk.
🔒 Smart Trader Checklist:
No CDV divergence = No trade.
Wait for price to enter the upper blue box and react.
Short only with proper lower time frame confirmation.
If price breaks above with strong momentum and retest, I will not insist on shorts. I will shift and look for longs.
💡 I trade with precision and patience—not emotion. These levels are not random lines, but key zones mapped with advanced tools and strict discipline. That’s why my followers consistently win, and why my success rate is among the highest you’ll find here.
If you want to trade with clarity, confidence, and data-backed precision, just keep following me. You’ll see the difference.
📌I keep my charts clean and simple because I believe clarity leads to better decisions.
📌My approach is built on years of experience and a solid track record. I don’t claim to know it all but I’m confident in my ability to spot high-probability setups.
📌If you would like to learn how to use the heatmap, cumulative volume delta and volume footprint techniques that I use below to determine very accurate demand regions, you can send me a private message. I help anyone who wants it completely free of charge.
🔑I have a long list of my proven technique below:
🎯 ZENUSDT.P: Patience & Profitability | %230 Reaction from the Sniper Entry
🐶 DOGEUSDT.P: Next Move
🎨 RENDERUSDT.P: Opportunity of the Month
💎 ETHUSDT.P: Where to Retrace
🟢 BNBUSDT.P: Potential Surge
📊 BTC Dominance: Reaction Zone
🌊 WAVESUSDT.P: Demand Zone Potential
🟣 UNIUSDT.P: Long-Term Trade
🔵 XRPUSDT.P: Entry Zones
🔗 LINKUSDT.P: Follow The River
📈 BTCUSDT.P: Two Key Demand Zones
🟩 POLUSDT: Bullish Momentum
🌟 PENDLEUSDT.P: Where Opportunity Meets Precision
🔥 BTCUSDT.P: Liquidation of Highly Leveraged Longs
🌊 SOLUSDT.P: SOL's Dip - Your Opportunity
🐸 1000PEPEUSDT.P: Prime Bounce Zone Unlocked
🚀 ETHUSDT.P: Set to Explode - Don't Miss This Game Changer
🤖 IQUSDT: Smart Plan
⚡️ PONDUSDT: A Trade Not Taken Is Better Than a Losing One
💼 STMXUSDT: 2 Buying Areas
🐢 TURBOUSDT: Buy Zones and Buyer Presence
🌍 ICPUSDT.P: Massive Upside Potential | Check the Trade Update For Seeing Results
🟠 IDEXUSDT: Spot Buy Area | %26 Profit if You Trade with MSB
📌 USUALUSDT: Buyers Are Active + %70 Profit in Total
🌟 FORTHUSDT: Sniper Entry +%26 Reaction
🐳 QKCUSDT: Sniper Entry +%57 Reaction
📊 BTC.D: Retest of Key Area Highly Likely
📊 XNOUSDT %80 Reaction with a Simple Blue Box!
📊 BELUSDT Amazing %120 Reaction!
I stopped adding to the list because it's kinda tiring to add 5-10 charts in every move but you can check my profile and see that it goes on..

Bitcoin (BTC/USD) Technical Analysis – Bullish Setup🔵 Key Levels:
🎯 Target Point: 87,050.22 (🔼 Expected upward move)
🔵 Support Zone: 79,833.82 (🛡️ Strong demand area)
🔴 Current Price: 82,254.27
📊 Analysis:
🔵 RBS + RBR Zone (🔄 Role Reversal Support & Rally Base Rally) - Possible entry point for a long position.
🟠 Stop Loss: Below 79,833.82 (🚨 Risk Management)
🟣 Resistance Zone: Near 83,000 (🔄 Possible short-term pullback)
📈 Strategy:
1️⃣ Price might retrace to the blue zone (support) before continuing upward.
2️⃣ If it holds, 🚀 potential rally towards 87,050.22 🎯
3️⃣ If it breaks below support, ⚠️ possible downside risk.
✅ Conclusion:
A bullish setup with a 7.45% profit target 📊
Risk managed with a stop loss below support ⚠️

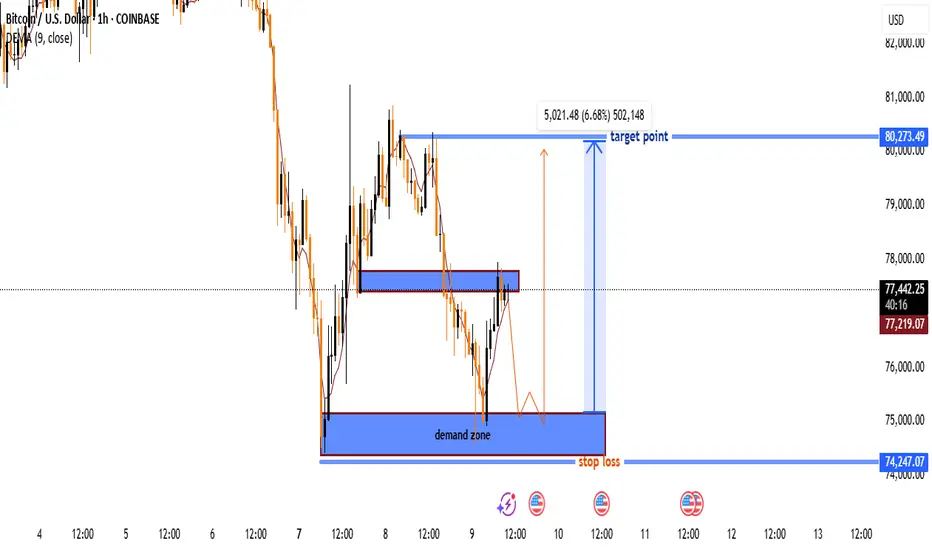
BTC/USD Long Setup – Bounce from Demand Zone Towards $80K TargetKey Zones
Demand Zone (Buy Zone)
🔵 $74,250 – $75,000
Strong support area
Buyers previously stepped in here
Marked for potential entry
Resistance Zone
🟣 $77,300 – $77,600
Mid-level resistance
Could cause a short pullback
Watch for breakout or rejection
Target Point
🎯 $80,273.49
Potential upside: +6.68% gain
Previous supply/structure zone
Take Profit (TP) zone
Stop Loss
⛔ $74,247.07
Just below the demand zone
Protects against invalid setup
Trade Idea
1. 🔽 Price expected to drop into demand zone
2. 🔄 Wait for bullish confirmation (e.g. bounce or engulfing candle)
3. 📈 Enter long position near $75,000
4. ⬆️ Ride it up through resistance
5. ✅ Target = $80,273 | ❌ Stop = $74,247
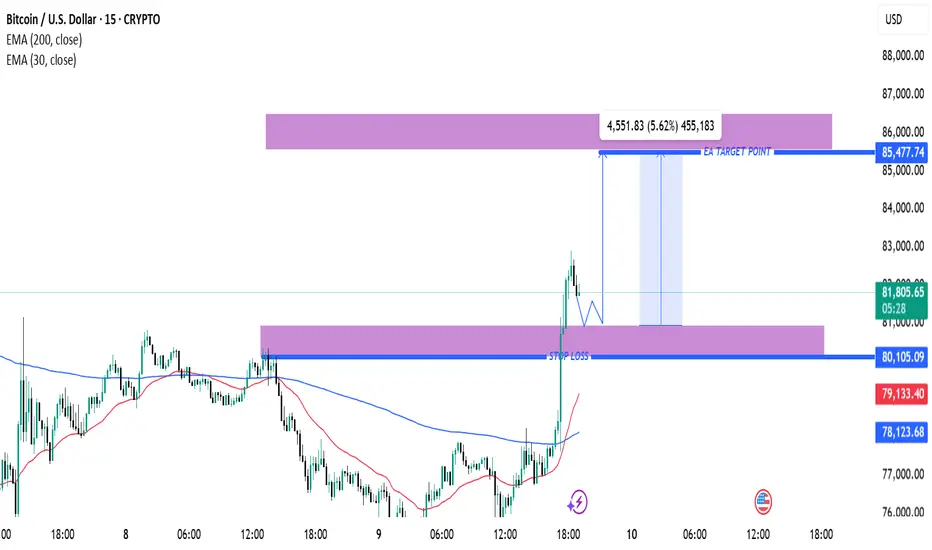
BTC/USD Bullish Breakout Setup – Targeting $85,477 with 5.62% UpThe price has recently surged above both the 30 EMA (red) and 200 EMA (blue), signaling a strong bullish move.
The EMAs are beginning to turn upward, particularly the 30 EMA, suggesting short-term bullish momentum.
Key Levels Identified
Entry Zone (Purple Support Zone):
Around $80,105 – a potential buy zone after a pullback.
Labeled with STOP LOSS, indicating the invalidation level if price drops below this zone.
Target Zone (Purple Resistance Zone):
Around $85,477 – this is the target level, marked as “EA TARGET POINT”.
Offers a potential move of +5.62% or 4,551.83 points.
Price Action
Price broke above a previous resistance (now support) and has pulled back slightly.
The projected move suggests a bullish continuation after a minor pullback and consolidation.
Risk-Reward
Good risk-reward ratio implied with the large gap between the stop loss and target.
Stop loss is tight, just below the purple support zone (~$80,105).
Projection
The blue lines and annotations suggest a bullish play, with an expected upward movement after retesting the support.
✅ Possible Trade Idea
Buy Zone: ~$80,105 (on a confirmed retest)
Stop Loss: Slightly below $80,105
Target: ~$85,477
Expected Move: +5.62%
🔍 Additional Notes
Keep an eye on price behavior around the support zone—confirmation (e.g., bullish candle pattern or rejection wick) strengthens the entry.
The strong move leading to the breakout suggests high momentum, which could mean limited pullback.
News or macro developments could invalidate technicals—be aware of external factors.
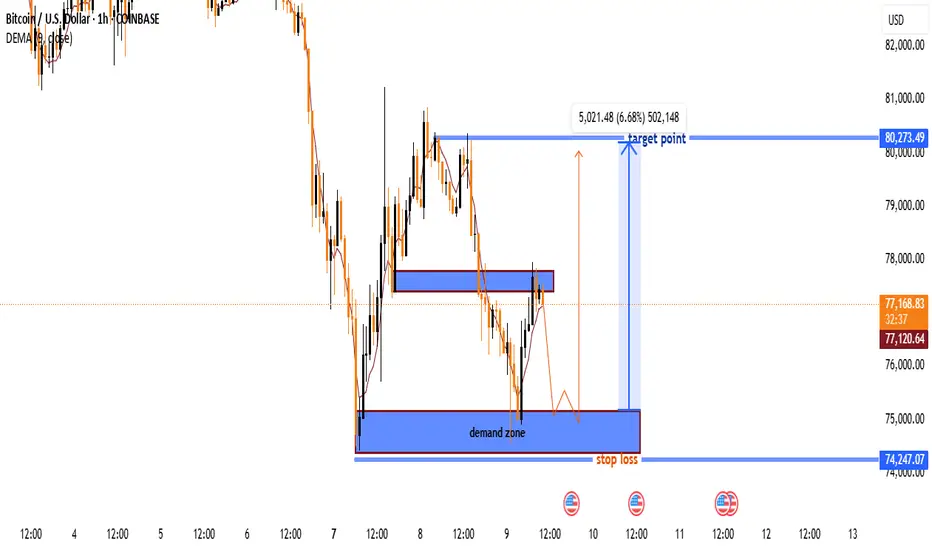
BTC/USD Long Setup – Bounce from Demand Zone Towards $80K TargetKey Zones
Demand Zone (Buy Zone)
🔵 $74,250 – $75,000
Strong support area
Buyers previously stepped in here
Marked for potential entry
Resistance Zone
🟣 $77,300 – $77,600
Mid-level resistance
Could cause a short pullback
Watch for breakout or rejection
Target Point
🎯 $80,273.49
Potential upside: +6.68% gain
Previous supply/structure zone
Take Profit (TP) zone
Stop Loss
⛔ $74,247.07
Just below the demand zone
Protects against invalid setup
Trade Idea
1. 🔽 Price expected to drop into demand zone
2. 🔄 Wait for bullish confirmation (e.g. bounce or engulfing candle)
3. 📈 Enter long position near $75,000
4. ⬆️ Ride it up through resistance
5. ✅ Target = $80,273 | ❌ Stop = $74,247
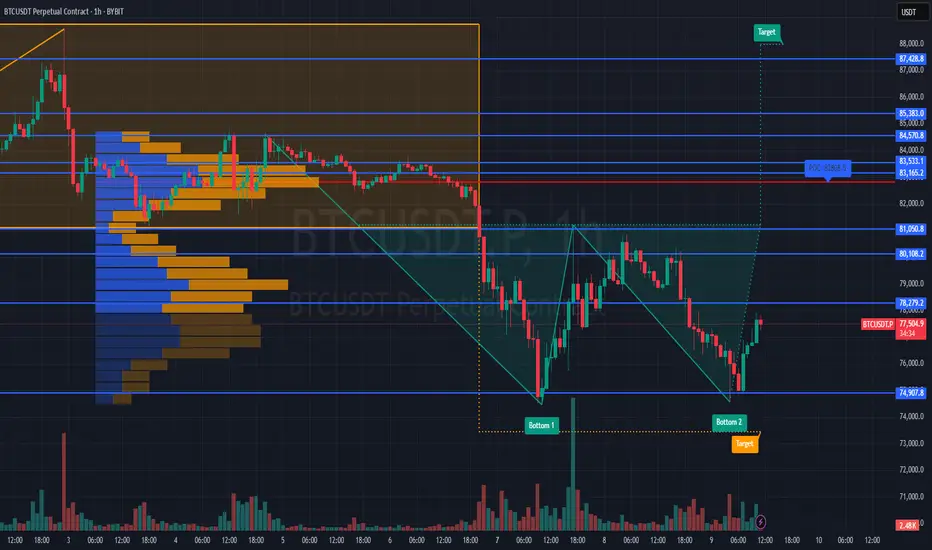
#BTCUSDT at a Turning Point: Volume, Pattern & Macro Analysis🚀 BYBIT:BTCUSDT.P is potentially entering the final phase of a correction, but key levels have not yet been broken or confirmed — caution and reliance on validated signals are essential.
✅ Technical Analysis:
📈 Overall Timeframe Context:
➡️ 1H (hourly chart): A “double bottom” structure is forming, suggesting potential for a local rebound. Volume is gradually increasing at the second reversal point (Bottom 2), confirming growing buyer interest. A resistance zone is forming near the POC (83,236.9), but the price has yet to firmly break above 77,000.
➡️ 4H (4-hour chart): A more distinct “double top” pattern (Top 1 / Top 2) has already played out. Price broke down from the sideways range, falling below the lower boundary of the rectangle. It is currently trading near the key support level of 74,907.8 with an attempt to bounce back upward.
➡️ 1D (daily chart): A key observation is the breakdown of the ascending wedge, followed by the formation of a falling wedge — a potentially bullish pattern. The price is testing the lower edge of this wedge. A sharp increase in volume may indicate the start of an accumulation phase.
📍 Key Point:
➡️ The 74,907.8 level has been tested twice with strong volume response, reinforcing its role as a critical support zone.
➡️ A large liquidity cluster around the 83,000–84,000 POC zone could act as a price magnet in the event of a reversal.
📊 Volume Profile Analysis:
➡️ Across all timeframes, the POC is shifting toward the upper part of the range, confirming that buyers previously dominated the market. Redistribution now appears to be underway.
➡️ Most of the volume activity has been concentrated in the 83,000–85,000 range — if price returns to this zone, strong resistance is expected.
🔄 Market Structure:
➡️ A transition is underway from a distribution phase to a potential accumulation phase.
➡️ The downtrend remains active on the daily chart, but there are signs of momentum slowing and attempts to form a bottom.
✅ Fundamental Analysis:
🌐 Macroeconomic Outlook:
➡️ In early April, discussions about a potential Federal Reserve interest rate cut are expected to continue — a moderately positive factor for risk assets, including cryptocurrencies.
➡️ BYBIT:BTCUSDT.P remains in the spotlight for institutional investors (with ongoing inflows into BYBIT:BTCUSDT.P ETFs), though geopolitical uncertainty and dollar liquidity pressure persist.
🏦 Capital Flows:
➡️ Trading volume remains high, but there is a lack of significant inflows, suggesting that major players may be adopting a wait-and-see stance.
📢 Recommendations for BYBIT:BTCUSDT.P :
📢 Closely monitor the price reaction in the 74,900–75,000 zone — a breakout or confirmation of support will determine short-term direction.
📢 The 78,279.2 level is a key resistance — its breakout could attract new buyers.
📢 Watch how price behaves within the falling wedge (1D); if the structure tightens and volume increases, a breakout may follow.
📢 Keep monitoring macroeconomic events — particularly U.S. inflation data and upcoming Fed meetings.
📢 Pay close attention to volume activity at local lows — this may be the key to spotting a trend reversal.
BTC/USD 1H Chart Analysis – Bearish Setup with SBR Rejection🔵 Key Zones & Levels:
🔷 SBR Zone (Support ➡ Resistance):
Price Range: ~$81,000–$83,000
🛑 Stop Loss: $83,002.31 (Just above resistance)
Expecting sellers to step in here if price retests this level
🟠 Mid-Range Zone:
Current price is consolidating just below SBR zone
Could form a lower high before dropping
🟦 Target Zone (Support Area):
🎯 Target Price: ~$75,000
Previous demand area – price bounced hard from here before
🔁 Trade Plan:
📉 Bias: Bearish
📍 Entry: Near current price or after retest of SBR zone
🛑 Stop Loss: $83,002.31
🎯 Target: $75,000 (approx -8.33%)
✅ Summary:
Risk-Reward: Appears solid (R:R > 2:1)
🕵️♂️ Watch for: Fakeouts or rejections in the SBR zone
🔻 Potential Move: -6,804 points if plan plays out

Bitcoin Formed a Double Bottom Bullish PatternFenzoFx—Bitcoin formed a double bottom bullish pattern. A consolidation phase toward $81,160 is imminent if the price holds above $74,475.
>>> Trade BTC/USD, swap free at FenzoFx Decentralized Forex Broker.

BTC-----Sell around 80700, target 79000 areaTechnical analysis of BTC contract on April 8: Today, the large-cycle daily level closed with a small positive line yesterday, and the K-line pattern was a single negative and a single positive. The main reason for the decline was the stimulation of the news, so there was no continuous negative pattern, but the price was below the moving average, and the attached indicator was dead cross and running downward. The decline in the general trend was very obvious. The current moving average pressure position was near the 81000 area. Although the current trend is very clear, we still need to remind everyone to pay attention to the risk of retracement. Risk control must be strictly done, because many friends have gambling nature and do it with large positions. Once the risk is not controlled, there will be a situation of liquidation; the short-cycle hourly chart has been continuously rebounding since yesterday's day. The current K-line pattern is the same, and the attached indicator is running in a golden cross. There is no signal of pressure, so we have to wait during the day, and use the daily moving average pressure as a defensive position.
Therefore, today's BTC short-term contract trading strategy: sell at the rebound 80700 area, stop loss at the 81200 area, and target the 79000 area;
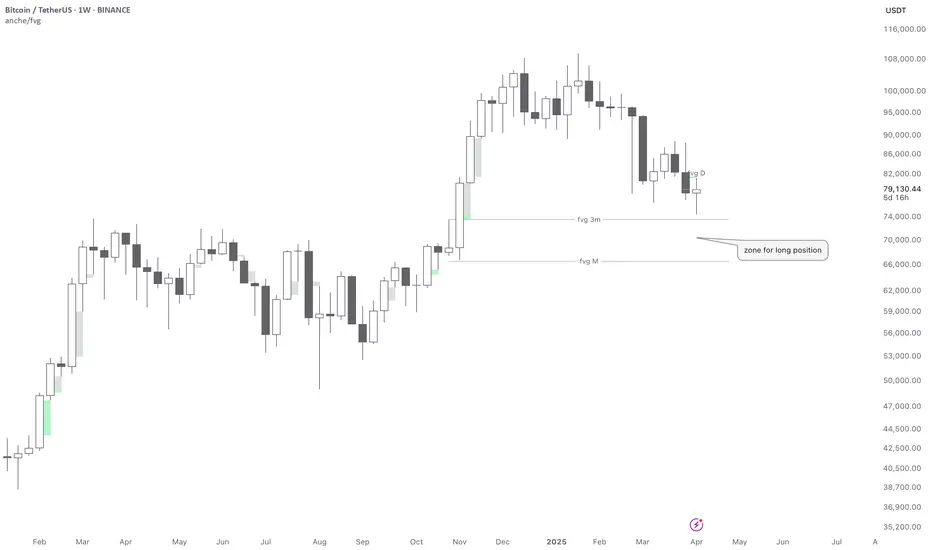
BTCUSDT📊 Bitcoin Weekly Analysis – Smart Money Concept (SMC)
On the 1W BTC/USDT chart, we are currently observing a corrective move after a strong bullish impulse. The price is approaching a high-probability demand zone formed between two significant Fair Value Gaps (FVGs):
• 🔹 FVG 3M around $74,000
• 🔹 FVG M around $66,000
🟩 Long Setup Zone:
The area between these FVGs represents a discounted price zone where smart money is likely to step in. This is labeled as a “zone for long position” on the chart.
⸻
🧠 Smart Money Perspective:
• The market is in a retracement phase, targeting inefficiencies (FVGs).
• If price taps into this zone and shows signs of bullish intent (e.g., weekly bullish engulfing, BOS/CHOCH on lower timeframes), we can expect a strong upward move.
⸻
🎯 Mid-to-Long Term Target:
• Based on the current market structure and SMC model, the next major target is $130,000.
⸻
🔐 Risk Management:
• Ideal entry: within the FVG zone
• Stop-loss: below the lower FVG (around $65,000)
• Confirmation: bullish price action on lower timeframes or weekly candle close with strong momentum
⸻
📌 Conclusion:
This setup offers a potential high-reward opportunity if smart money reacts to this discounted zone. Patience and proper confirmation are key.
⸻
BITCOIN | 1 DAY | '' Bitcoin will fall to $72,000 ''Hey everyone 💙
In the long run, I expect BINANCE:BTCUSD to drop to around $72,000. But don’t worry—this could actually be a sign of a massive rally ahead. If you're holding spot positions, there's no need to panic!
Big moves up often come after strong corrections. In my opinion, this dip is just a profit-taking phase, and the whales are setting the stage to push Bitcoin above $100K in the long term.
If you enjoy these insights, don’t forget to hit that like button🚀
BTC Possible buying opportunity Possible buying opportunity if Weekly 50 SMA and Fib level 61.80% hold the price.
BTC SHORT TP 82,600 04-04-2025🚨 Bitcoin is showing weakness on the lower timeframes, specifically the 1-hour and 2-hour charts, so I'm looking for a short position with a take profit (TP) set at 82,700, giving us a solid 3RR.
You can start entering now and average your position as it develops. Since this analysis is based on the 1-hour timeframe, we should see results within the next 15 to 19 hours. If we run out of time, I'll keep you updated with the latest analysis!
Make sure to follow me to stay in the loop and keep generating those green profits! 💰🔥
BTC-----Sell around 83500, target 82500 areaTechnical analysis of BTC contract on April 5: Today, the large-cycle daily level closed with a small positive line yesterday, the K-line pattern was single negative and single positive, the price was below the moving average, and the fast and slow lines of the attached indicator were glued and flattened. The overall trend yesterday fluctuated in the range. If the rhythm is well grasped, the profit will be very good. If the rhythm is not good, it will also be a painful loss, but the general trend is still firmly bearish; the short-term Thursday hourly chart yesterday US market price fluctuated severely, the K-line pattern was continuous negative in the early morning, and the price was suppressed below the moving average. The hourly chart continued to fall during the day after the pressure in the early morning. The current K-line pattern fell continuously, and the attached indicator was dead cross running, so the probability of continuing to fall during the day is still high, but today is the weekend, the strength is not expected to be large.
Today's BTC short-term trading strategy: directly maicjhu in the current price area of 83,500, stop loss in the 84,000 area, and target the 82,500 area;

Bitcoin Bullish Continuation Towards $128KBTC/USD | 1D Chart | April 2025
📊 Technical Analysis:
Bitcoin is maintaining its bullish structure within a well-defined ascending channel. The price has bounced off the lower trendline (green), which has provided strong support multiple times (see green arrows).
Currently, BTC is consolidating near $83,800, and a breakout from this zone could initiate the next impulsive move towards the midline and upper trendline resistance (~$128,000).
Support Levels: ~$80,000 (trendline)
Resistance Levels: ~$90,000, ~$110,000, and ~$128,000
Bullish Trigger: A confirmed breakout above $90,000 could signal strong continuation
🌍 Fundamental Analysis:
Bitcoin Halving (April 2024): Historically, BTC rallies post-halving due to reduced supply. The next supply shock could fuel a rally.
Institutional Demand: Spot Bitcoin ETFs continue to see record inflows, with firms like BlackRock and Fidelity accumulating BTC aggressively.
Macroeconomic Factors: With inflation concerns persisting, investors are turning to Bitcoin as a hedge, pushing prices higher.
📈 Trade Idea:
Entry: $84,000 (Breakout Confirmation)
Stop Loss: $79,000 (Below Trendline)
Target Range: $110,000 – $128,000 (Channel Resistance)

Bitcoin vs. Nasdaq: BTC Shows Signs of Decoupling Amid US Stock
For years, the narrative surrounding Bitcoin’s price action has been inextricably linked to the performance of traditional financial markets, particularly the tech-heavy Nasdaq Composite. Often moving in lockstep, Bitcoin was viewed by many as a high-beta asset, amplifying the gains during bullish periods and suffering even steeper losses when risk sentiment soured in equities. However, recent market movements have sparked a crucial question among investors and analysts alike: is Bitcoin finally beginning to forge its own path, decoupling from the gravitational pull of U.S. stocks as they face mounting headwinds?
The past few weeks have witnessed a notable divergence. While U.S. stock markets, reeling from a confluence of factors including escalating geopolitical tensions stemming from a potential “Trump tariff war,” persistent inflation concerns highlighted by Federal Reserve Chair Jerome Powell’s hawkish warnings of “higher inflation and slower growth,” and broader macroeconomic anxieties, have experienced a significant downturn – shedding a staggering $3.5 trillion in value – Bitcoin has demonstrated a surprising degree of resilience, even posting gains in some instances. This nascent divergence has ignited a wave of optimism among Bitcoin proponents who have long yearned for the digital asset to be recognized and traded based on its own fundamental merits, rather than as a mere proxy for risk-on sentiment in the equity markets.
The concept of Bitcoin decoupling from traditional assets has been a recurring theme in the cryptocurrency space. The original thesis for Bitcoin, after all, positioned it as a decentralized, censorship-resistant store of value and a hedge against traditional financial system vulnerabilities. Its finite supply, its independence from central banks and government policies, and its inherent scarcity were touted as key differentiators that would eventually lead it to trade independently. However, the reality of the past few years has often painted a different picture, with institutional adoption bringing increased correlation with established asset classes.
The current shift, however tentative, offers a glimmer of hope for those who believe in Bitcoin’s unique value proposition. The factors contributing to the stock market slump – trade war anxieties, inflation fears, and the prospect of tighter monetary policy – arguably strengthen the case for Bitcoin as an alternative asset. In times of economic uncertainty and currency debasement concerns, the fixed supply and decentralized nature of Bitcoin could become increasingly attractive to investors seeking a safe haven outside the traditional financial system.
Furthermore, the increasing maturity of the Bitcoin market, with the development of more sophisticated trading instruments, greater institutional participation, and a deeper understanding of its underlying technology, may be contributing to its growing independence. As Bitcoin gains broader acceptance as a legitimate asset class, its price discovery mechanisms may become less reliant on the sentiment driving traditional equity markets.
However, it is crucial to approach this apparent decoupling with a degree of caution. While the recent divergence is encouraging for Bitcoin bulls, it is too early to definitively declare the long-awaited break has finally arrived. Market correlations can be fluid and influenced by a multitude of factors. A sudden shift in global risk sentiment or a significant negative event specific to the cryptocurrency space could easily re-establish the link between Bitcoin and traditional assets.
Adding a layer of complexity to the current narrative is the warning from some analysts regarding a potential Bitcoin price correction. Despite the recent resilience, multiple BTC price forecasting models have pointed towards a scenario where Bitcoin could fall back to its 2021 all-time high of around $70,000 in a relatively short timeframe – some even suggesting this could occur within the next ten days. This potential “crash risk,” as one analyst termed it, is attributed to various technical and market cycle indicators.
The notion that $70,000 could represent Bitcoin’s “practical bottom,” as suggested by some, highlights the inherent volatility and speculative nature of the cryptocurrency market. Even if Bitcoin is beginning to decouple from traditional equities, it remains susceptible to its own unique set of risks and price swings. Factors such as regulatory developments, network security concerns, and shifts in investor sentiment within the crypto space can still exert significant influence on its price.
Therefore, while the current divergence between Bitcoin and the struggling U.S. stock market offers a compelling narrative and fuels the hopes of long-term Bitcoin holders, it is essential to maintain a balanced perspective. The confluence of factors driving the stock market decline could indeed be creating an environment where Bitcoin’s unique characteristics become more appealing, leading to a sustained period of independent price action. However, the inherent volatility of the cryptocurrency market and the potential for a significant correction remind investors that the journey towards true decoupling is likely to be a complex and potentially bumpy one.
In conclusion, the recent market dynamics present a fascinating juncture for Bitcoin. The initial signs of decoupling from the crumbling U.S. stock market, driven by a confluence of macroeconomic anxieties and the potential for Bitcoin to act as an alternative store of value, are undeniably encouraging for those who believe in its long-term potential. However, the warnings of a potential price correction underscore the inherent risks within the cryptocurrency space. Whether this nascent decoupling marks a definitive shift in Bitcoin's market behavior or proves to be a temporary divergence remains to be seen. Investors would be wise to monitor these trends closely, remaining cognizant of both the potential for independent growth and the ever-present risks associated with this dynamic and evolving asset class. The coming weeks and months will be crucial in determining whether Bitcoin can truly forge its own path in the face of traditional market turmoil.

BTC(20250404) market analysis and operationTechnical analysis of BTC contract on April 4: Today, the large-cycle daily level closed with a small positive line yesterday, and the K-line pattern was a single negative and a single positive. The price was still at a low level. The fast and slow lines of the attached chart indicator were glued together and flattened, but it was obvious that the rising price was suppressed, and the pullback was not strong. On the contrary, there seemed to be more opportunities for decline. From the overall technical indicators, the decline in the big trend is still very obvious, so the idea remains unchanged and continue to sell; in the short cycle, the current price is still in a volatile trend. The four-hour chart has a single negative and a single positive, and the attached chart indicator is dead cross, but the strength has not come out. The hourly chart corrected the high point position of 84,000 after the sharp drop this week. The current attached chart indicator is golden cross running, and there is no room for rise or fall, so wait and see during the day, pay attention to the strength and weakness of the European market and the impact of the evening data

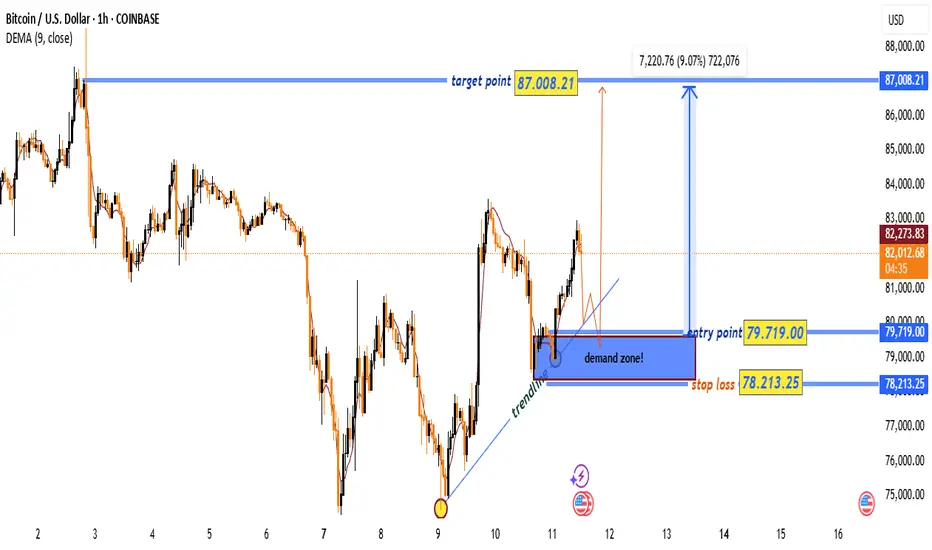
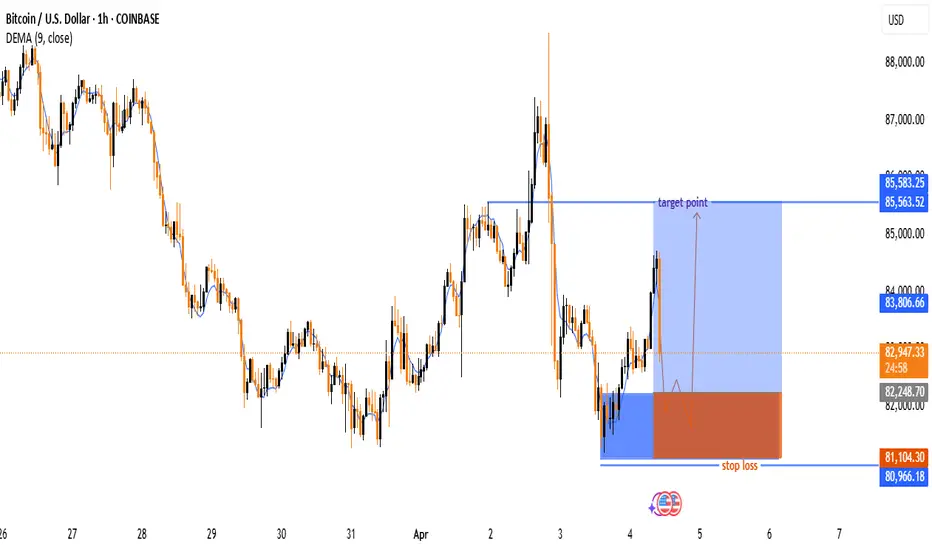
Bitcoin (BTC/USD) Trade Setup & Analysis🔹 Trend Analysis:
📉 The chart shows a downtrend followed by a reversal attempt.
📈 The price bounced off a support zone and is moving upwards.
🔹 Indicators:
📊 The 9-period DEMA (83,805.38) is slightly above the current price, acting as a resistance level.
🔹 Trade Setup:
🟢 Entry Zone: Around 82,943 (Current Price)
🔴 Stop-Loss: 81,183.22 ❌ (Below support level)
🎯 Target Point: 85,563.52 ✅ (Upper resistance level)
🔵 Strategy: The trade anticipates a price dip before
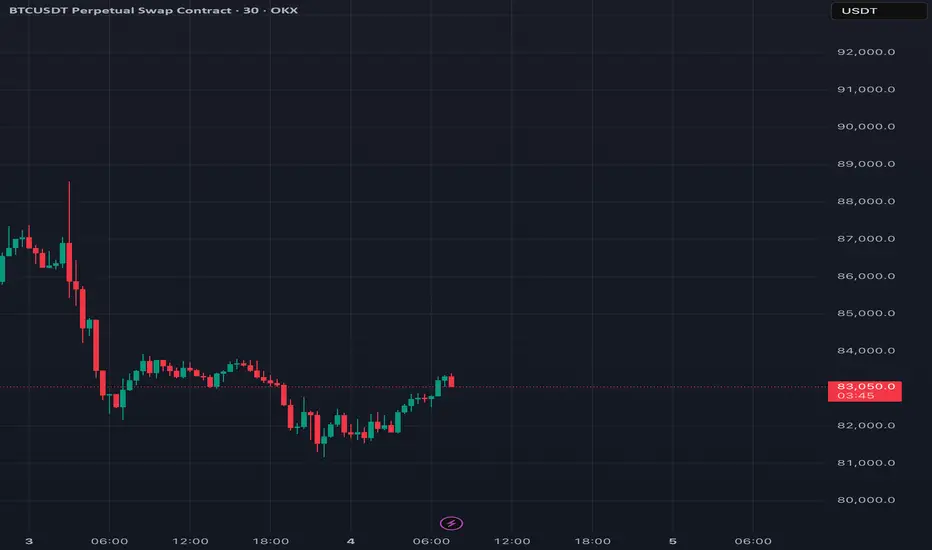
BTC/USDT Analysis – 30-Minute Chart (OKX)BTC/USDT Analysis – 30-Minute Chart (OKX)
Key Support Levels:
Immediate support: 82,596 USDT
Stronger support: 81,900 USDT (Potential entry point)
Stop-loss: Below 79,426 USDT (Risk management)
Key Resistance Levels:
First resistance: 84,326 USDT
Next resistance: 85,726 USDT (Major supply zone)
Higher targets: 87,702 – 88,547 USDT
Indicators & Market Structure:
BTC is testing a short-term support after a bearish move.
The Stochastic RSI shows an overbought condition, signaling a potential retracement.
The EMA 20, 50, 100, and 200 are showing mixed signals; BTC needs to break above EMA 100 to confirm bullish momentum.
The MACD histogram is showing early signs of bullish momentum.
Trade Plan:
Bullish case: If BTC holds 82,596 – 81,900 USDT, a reversal towards 84,326 – 85,726 USDT is possible.
Bearish case: If BTC drops below 81,900 USDT, further downside towards 79,426 USDT may happen.
📌 Summary:
BTC is at a crucial level, consolidating around support. If it holds above 82,596 USDT, we could see a bounce toward 85,726 USDT. However, a break below 81,900 USDT could trigger more downside. Monitor price action carefully before entering a position. 🚀
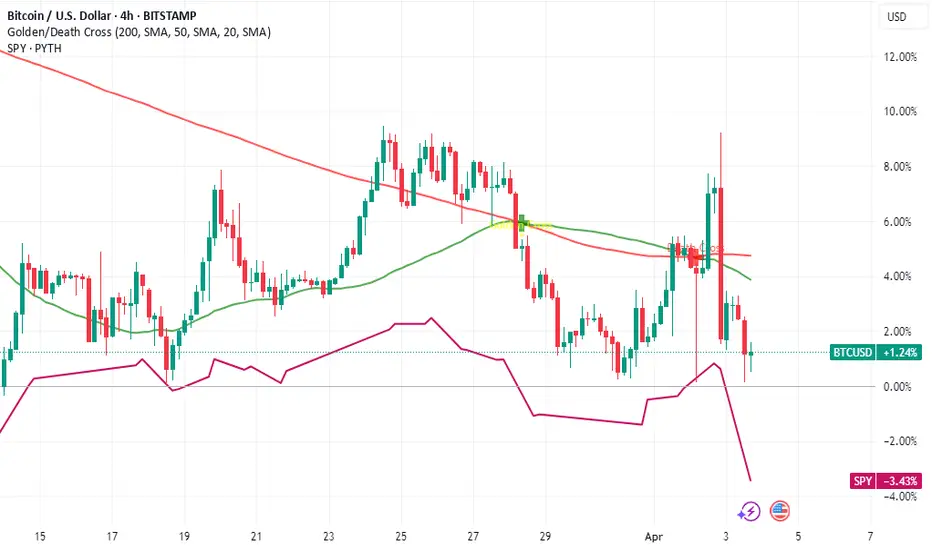
Navigating BTC Volatility Storm: Buy, Hold, or Flee?Bitcoin's recent price action has been reminiscent of a rollercoaster, leaving investors grappling with a whirlwind of conflicting signals. From sharp drops mirroring stock market turmoil to the looming "death cross," the cryptocurrency's trajectory is shrouded in uncertainty. Is this a prime buying opportunity, a warning to retreat, or simply another bout of the volatility that defines Bitcoin?
The past few days have been a stark reminder of Bitcoin's inherent volatility. Reports of an 8% drop, coupled with the US stock market shedding $2 trillion in value, sent ripples through the crypto sphere. The catalyst? Concerns surrounding potential US tariffs and their impact on the global economic outlook. This sudden shift in market sentiment triggered a sell-off, reminiscent of the COVID-19 crash in 2020, during which Bitcoin’s pre-pandemic gains evaporated.
Adding to the unease is the looming "death cross," a technical indicator that occurs when the 50-day moving average crosses below the 200-day moving average. Historically, this pattern has signaled bearish momentum. The 2022 death cross, for example, precipitated a significant price drop of nearly 20%. Conversely, "golden crosses," where the 50-day moving average crosses above the 200-day moving average, have historically signaled bullish momentum, triggering rallies of over 500% in 2020 and 2021.
Currently, Bitcoin's 50-day moving average is edging closer to this critical crossover, prompting widespread speculation. Is this a repeat of 2022, or will the market defy historical patterns? The answer, as always, is complex and contingent on a confluence of factors.
One significant factor is the strength of the US dollar. While the dollar's strength can often negatively impact Bitcoin, the current increase in the money supply could potentially counteract this effect, creating a bullish flag pattern. The dollar's inflation may become a catalyst for Bitcoin as a store of value. The global market dynamics are currently shrouded in uncertainty, making it difficult to predict the long-term impact of these factors.
The recent price drops have pushed Bitcoin towards the $80,000 mark, with some analysts predicting a potential fall to $71,000. However, this level could also represent a "sizeable bounce," acting as a strong support zone for Bitcoin. The concept of an "oversold bounce" also comes into play. After a period of intense selling pressure, markets often experience a relief rally as traders capitalize on discounted prices. Whether this materializes remains to be seen.
Is it a Good Time to Buy Bitcoin?
The decision to buy, hold, or sell Bitcoin depends on an individual's risk tolerance, investment strategy, and understanding of the market. Here's a breakdown to consider:
• For the Long-Term Investor:
o Bitcoin's long-term potential remains a compelling narrative. Its decentralized nature, limited supply, and growing adoption continue to attract institutional and retail investors.
o Price volatility is an inherent part of the Bitcoin journey. Historically, periods of sharp declines have been followed by significant rallies.
o Dollar-cost averaging (DCA) can mitigate the impact of volatility by investing a fixed amount at regular intervals, regardless of the price.1
o The strength of the US dollar may become a catalyst for Bitcoin as a store of value.
• For the Short-Term Trader:
o The current volatility presents opportunities for skilled traders to profit from price swings.
o Technical analysis, including monitoring moving averages and support/resistance levels, is crucial for identifying potential entry and exit points.
o However, short-term trading is inherently risky and requires a deep understanding of market dynamics.
o The "death cross" should be monitored carefully.
• For the Cautious Investor:
o The current market uncertainty may warrant a more conservative approach.
o Diversifying investments across different asset classes can help mitigate risk.
o Staying informed about market developments and avoiding emotional trading decisions is essential.
The Death Cross: A Warning or a False Alarm?
The "death cross" is a significant technical indicator, but it's not a foolproof predictor of future price action. Historical data show that while it can signal bearish trends, it's not always accurate. Market conditions, investor sentiment, and macroeconomic factors can all influence Bitcoin's trajectory.
Ultimately, the Bitcoin market remains highly speculative. The current volatility, driven by a confluence of factors, underscores the importance of careful research, risk management, and a long-term perspective. While the "death cross" and market fluctuations may cause short-term panic, the long-term potential of bitcoin, and it's reaction to the weakening dollar, may still produce long-term gains.