#BTC/UST#BTC
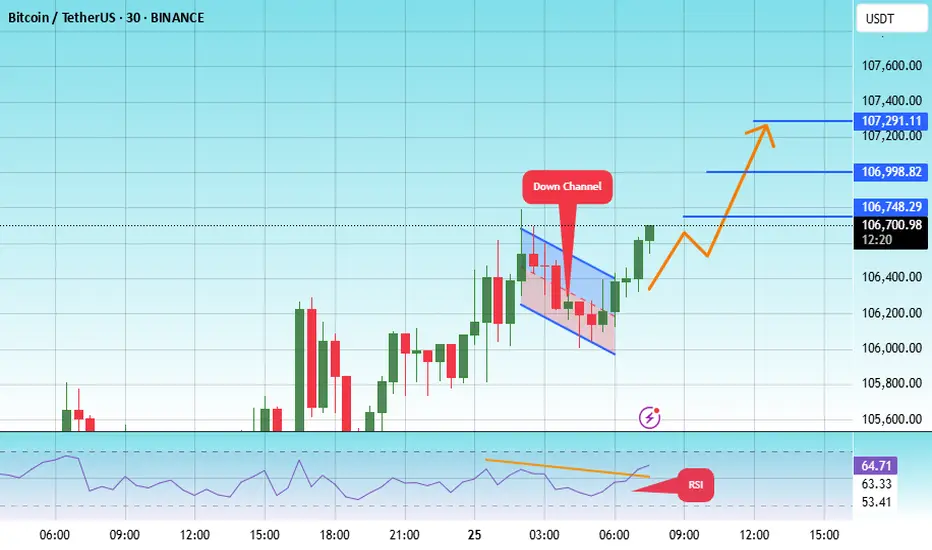
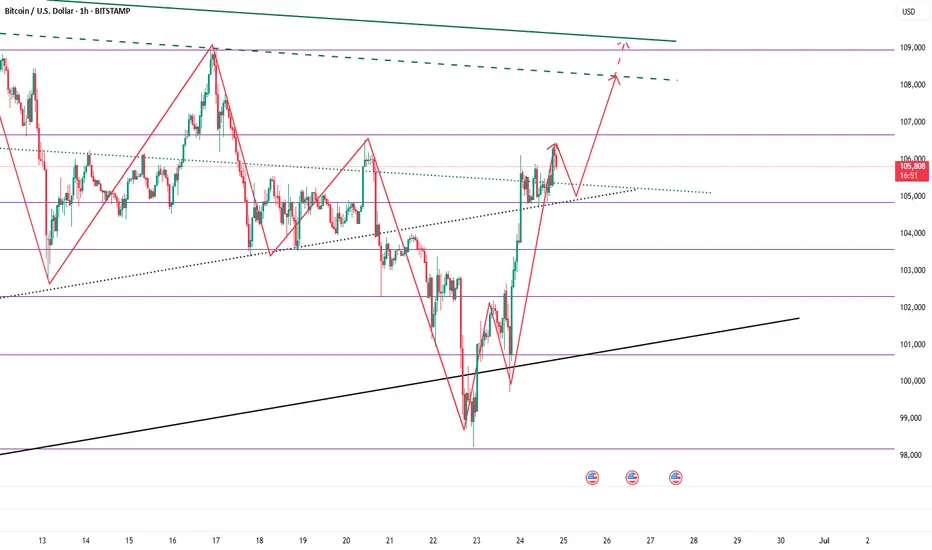
The price is moving within a descending channel on the 1-hour frame, adhering well to it, and is on its way to breaking it strongly upwards and retesting it.
We are seeing a rebound from the lower boundary of the descending channel, which is support at 106,000.
We have a downtrend on the RSI indicator that is about to break and retest, supporting the upward trend.
We are looking for stability above the 100 moving average.
Entry price: 106,600
First target: 106,750
Second target: 107,000
Third target: 107,291
Btctrade
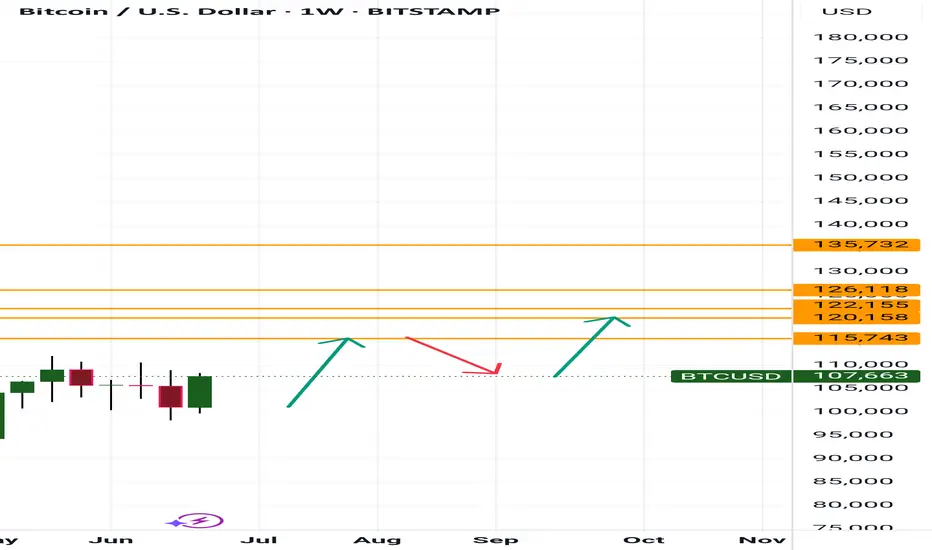
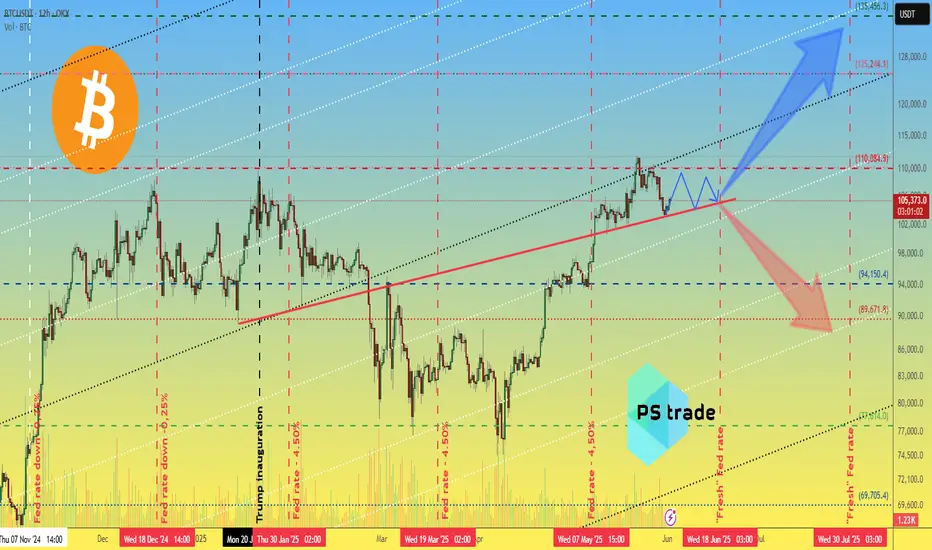
Bitcoin Drive up to 115k So currently BTC on the weekly and monthly is showing us a drive up to 115,700 then possibly seeing a correction major or minor then a drive up to 122k is what I am currently seeing at the moment
Kris Mindbloome Exchange
Trade Smarter Live Better
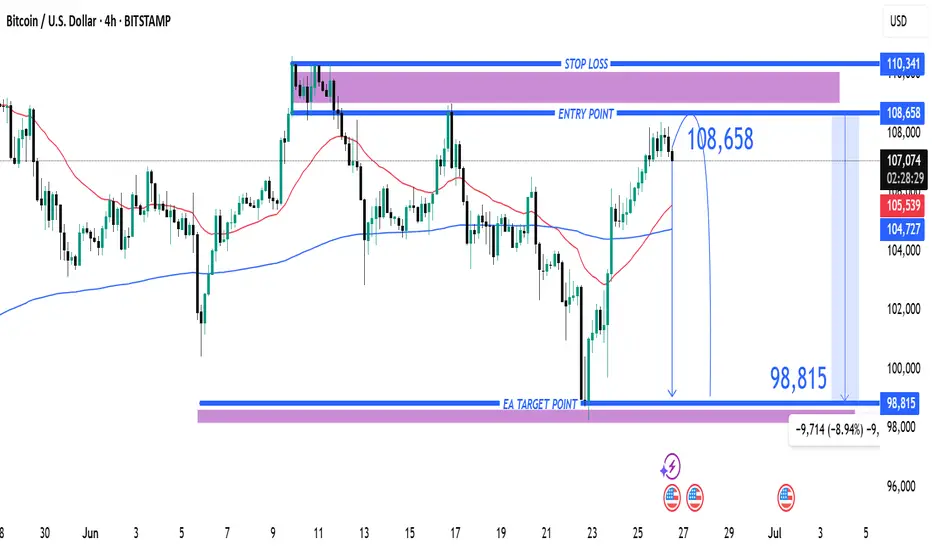
Setup: Entry at $108,658 with Target at $98,815 and Stop Loss at1. Entry Point: 108,658
This is where the trader expects to enter a short position.
Price is projected to reverse near this level.
2. Stop Loss: 110,341
Located above the entry point.
If price hits this level, the short trade is invalidated, limiting losses.
3. Target (Take Profit): 98,815
This is the EA Target Point, about 9,714 points (~8.94%) below the entry.
Represents a favorable risk-reward ratio.
---
🔄 Trade Idea Summary
Trade Type: Short (Sell)
Risk: ~1,683 points (110,341 - 108,658)
Reward: ~9,843 points (108,658 - 98,815)
Risk-Reward Ratio: ~1:5.85 (which is strong)
---
📊 Technical Indicators in Use
Moving Averages:
Likely 50-period (red) and 200-period (blue) MAs.
The 50 MA is below the price, indicating short-term bullishness.
However, the trade idea goes against this short-term trend, suggesting a reversal strategy.
---
🔍 Interpretation & Strategy
This chart implies the trader expects resistance near 108,658, possibly due to historical highs or supply zones.
The bearish outlook expects a significant drop to 98,815, possibly supported by macro patterns (like head & shoulders, or bearish divergence—not shown here but could be inferred).
The purple zones highlight high-probability reversal or reaction areas (support/resistance zones).
---
⚠️ Things to Watch
Invalidation: If price closes above 110,341 on a 4H/1D chart, the trade setup fails.
Confirmation: A strong bearish candlestick at or near the entry zone would strengthen the case.
Market Context: News, economic data, or BTC ETF inflows/outflows can quickly invalidate technical setups.
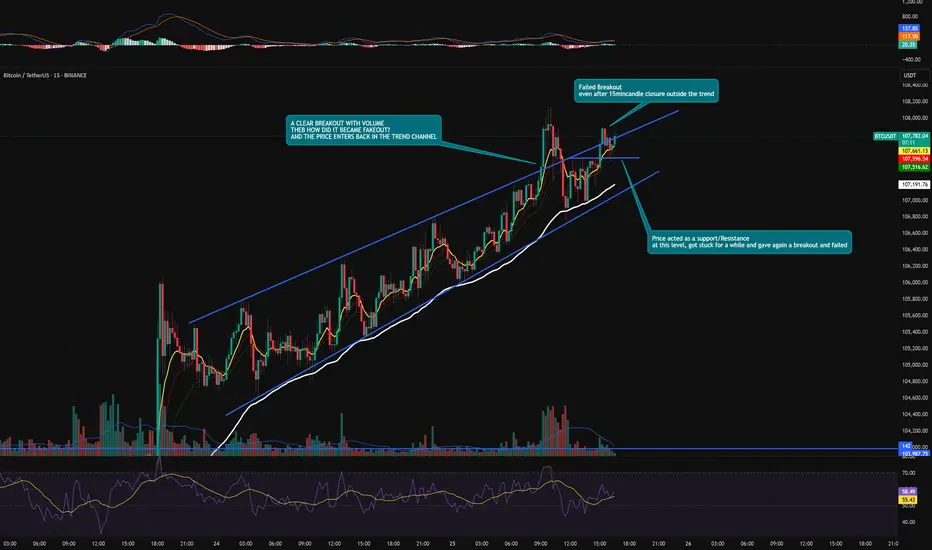
BTC/USDT – Fakeout Above Rising Channel | Why Clean Breakouts StThis chart highlights an important lesson in breakout trading: Not all breakouts are valid, even when backed by volume.
🔍 Technical Breakdown:
BTC was trading inside a well-respected ascending channel, with multiple touches on both the upper and lower bounds.
Price broke above the channel with a 15-minute candle close and volume, giving the appearance of a clean breakout.
However, shortly after, price re-entered the channel, invalidating the breakout. This is what we call a fakeout or bull trap.
❓ So Why Did the Breakout Fail?
Lack of Follow-Through Buyers:
Despite volume, there wasn’t enough buyer continuation above the breakout level to sustain momentum.
Liquidity Hunt:
The wick beyond the upper trendline likely served to trigger breakout entries and stop losses of short sellers, only to reverse after liquidity was collected.
Key S/R Reaction:
After re-entering the channel, price reacted at a minor horizontal level (previous S/R), attempted another push, but failed again, confirming weakness.
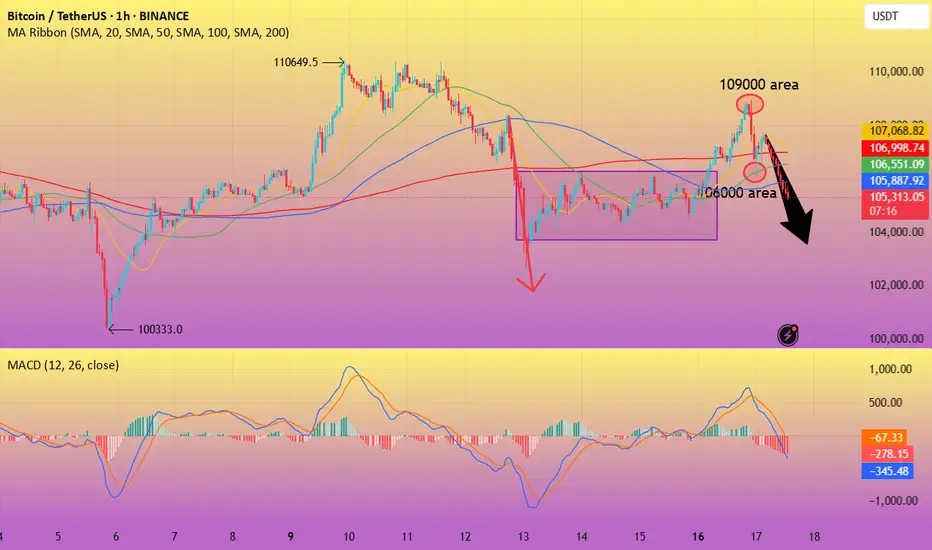
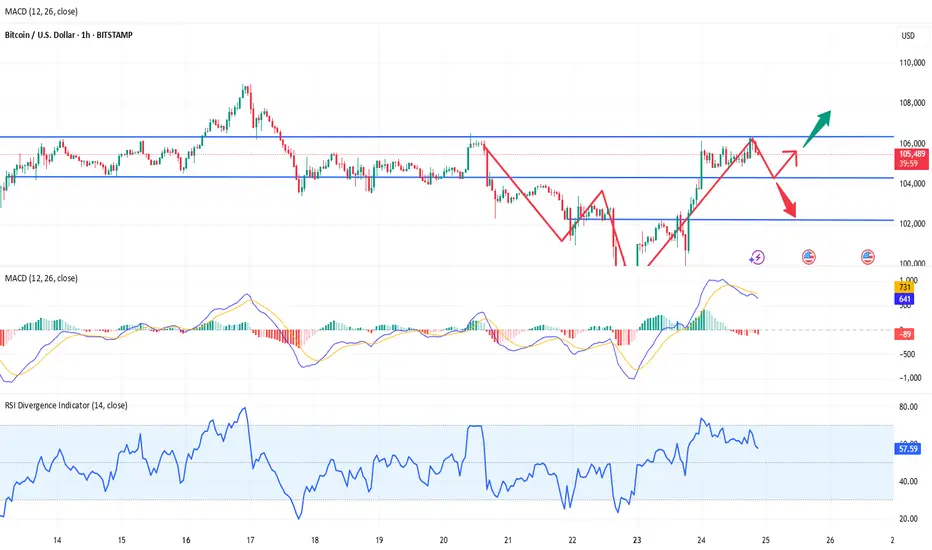
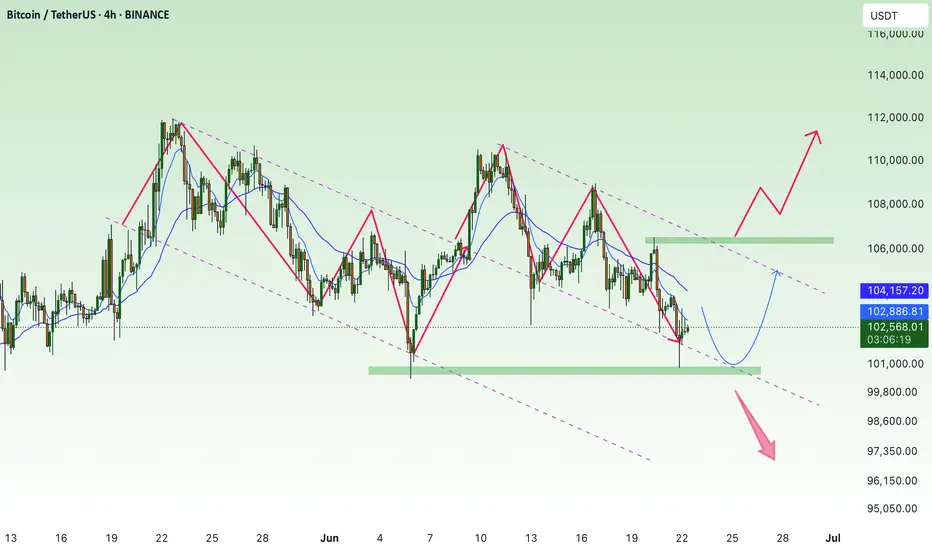
New buying opportunity may emerge for BTCBTC tends to fluctuate in the short term, but as BTC builds a double bottom structure to support the rebound pattern, it is currently inclined to fluctuate upward. Although the upward momentum has weakened after reaching around 106,000, as long as it stays above the 105,300-104,800 area, BTC is still expected to continue to rise and may challenge the 108,000-109,000 area again.
And with the collapse of the gold and oil markets, funds in the two markets may flow into BTC, which is more attractive and the mainstream market of cryptocurrencies. So as BTC retreats in the short term, BTC may have new short-term buying opportunities. Then if BTC retreats to the 105,500-104,500 area and does not fall below this area, we can consider going long on BTC at the right time.
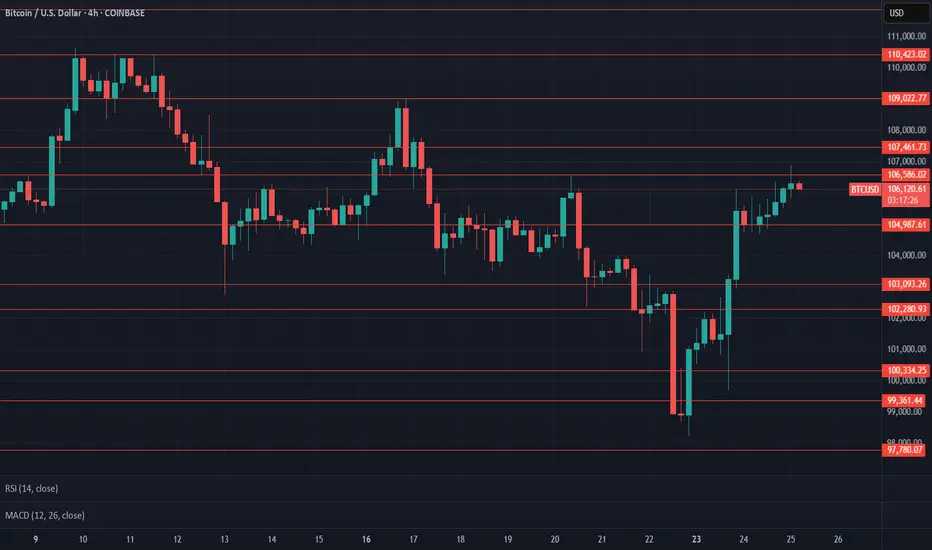
$BTC Update CRYPTOCAP:BTC #BTC $106,586 resistance in effect and testing as of now, $104,987 current support. $103,093 key support from here, $107,461 support required to reattempt taking $110,423. Dropping volume on 1D, Previous daily closed trying to follow thru on a bullish engulfing from Monday's close, current 1W looking massive good but it's just the beginning of the week - Watch given S/R.
BTC is expected to retreat in the short term, focus on 104500📰 Impact of news:
1. The ceasefire agreement reached earlier did not take effect, and Trump believed that both sides violated the agreement
2. Federal Reserve Chairman Powell delivered a speech 3 hours later
📈 Market analysis:
I haven't updated BTC for a while. Today I want to share my views on BTC with you. BTC is currently encountering resistance and pressure at the 106,000 level and is beginning to retreat. From the technical indicators, MACD is in a dead cross, and RSI is retreating after reaching the overbought area. There is no problem with the short-term bearish trend, and it is expected that it will be able to retreat to the 104,500 level without much problem. However, the recent decline in the gold market, DXY market, and crude oil market may cause funds to flow into the BTC market.
🏅 Trading strategies:
SELL 106000-105500
TP 105000-104500
BUY 140500-103500
TP 105000-106000
If you agree with this view, or have a better idea, please leave a message in the comment area. I look forward to hearing different voices.
Bitcoin are heading to 114k or 92k A quick little analysis on BTC, we can either push up higher to 114k levels breaking new highs is a must for price action to validate bill swing. However if we break a couple lows be prepared for 92k run down
Kris/ Mindbloome Exchange
Trade Smarter Live Better

NEW BTC HIGHS?BTC just broke a previous resistance zone. Previous data indicates a more upward push.
This may even lead to new highs.
Is Bitcoin Signaling Risk-Off? Structure Breakdown Explained💥 BTC/USD Outlook – Is Bitcoin Losing Steam? 🧠📉
I'm keeping a close watch on Bitcoin (BTC/USD) this week, and the current price action is flashing some key signals.
🔍 Over the past several sessions, BTC has struggled to hold momentum, and we’re now seeing a shift in tone. On the 4-hour timeframe, the market structure is tilting bearish, with a pattern of lower highs and lower lows developing — a classic sign of weakness ⚠️📉.
📐 The most recent downside leg has caused a clear break in structure, and BTC is now retracing back into a potential supply zone, hovering around equilibrium of the recent move. This zone will be critical to watch for signs of seller re-entry.
⏳ On the 30-minute chart, I’m waiting for a decisive shift in structure — a break of local support or a failed rally that confirms bearish continuation. Should that play out, it could signal a high-probability short setup.
🪙 A breakdown in BTC often has broader implications — especially in the risk asset space. If we see weakness here, JPY pairs may strengthen as capital rotates into safer assets 💴🌐.
⚠️ Disclaimer:
This is not financial advice. The information provided is for educational purposes only. Please conduct your own analysis and consult a licensed professional before making any investment decisions. 📚💼

BTC SHORT TP:97,500 23-06-2025We’re looking at a false bullish spike setup — that means it looks strong, but it’s all smoke.
Shorting between 102,500–103,600, targeting 97,000–97,800 with a solid 3.8 RR.
Timeframe: 4H.
Expected to play out in the next 24 to 30 hours, otherwise invalid.
There’s still a chance of manipulation to the upside, but we’re betting on rejection.
We don’t use indicators, we’re not out here drawing lines or cute little shapes — I just give you a clean trade.
Bitcoin / U.S. Dollar 4-Hour Chart (BTCUSD)4-hour candlestick chart displays the price movement of Bitcoin (BTC) against the U.S. Dollar (USD) as of June 23, 2025, 03:45 PM CEST. The chart shows a recent sharp decline from a peak of approximately 104,443.81 USD to around 100,479.47 USD, with a current price of 102,035.20 USD, reflecting a 1.037.09% increase. Key levels include resistance around 104,000 USD and support near 100,000 USD, with notable volatility indicated by the candlestick patterns and a marked low point adorned with U.S. flags and a lightning bolt symbol.

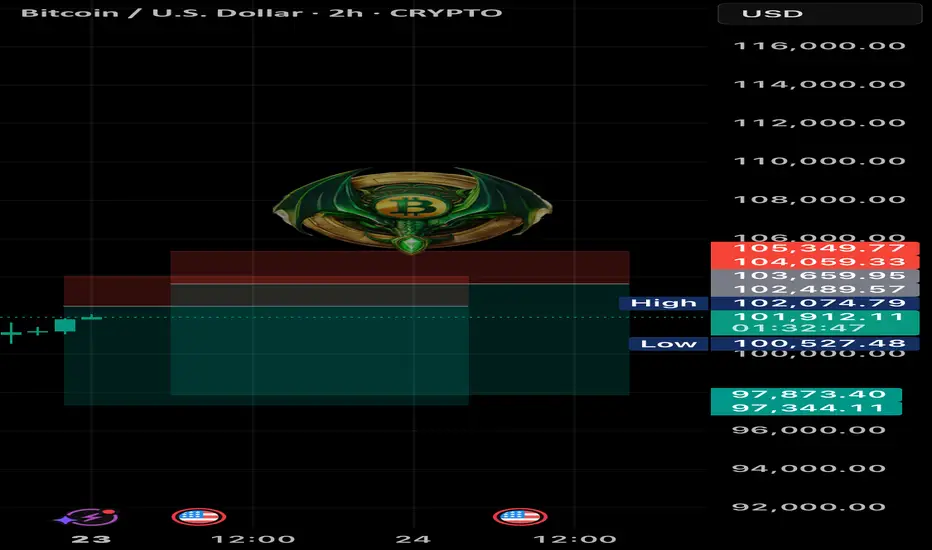
Bitcoin Price Analysis: Potential Rebound Ahead?4-hour Bitcoin price chart reveals a potential rebound opportunity. After a sharp decline, the price has stabilized around $97,245.43, forming a support level. The green and red box annotations suggest a possible price range breakout, with an upward arrow indicating a potential price increase. The current price stands at $100,461.58, down 1.63% from its recent peak. Will Bitcoin bounce back or continue its downward trend?

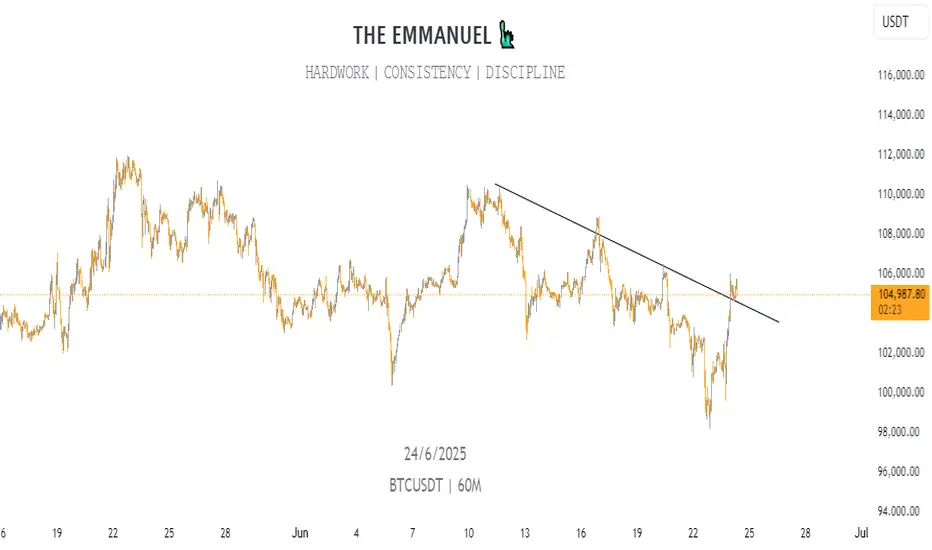
BTC is expected to continue its decline to 100,000BTC has encountered resistance and fallen back several times near 110,000, forming an absolute suppression in the short term. It is difficult for BTC to overcome this resistance area in the short term. As BTC has been unable to break through for a long time, some profit-taking and panic selling will cause BTC to gradually collapse. At present, BTC has fallen back to around 104,000. During the retracement, it has built a short-term resistance area of 105,500-106,000, which limits the rebound space in the short term and will further strengthen the bearish sentiment in the market. BTC will completely open up the downward space.
At present, the 103,000-102,500 area still has a certain support effect on BTC. As BTC shows a volatile downward trend, this support area will be broken again and continue to fall to the area near 100,000. Therefore, in short-term trading, we can consider shorting BTC in the 105,000-105,500 area.
BINANCE:BTCUSDT BITSTAMP:BTCUSD BINANCE:BTCUSDT COINBASE:BTCUSD
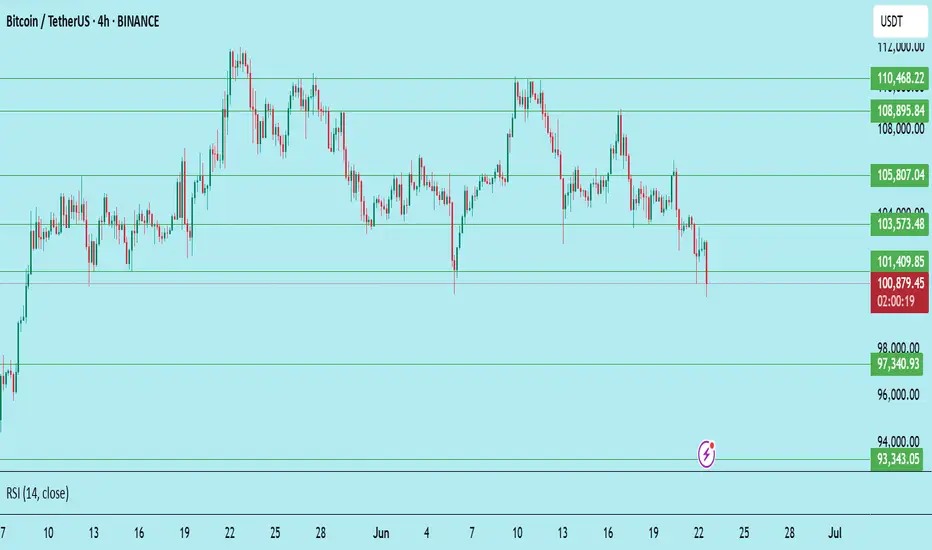
Bitcoin (BTC/USDT) – Bearish Continuation After Failed Support !Bitcoin attempted to hold the $101,409 support level but failed to sustain above it. The breakdown confirms weakness, and the chart now suggests a continuation of the downtrend if bulls don’t reclaim lost ground quickly.
Technical Breakdown:
Failed Bounce: BTC briefly bounced near $101.4K but got rejected and closed back below the zone.
Bearish Structure: Price continues forming lower highs and lower lows — a clear downtrend.
RSI at 30.34: Close to oversold but still room to fall, which means downside isn’t exhausted yet.
Market Sentiment: Weak hands are exiting, and support zones are getting tested faster than they’re defended.
Key Levels to Watch:
Resistance:
$101,409 – Immediate level, now flipped to resistance
$103,573 – Strong barrier if bulls attempt recovery
$105,807 – Major horizontal resistance and lower high zone
Support:
$97,340 – Next major support zone (possible short-term bounce)
$93,343 – Key level if $97.3K fails to hold
$92,200 – Final support before panic could set in
Trade Idea – Bearish Bias:
Short on Retest Zone: $101.4K – $102K
Stoploss: Above $103.6K
Take-Profit Targets:
TP1: $97,300
TP2: $93,300
TP3: Optional – trail lower if breakdown continues
What Bulls Need to Do:
Reclaim $101.4K fast with a strong close above it on the 4H chart
Otherwise, sellers remain in control
This is not financial advice. Always do your own research (DYOR) and manage your risk accordingly.
BTC pressure, price under a lot of selling pressure💎 Update Plan BTC weekend (June 22)
Notable news about BTC:
Market overview: Bitcoin's consolidation lasts in the context of increasing macro instability
US President Donald Trump expressed his caution on Thursday when he delayed the decision involving a potential direct attack on Iran for a maximum of two weeks. The global market, including cryptocurrencies, has reacted, slightly increased in Asian and European sessions when investors absorb the impact of crude oil prices in the context of interrupted transport routes.
However, traders are very cautious, reflecting the tough stance of Fed President Jerome Powell on the economy, with the reason for the expectation of inflation in the short term due to tariffs.
Bitcoin -large holders continue to accumulate despite the cautious attitudes of traders on the spot and derivative markets.
Technical analysis angle
Bitcoin price fluctuates around $ 104.057 after cutting up the day from the peak of $ 106,457 of Friday. Main technical indicators, such as relative power index (RSI), strengthen the trend of discounts when the price slip down the average line 50.
Money Flow Index (MFI) indicator, monitoring the amount of money poured into BTC, shortening the trend of increasing, stable around the middle line. This reflects the limited interest in Bitcoin on both spot markets and derivative markets.
If the weakness of the Organizing Committee overshadows the demand on the chain and network activity, supporting the exponent dynamic line (EMA) 50 days at $ 103,169 can be helpful, temporarily absorbing the pressure of selling. Overcoming this level, high fluctuations can accelerate the decline, bringing the main levels, such as EMA 100 days at $ 99,085 and EMA 200 days at $ 93,404, in.
==> Comments for trend reference. Wishing investors successfully trading
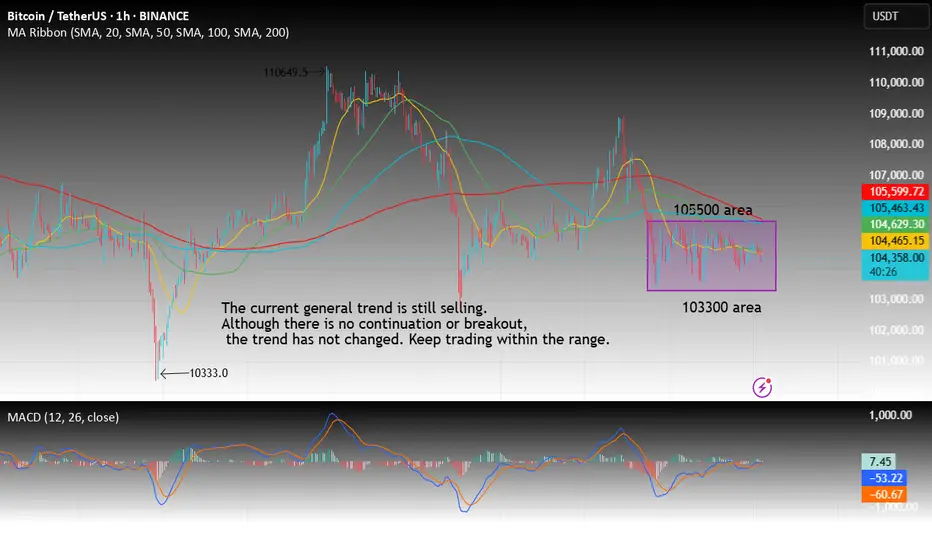
Btc seizes the opportunity to trade with the trendTechnical analysis of BTC contract on June 20:
Today, the large-cycle daily level closed with a small negative line yesterday, and the K-line pattern was a single positive line with a continuous negative line. The price was below the moving average, and the attached indicator was dead cross and running downward, but we should note that the overall volatility this week was not large, and the fluctuation was in a small range. So we should pay attention to keeping short-term trading and closing profits in time. Don't hesitate, drag, and don't think about a big rise or fall. After a large drop on Tuesday this week, the short-term hourly chart has entered a small range of fluctuations. There is no continuation or breakout, so we should just follow the trend. We have sold at the high point of 105,500 as a defense, and bought at 103,000 as a defense, for short-term trading.
continue to move accumulation: below 109,000💎 Update Plan BTC (June 20)
Notable news about BTC:
Semler Scientific (SMLR) unveiled an ambitious three-year strategy on Thursday aimed at significantly expanding its Bitcoin holdings to 105,000 BTC by the end of 2027. The announcement coincided with the appointment of a new executive to lead the firm’s digital asset initiative.
The Nasdaq-listed healthcare firm has named Joe Burnett as its Director of Bitcoin Strategy, a move it believes will strengthen its long-term treasury vision and enhance shareholder value. As part of this strategic shift, Semler Scientific plans to accumulate Bitcoin through a mix of equity and debt financing, alongside reinvested cash flows from its core business operations.
Technical analysis angle
BTC as well as XauUSD are trapped in the channel price 104k to 110k these are also two important milestones of BTC. Also congratulations to investors when detecting the bottom of 104k. The next expectation within the price channel is still maintained at 110k landmark
But with the recent moves of investors, the community is afraid that BTC will continue to adjust in the future.
==> Comments for trend reference. Wishing investors successfully trading
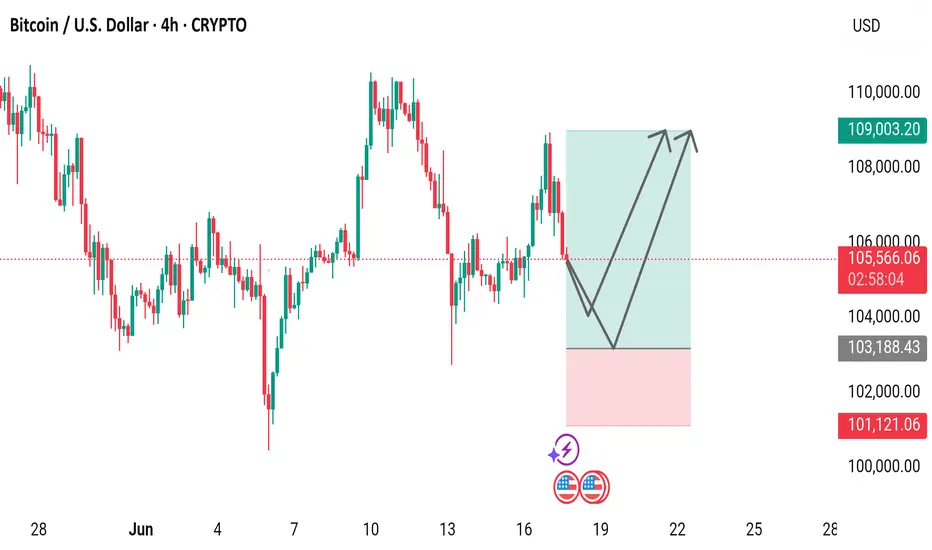
Bitcoin 4-Hour Price AnalysisA 4-hour candlestick chart of Bitcoin (BTC/USD) showing a recent price of $105,562.92 with a 1.17% drop. The chart includes a potential bullish pattern with resistance at $109,003.20 and support at $103,188.43, marked by technical indicators.
Bitcoin BTC price analysis🍿 At the OKX:BTCUSDT chart, we show one of the scenarios that could play out in the first half of June.
Much will be decided today with the opening of the US market. It is very likely that there will be a downward movement at the opening in response to the new tariffs announced by Trump on Friday after the markets closed.
🕯 Well, then we'll have to “keep our fingers crossed” that market players show their strength and hold on and buy back the drop — like say: we're tired of shaking with every crazy statement from Trump.
💰 If the price of CRYPTOCAP:BTC stays above $103k, there is a chance that it will be “stuck” in the $103-110k consolidation. The market needs to digest and redistribute the results of two months of #BTCUSD price growth from $75k to $112k.
And considering the position of the BTC.D and USDT.D indices, there is a chance that the “little bit” of capital will pass to the altcoins, and they will shoot up a little.
⁉️ Probably, the safest thing to do would be to watch the altcoins and buy only those that have started a significant upward movement with volume.
What do you think?
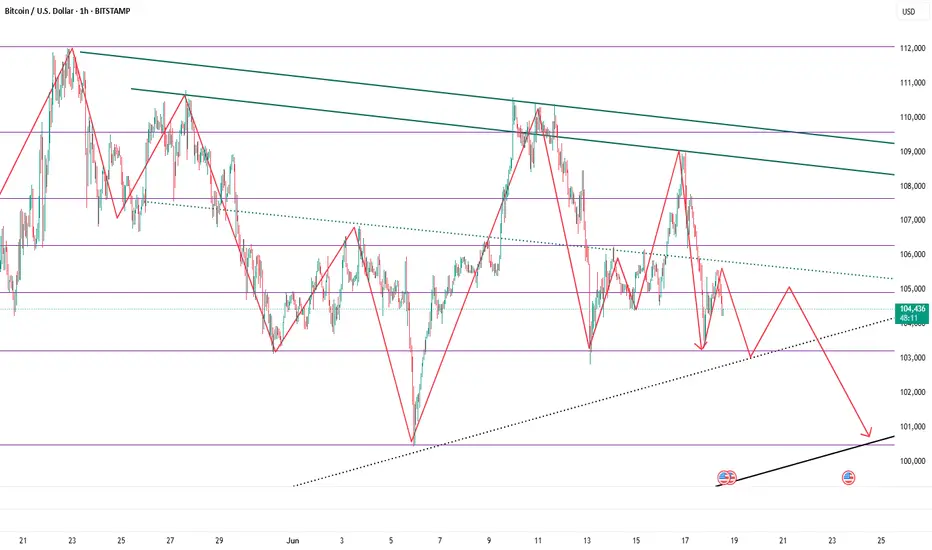
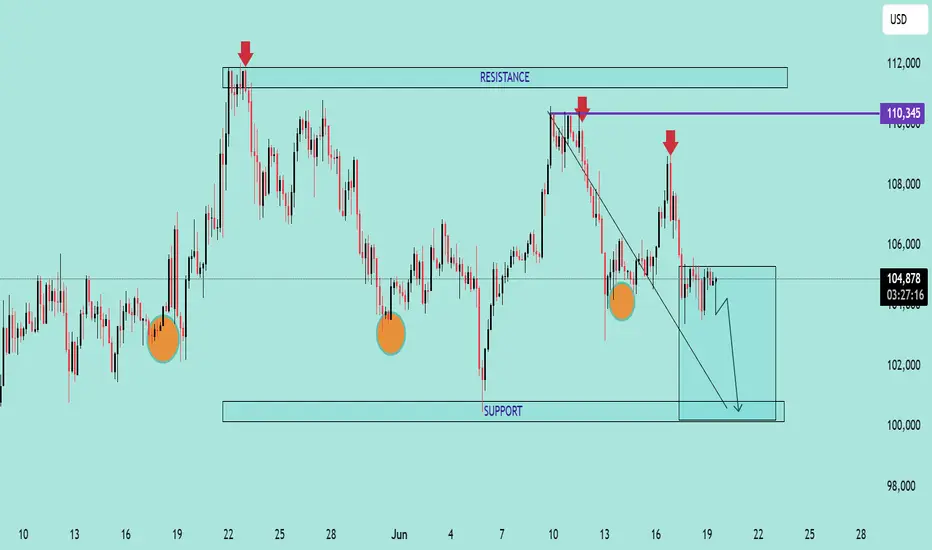
BTC/USD Bearish Outlook AnalysisBTC/USD Bearish Outlook Analysis 📉🧠
📊 Technical Overview:
The BTC/USD chart is showing signs of a bearish structure formation, suggesting increased downside momentum in the short term.
🔻 Resistance Zone:
Clear resistance is identified near $110,345, marked by multiple price rejections (🔴 red arrows).
Price failed to break above this zone several times, indicating strong selling pressure.
🔸 Support Zone:
Strong support lies near the $100,000 psychological level.
Price has respected this zone multiple times (🟠 orange circles), indicating buyer interest.
📉 Current Price Action:
A descending trendline breakout attempt failed and price is now consolidating just below $105,000.
Price is forming a bearish flag/consolidation structure after recent rejection.
A breakdown from the current box range is likely to push BTC toward the support zone at $100,000.
📉 Bearish Scenario:
If BTC breaks below $104,000, expect continuation towards $100,000.
A daily candle close below support could signal further downside.
📈 Invalidation:
Bullish invalidation occurs if BTC reclaims and closes above $108,000, with volume, retesting resistance at $110,345.
🧭 Summary:
BTC/USD is exhibiting a lower highs structure within a descending channel. Unless it breaks above the resistance zone, the bias remains bearish with a high probability of retesting support.
BTC/USDT Long Trade Setup – 1H Chart AnalysisBTC/USDT Long Trade Setup – 1H Chart Analysis
BINANCE:BTCUSDT
Hello traders! Sharing a recent long entry I took on Bitcoin (BTC/USDT) based on price action and liquidity concepts. This trade is taken on the 1-hour timeframe and aligns with my strategy of combining liquidity sweeps, support zones, and market structure shifts.
---
🔍 Trade Overview:
Entry Price: 104,704 USDT
Stop Loss: 103,660 USDT
Take Profit (Target): 108,349 USDT
Risk-to-Reward Ratio (RRR): Approximately 1:3
---
🧠 Trade Idea Behind the Entry:
As you can see on the chart, BTC had been in a downtrend and recently made a strong move into a key liquidity zone. This zone had previously seen multiple touches and rejections, making it an area of interest for both buyers and sellers.
The price swept liquidity below the previous low (labelled as “Liquidity Sweep $$$”), grabbing stop losses of early buyers and triggering limit orders of smart money. This move into the liquidity zone was followed by a strong bullish reaction – a signal that buyers may be stepping in.
Additionally, the "Break of Structure" (BOS) confirms a potential shift in market direction. The reaction from the liquidity zone indicates that this level is holding as new support.
---
🛠️ Why I Took the Trade:
1. Liquidity Sweep: The wick that pierced the liquidity zone signals stop-hunting and accumulation. These moves often precede a strong reversal.
2. Demand Zone Reaction: After the sweep, the candle closed bullish inside the demand box. This shows buyer strength.
3. Risk Management: The stop loss is set just below the liquidity zone to protect from deeper sweeps while keeping the RR healthy.
4. High Probability Target: The target is placed near the next resistance level around 108,349, which also aligns with a clean imbalance that price may want to fill.
---
📊 Technical Confidence:
Confluence Factors:
✅ Liquidity sweep
✅ Demand zone reaction
✅ Market structure shift
✅ High RR
✅ No immediate resistance till target
This type of setup reflects smart money behavior – first pushing price below structure to grab liquidity and then reversing sharply. The bullish momentum after the sweep gave extra confirmation.
---
🧭 What I’m Watching Now:
I will continue monitoring how price reacts around the 105,500–106,000 range. If momentum continues with higher highs and higher lows, I may trail my stop loss to lock in profits.
---
Let me know what you think of this setup! Have you taken a similar trade or are you waiting for confirmation? Drop your thoughts or charts below 👇
Stay disciplined, manage your risk, and trust the process. 🚀
#Bitcoin #BTCUSD #PriceAction #LiquiditySweep #SmartMoney #CryptoTrading #TradingSetup #TechnicalAnalysis #TradeJournal

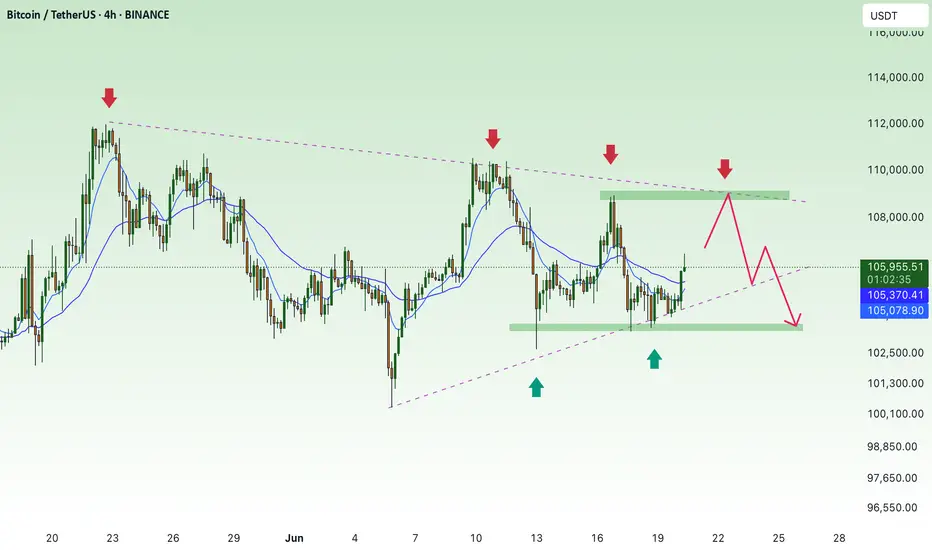
BTC-----Sell around 105500, target 104000 areaTechnical analysis of BTC contract on June 17:
Today, the large-cycle daily level closed with a small positive line yesterday, and the K-line pattern was a single positive line with continuous negative lines. The price was consolidating at a high level, but the attached indicator was dead cross, and the closing line yesterday was a long upper lead, and the high point was near the 109,000 area. Why is it difficult to continue the rise? The price did not break the previous high point, the continuity was poor, the technical indicators were not obvious, etc., which are all reference data; the short-cycle hourly chart showed that the European session rose yesterday, and the US session continued to break the weekend correction high position. The price fell under pressure, the intraday high was 109,000 area, and the intraday retracement low was 106,000 area. There is no obvious direction at present, so the European and American sessions are the focus, so pay attention to the strength and weakness of the European and American sessions and the breakout situation, and then we will layout according to the real-time trend. The European and American sessions are currently showing a downward trend.
Today's BTC short-term trading contract strategy:
The current price is 105,500 and directly short, stop loss in the 106,000 area; the target is the 104,000 area;