BTC:LIVE TRADEHello friends🙌
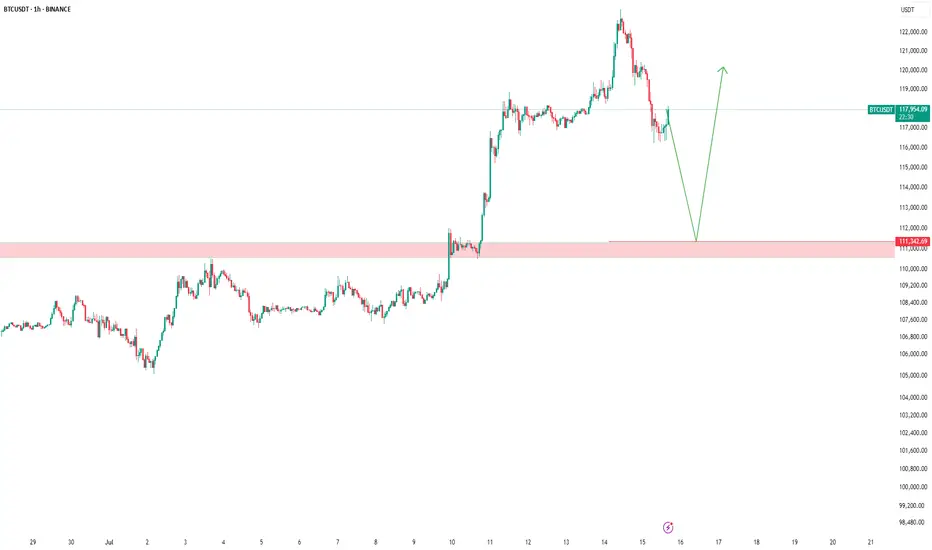
📉Given the decline we had, we now had a good price rebound in the specified support area, which shows the power of buyers. Now, with capital and risk management, we can buy at the specified points in a stepwise manner and move to the specified targets.
🔥Follow us for more signals🔥
*Trade safely with us*
Btctrading

Reversal from Channel Bottom or a Real Breakdown? Identifying th
🎯 BTCUSDT - Analysis
🔹 Analysis Date: 1 August 2025
📉BTCUSDT:
Price is currently moving inside an ascending channel and has touched the bottom of the channel again, offering a potential buy opportunity.
However, for those seeking a low-risk entry, the zone around 118,000 could be ideal—if price returns to the channel and confirms support.
Although it seems the channel’s lower boundary might break, this could be a fake break to mislead traders before a rebound.
The support at 110,000 is a crucial short-term level; if it fails, a deeper correction toward 98,090 or even 94,000 is likely.
Our targets remain at the upper boundary of the channel.
⚠️ Risk Management Tip: Wait for confirmation near 118,000 if unsure, and always size positions based on overall volatility.

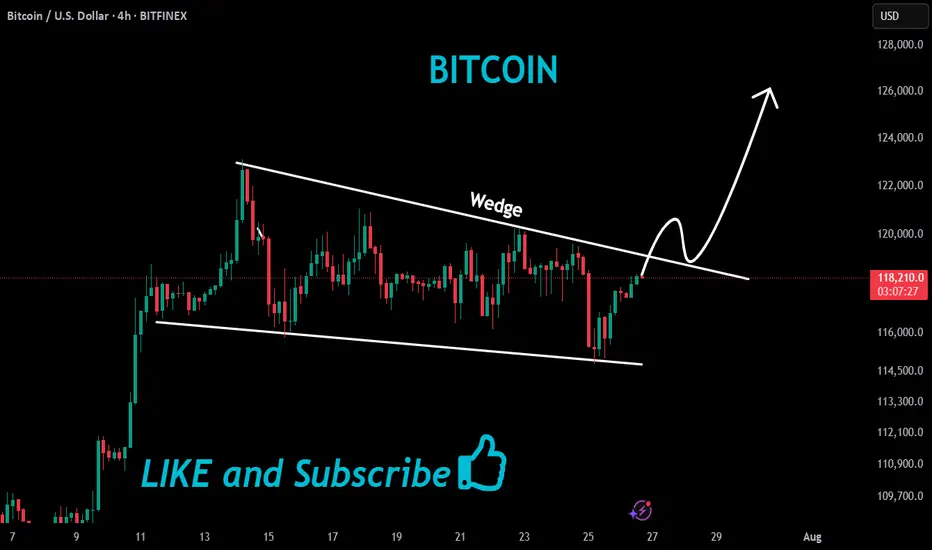
BITCOIN Wait For Breakout!
HI,Traders !
#BITCOIN has formed a Bullish Wedge pattern
While trading in an uptrend As
we mentioned in a previous analysis
So we are bullish biased and
IF we see a bullish breakout
We will be expecting a
Further bullish move up !
Comment and subscribe to help us grow !
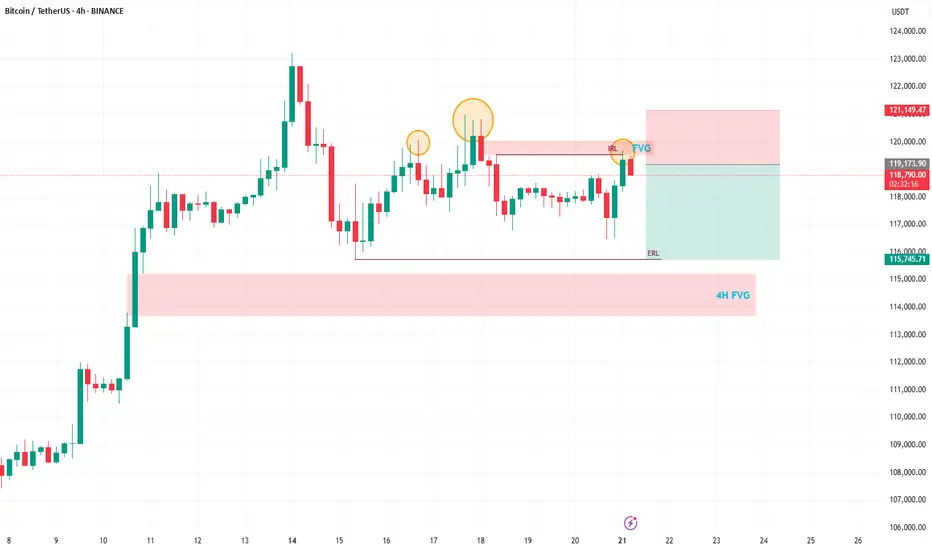
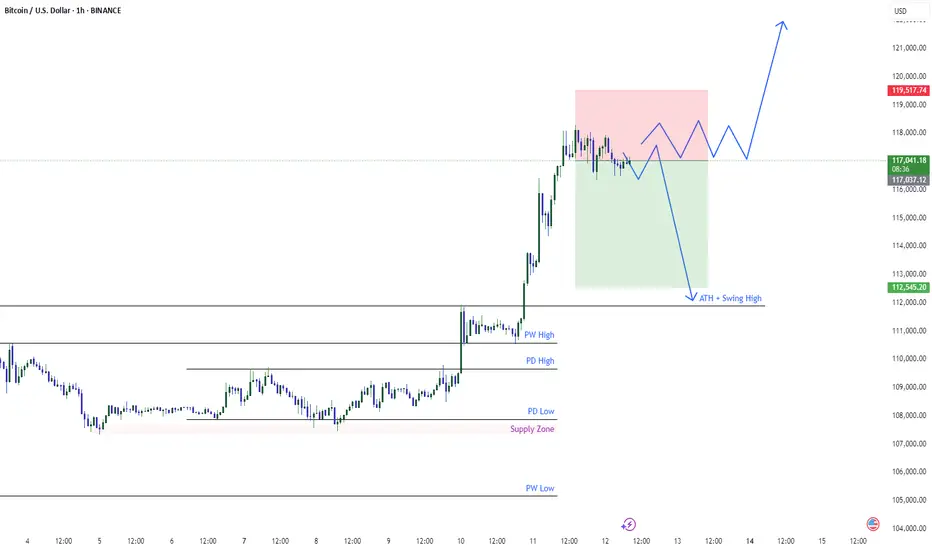
Bitcoin Trading Update: Consolidation, Patterns, and What's NextHey Fellow Traders! 👋
Bitcoin (BTC) has been on a wild ride after hitting its all-time high (ATH)! 📈 Since then, it’s been consolidating, generating liquidity, and setting the stage for the next big move. Meanwhile, altcoins are absolutely booming, stealing the spotlight! 💥 As we kick off the week, let’s dive into what’s happening with BTC and what to watch for.
📊 Technical Analysis Breakdown
Here’s what I’m seeing on the charts:
Head and Shoulders Pattern: A clear head and shoulders has formed on BTC, signaling a potential bearish move. 🐻
Daily Timeframe Order Blocks: These are in play, showing key levels of support and resistance.
Filled Fair Value Gap (FVG): A recent FVG on the daily chart has been filled, but there’s still a beautiful 4H FVG waiting to be tested below.
Liquidity Sweep: After the ATH, BTC needs to clear the liquidity from the past few days before it can push for new highs.
🔍 What’s Next for BTC?
I’m expecting a bearish reaction in the near term, with BTC targeting the sell-side liquidity around $115,800. This move should also fill the 4H FVG, setting the stage for a potential bounce and another shot at the ATH. 🚪 Keep an eye on these levels, as they’ll be critical for the next big move!
🔔 Stay in the Loop!
Let’s keep the conversation going! 💬 Follow for more updates, like if you found this helpful, and drop a comment with your thoughts or what you’re seeing in the markets. Are you trading BTC or riding the altcoin wave? Let’s hear it! 👇
Happy trading, and let’s make this week count! 💪
#Crypto #Bitcoin #Trading #TechnicalAnalysis
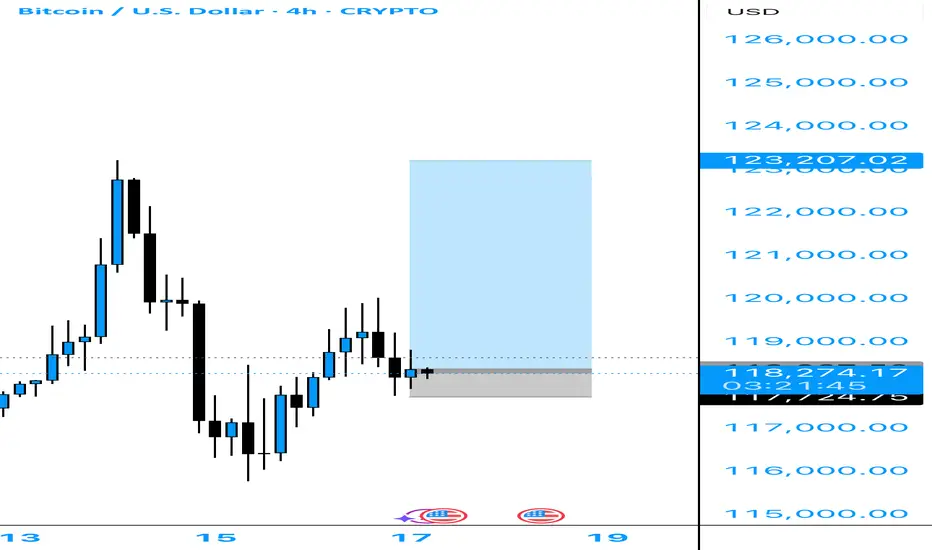
BTCUSD Technical Analysis | Smart Money Concept (SMC) BreakdownBTCUSD Technical Analysis | Smart Money Concept (SMC) Breakdown
🧠 Smart Money Market Structure Insight
📌 Key Elements Identified:
BOS (Break of Structure): Multiple BOS points indicate bullish intent early on. However, the latest BOS on July 14 followed by a significant drop signals a shift in momentum—possibly a distribution phase.
Liquidity Sweep: Price swept prior equal lows/liquidity before reversing, a typical Smart Money trap setup.
FVG (Fair Value Gap) / Imbalance: Identified around the mid-section of the chart—price filled partially but failed to hold, suggesting internal weakness.
Strong Support Zone (Demand Area): Marked between 115,000 - 114,640; this zone is anticipated to act as a springboard for bullish reversal.
📉 Current Price Action Observation:
BTCUSD is hovering around 118,152 - 118,560, moving sideways with lower highs indicating compression.
Price is projected to form a "W" pattern or double bottom in the shaded region.
Expected liquidity grab beneath 115,902 followed by potential bullish reaction targeting 121,562, as indicated by the white arrow.
🧩 Strategic Outlook & Potential Play:
🔻 Bearish Sweep First:
Market likely to sweep the support one more time, tapping into deeper liquidity pools between 115,000–114,640.
This is aligned with the concept of Smart Money hunting for retail stop-losses before reversing.
🔼 Bullish Recovery After Sweep:
Strong probability of bounce due to presence of:
Fair Value Gap (already tested),
Fresh demand zone,
Liquidity grab setup.
Projected Bullish Target: 121,562
Confirmation Needed: A strong bullish engulfing or BOS on lower timeframes near support.
🏷️ Conclusion:
This BTCUSD setup is a textbook Smart Money scenario: BOS ➝ Liquidity Grab ➝ FVG ➝ Reversal from Demand. Traders should wait for confirmation from the support region before entering long positions.

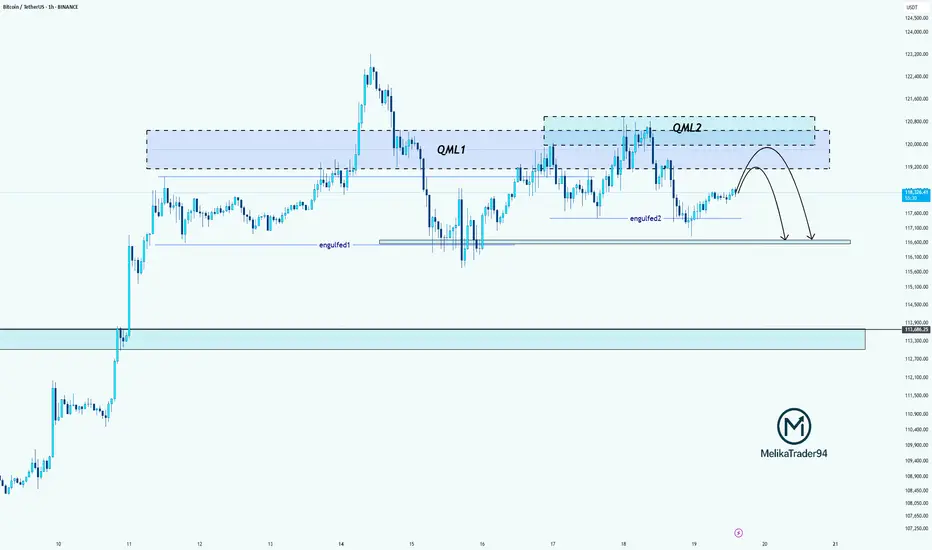
BTC Double QML Setup: Is Another Drop Loading?Hello guys!
Do you remember the last analysis?
Now this BTC chart shows a textbook example of two consecutive QML (Quasimodo Level) patterns forming (QML1 and QML2), each confirmed by clean engulfed lows.
QML1 caused a strong drop after the high was broken and a new low formed.
Price retraced and created QML2, again with a confirmed engulfed low (engulfed2).
We're now likely to see a reaction at the QML2 supply zone.
If price respects this second QML zone, we could see another bearish move toward the 116k zone, possibly lower.
LAST BTC PUSH? Dear Community,
in order to expand my skills analysis, I will regularly share my analyses and ideas here on TradingView. I still consider myself a beginner in the “stock market” and “crypto” area and am therefore very much looking forward to your comments and input!
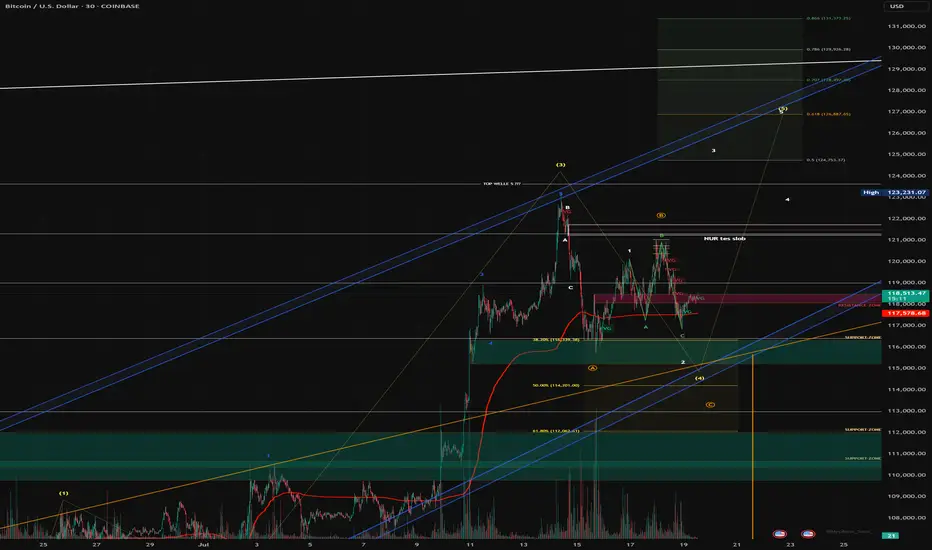
My primary assumption is that we are still in a final upward move. However, I am also pursuing alternative scenarios that could lead to significantly higher levels.
BTC analysis - 1H chart
In my analysis, wave (3) in yellow is complete and we are currently in wave (4) correction, which may not be complete yet.
My guess:
- Wave B (yellow) has been completed, wave C has extended and could still reach USD 113 679, where the Fibonacci 100 level is located. There is also an FVG in the 1H chart.
- A retest of the blue trend channel would be quite possible in order to pick up liquidity at this level before wave 5 (yellow) is completed between USD 126,887 and USD 130,000.
- My risk management is down to USD 107,326 (Fibonacci 1.866).
- We have already tested the Fibonacci 0.5 level (pullback level) and seen a positive reaction. However, we currently lack volume in the market.
- If the blue channel and the Fibonacci 100% level break, I have to assume an alternative count.
In this case, wave 4 would still have scope to reach the Fibonacci 61.8% level in the yellow box at USD 112,062.
If my current forecast does not materialize, I assume that we have already completed wave A and are in the correction to wave B, which will be followed by wave C - with a target of around USD 130,000 for the final impulse.
This scenario also fits in well with risk management up to the Fibonacci level of 1.866. There are also high liquidity areas (long) at this level, which are very attractive for market makers.
What do you think?
Bitcoin Day Trade Signsl To Buy NowIf this trade plays out I will make 7x my risk!
Subscribe to my YT channel at DNiceFx to watch me trade live!!
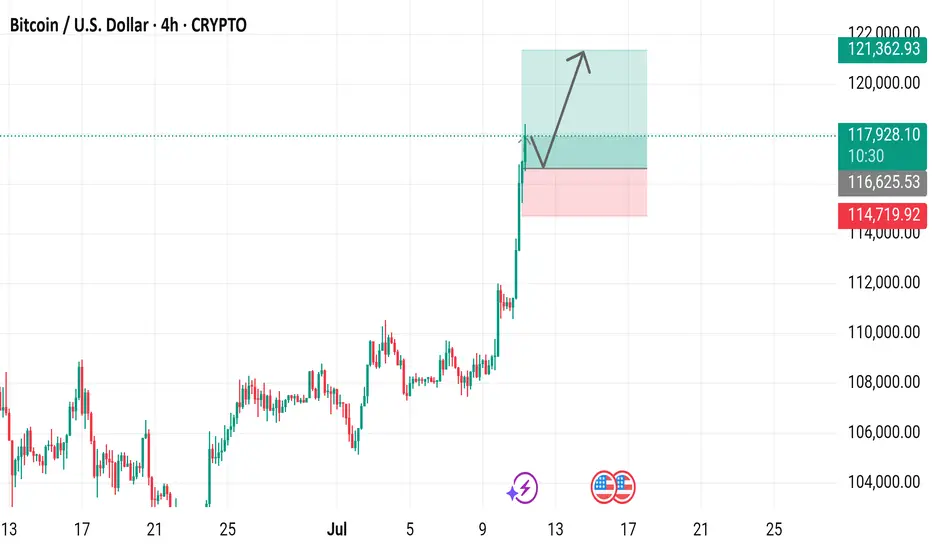
Bitcoin / U.S. Dollar 4-Hour Chart (BTCUSD)4-hour chart displays the recent price movement of Bitcoin (BTC) against the U.S. Dollar (USD) as of July 11, 2025. The current price is $117,979.53, reflecting a 4-hour increase of $1,938.91 (+1.67%). The chart highlights a significant upward trend, with a notable breakout above the $114,719.92 resistance level, reaching up to $121,362.93. Key price levels include support at $116,625.93 and resistance at $121,362.93, with buy and sell options marked at the current price.
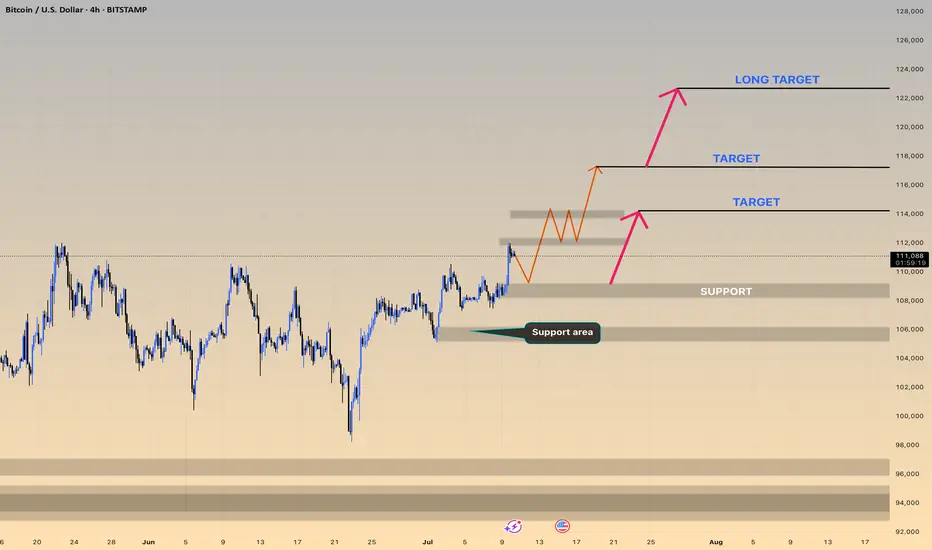
BTC Analysis — Long-Term Buy Zone AheadI'm watching $111,000 as a major buy zone on Bitcoin.
If price retraces to that level, I’ll be ready to enter a long position.
This is not a prediction — it’s a scenario.
Smart traders don’t guess, they prepare.
Let price come to your level. No chasing.
📍Set your alerts and stay patient.
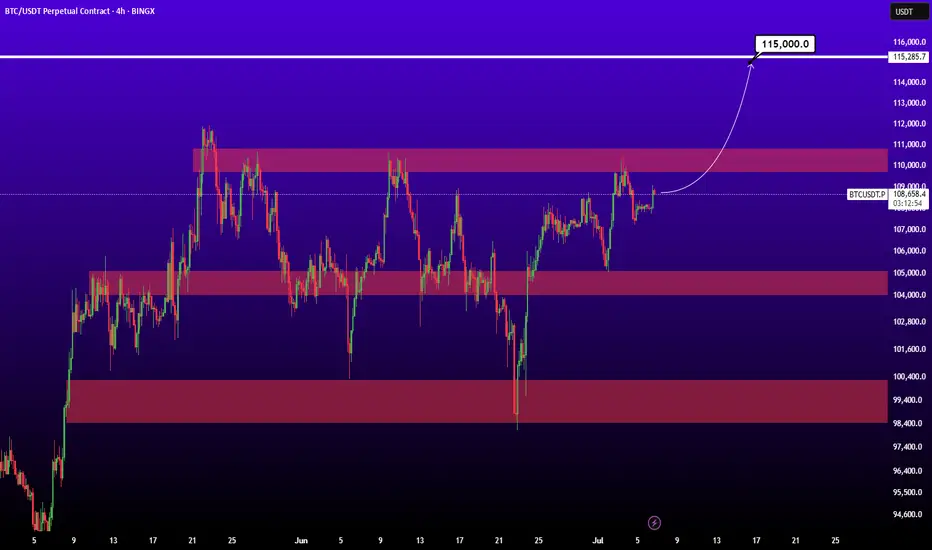
BTCUSDTWait for breaked ATH for 115K target.
BINANCE:BTCUSDT.P
Now price is in two level trading renge but come entry volume of buyers.
BTC Touching Heights !BTC Extremely bullish. BTC analysis shows that it touch supply zone of 107500 and later went to cross the day before previous day high which was residing on 109,684 and then swept previous week high which was 110,600 with strong buying. It hinted crossing the all time high. After crossing all time high of 111,900 gave a change of around 6000 dollars , At this position the BTC outlook shows it may show reversal of around 4K dollars change. The possibilities for the BTC are shown here. Take risk accordingly.
Disclaimer : It isn't a financial advice check my analysis and decide on your own.
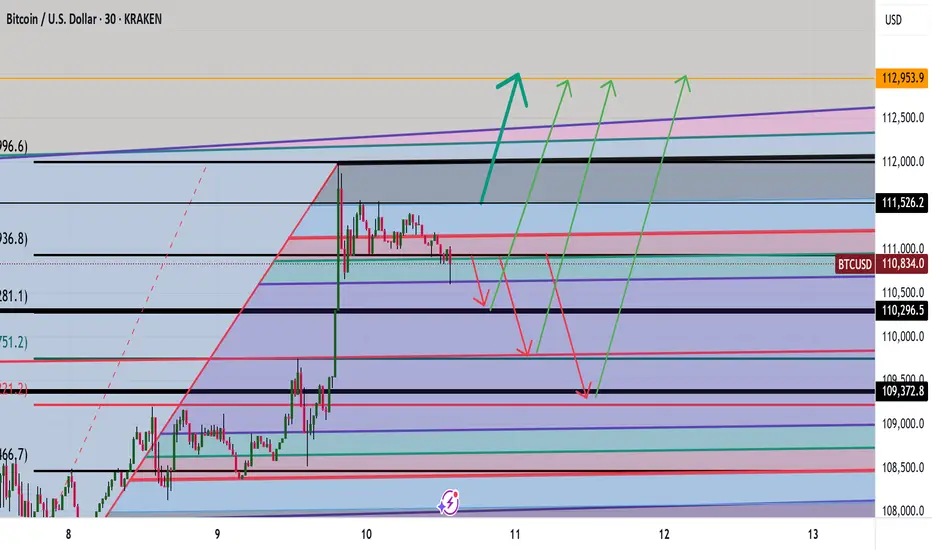
BTC Analysis TO 112,981 LEVELS AND BEYOND ? Good morning folks
BTC analysis with a little correction down to 110,300- 109,300 levels then a drive up to 112-113K levels
Let me know what you think
Kris/Mindbloome Exchange
Trade Smarter Live Better
BTCUSD BULLISH MORE all time high again The price may briefly break above the 113,000–114,000 level (first target) to trap long positions, then sharply reverse.
Support Break Warning:
If BTC fails to hold the 110,000–108,000 support zone, it could accelerate a drop to deeper supports:
Support Area 1: 106,000
Support Area 2: 102,000
Extreme Bearish Target: 96,000–94,000
What to Watch:
Bearish divergence on lower timeframes
Volume drop on new highs = possible fakeout
Candle rejection from 113,000–114,000 zone
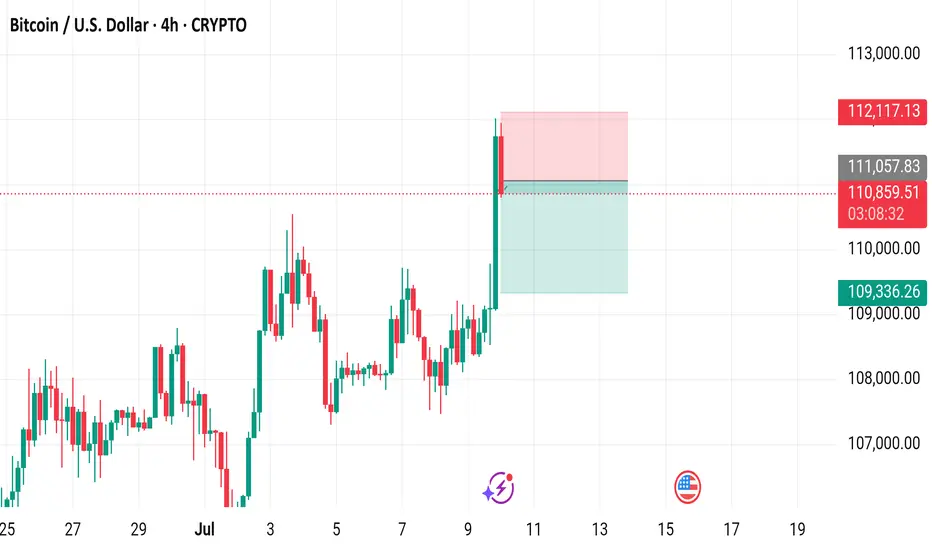
Bitcoin / U.S. Dollar 4-Hour Chart - CRYPTO4-hour candlestick chart displays the price movement of Bitcoin (BTC) against the U.S. Dollar (USD) from late June to mid-July 2025. The current price is $110,838.12, reflecting a 1.75% increase (+$1,908.56). The chart highlights a recent significant upward movement, with a notable green candlestick indicating a strong buying trend. Key price levels include a support zone around $109,336.26 and resistance near $112,117.13. The chart also shows buy and sell options at the current price level of $110,838.11.
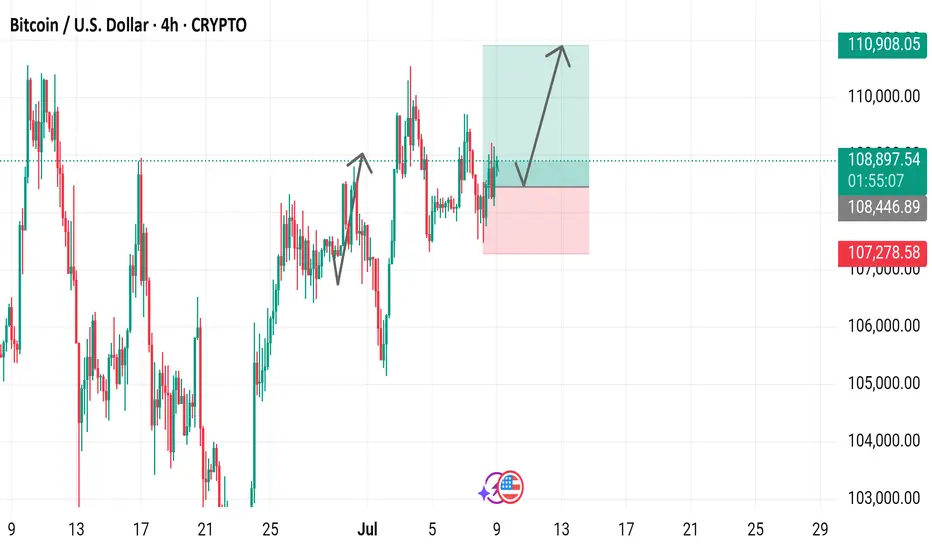
Bitcoin / U.S. Dollar 4-Hour Chart (BTCUSD)4-hour candlestick chart displays the price movement of Bitcoin (BTC) against the U.S. Dollar (USD) from late June to early July 2025. The current price is $108,895.04, with a 24-hour change of +$619.70 (+0.57%). Key levels include a support zone around $107,278.58 and a resistance near $110,908.05. The chart highlights recent price action, including a potential upward trend indicated by a green shaded area, with buy and sell signals marked at $108,895.04.
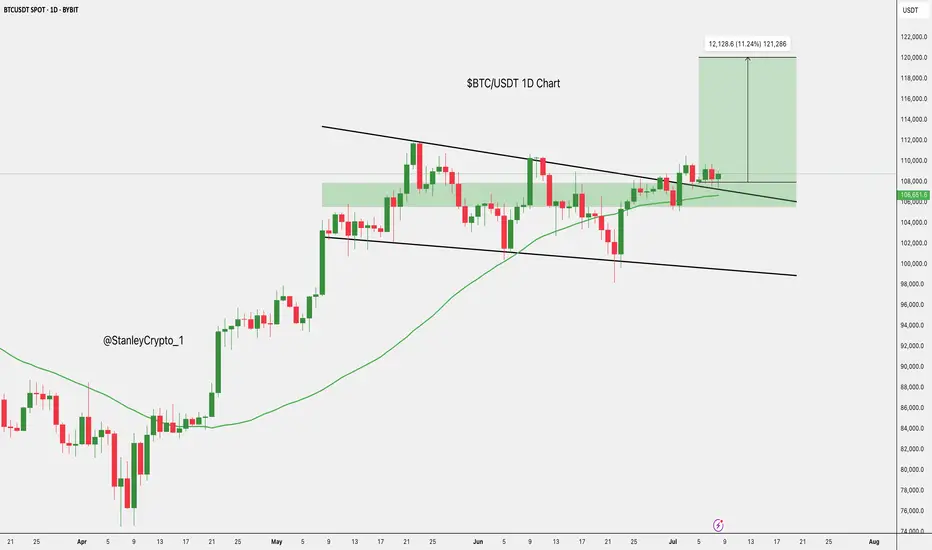
$BTC/USDT Eyes $121KCRYPTOCAP:BTC has broken out of the descending wedge and is holding above key support around $106K.
The structure looks bullish with a potential move toward $121K (+11.24%).
As long as the price stays above the breakout zone, momentum favors the bulls.
DYOR, NFA
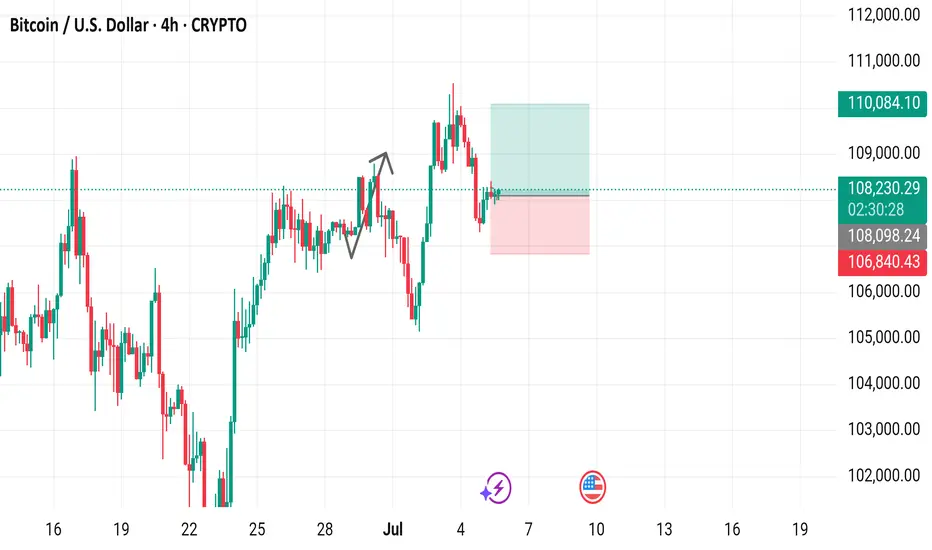
Bitcoin / U.S. Dollar 4-Hour Chart - CRYPTO4-hour candlestick chart displays the Bitcoin (BTC) to U.S. Dollar (USD) price movement, currently at $108,252.17 with a 0.21% increase (+$230.82). The chart highlights a recent upward trend with key price levels marked, including a buy price of $108,252.17 and a sell price at the same level. Support and resistance zones are indicated with a pink shaded area around $106,840.43 to $108,252.17 and a green shaded area near $110,084.10. The chart spans from late June to July 7, 2025, with the latest data point at 06:27 PM PKT on July 5, 2025.
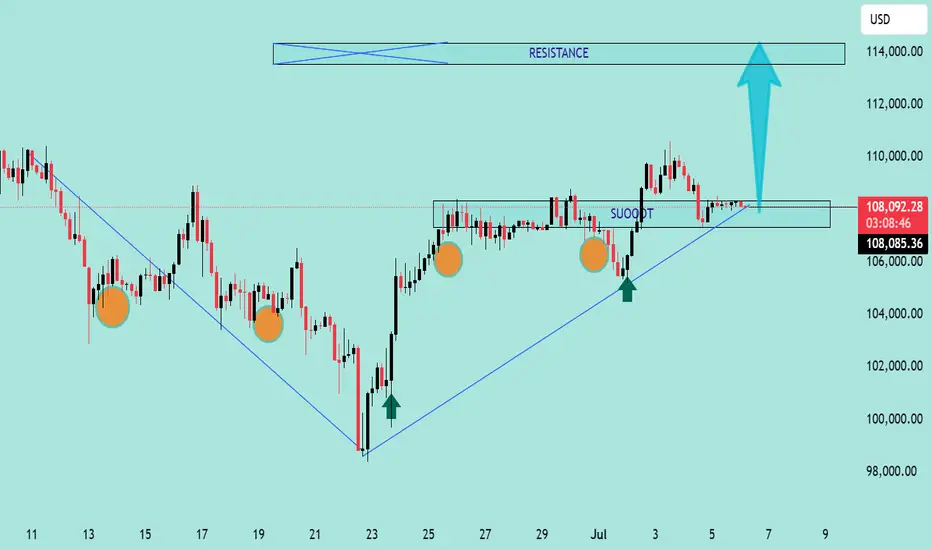
BTC/USD Bullish Reversal Breakout Pattern BTC/USD Bullish Reversal Breakout Pattern 🚀
Technical Analysis:
🔹 Trend Reversal: The chart shows a clear inverse head and shoulders pattern highlighted with orange circles — a strong bullish reversal signal after a downtrend.
🔹 Breakout Zone: The neckline resistance around 108,000 USD has turned into support (marked as “SU00QT” due to a typo, assumed to be “SUPPORT”). Price action is consolidating just above this zone.
🔹 Trendline Support: The upward blue trendline confirms bullish structure, with price forming higher lows. Recent price action is bouncing off this trendline, showing strength.
🔹 Bullish Confirmation: Green arrows indicate strong bullish rejections from key levels, aligning with breakout retests.
🔹 Target Projection: The measured move from the inverse head and shoulders pattern projects a target towards the 114,000 USD resistance zone 📦 highlighted above, suggesting a potential 5-6% upside move 📊.
Conclusion: As long as price holds above the 108,000 support zone and the ascending trendline, BTC/USD remains bullish with potential continuation towards 114,000 USD. A breakout above minor consolidation could trigger a strong bullish rally 💥.
🛑 Invalidation: A sustained break below 106,000 USD would invalidate the bullish structure and may lead to further downside.
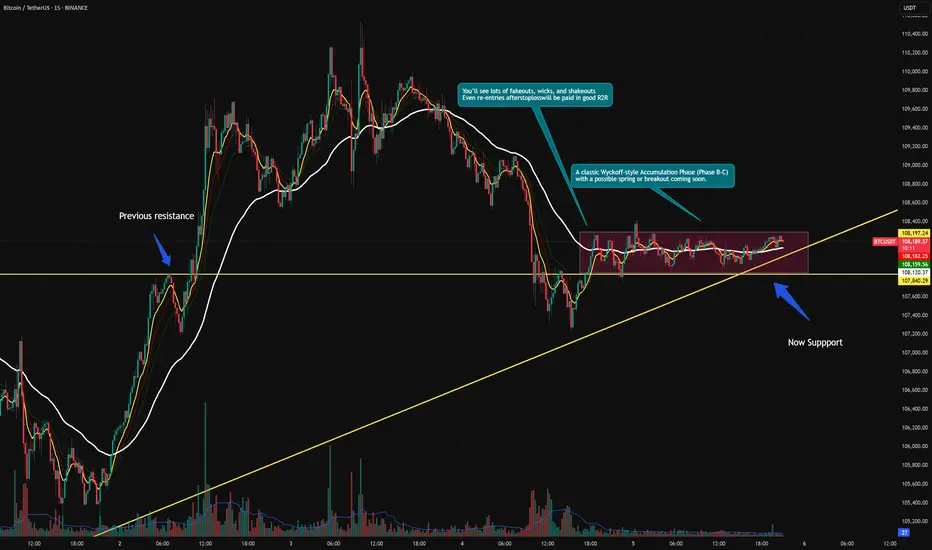
BTCUSDT – Accumulation Confirmed? Wyckoff Blueprint Playing Out Bitcoin continues to compress inside a defined range, resting above both a rising trendline and a former resistance turned support zone. This structure fits cleanly within a Wyckoff-style Accumulation Phase (B-C).
We’re now at a critical moment where smart money may be absorbing supply, preparing for the next phase.
🔍 Key Observations:
Range-bound price action with higher lows and muted volume
Spring-like wick and recovery from the bottom of the range
Support holding at prior breakout zone and ascending trendline
Structure shows signs of stealth accumulation with a possible breakout ahead
Sideways movement with fading volatility
Gradual compression within the range
Strong support defended multiple times (might make the support weaker as well !)
A potential spring/retest event may already be in play
You’ll see fakeouts, wicks, and hesitation in this phase — designed to trap weak hands. But the underlying behavior points to preparation, not distribution.
The quiet before the markup. Let the market reveal its hand. 📈
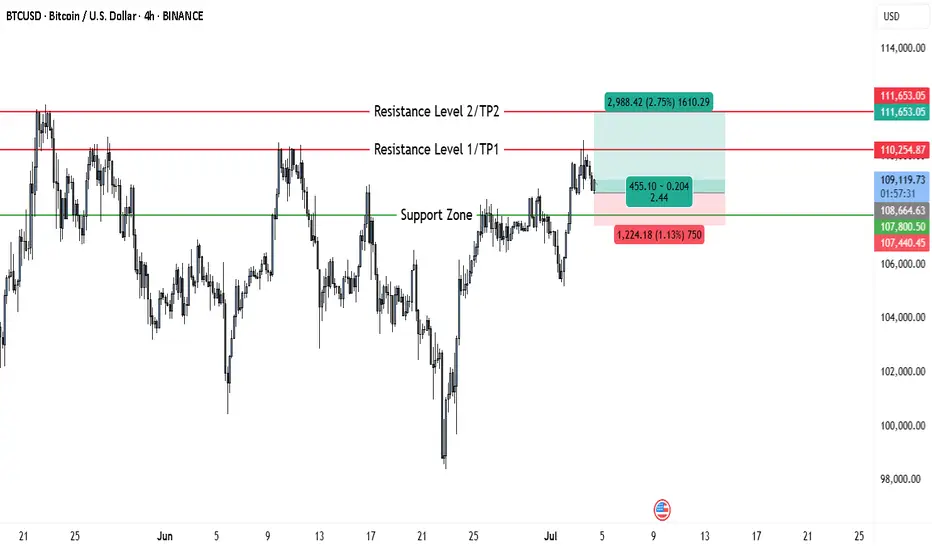
BTC Bulls Target $111,653, Is This the Next Explosive BreakoutThe BTCUSDT 4-hour chart is showing a clearly bullish structure. After consolidating below the $108,664–$107,800 resistance for several weeks, Bitcoin finally broke above this area with a strong impulsive move, confirming the zone as a new support. This breakout coincides with improving market sentiment, especially after Metaplanet’s $108 million purchase of BTC and a surge in ETF inflows, which have been helping Bitcoin reclaim levels above $109,000. The price is currently consolidating just above the breakout area, indicating that buyers are defending this zone aggressively.
Resistance Level 1, around $110,254, is the first significant barrier and aligns with the area that rejected price several times in late May. If this level is broken, the next target sits at Resistance Level 2 near $111,653, which was the major swing high established in early May. Holding above the current support is critical, as a decisive 4-hour close below $107,440 would invalidate this bullish scenario and likely trigger a deeper retracement.
The recent price behavior suggests a potential ascending triangle breakout retest, a classic continuation pattern where buyers step in on each dip. Momentum remains strong, and the risk/reward profile favors long setups as long as the higher-low structure is preserved.
Trade Setup (Bullish Idea)
Entry Zone: $108,700–$109,000 (on a confirmed retest of support)
Stop Loss: $107,440 (beneath the invalidation zone)
Take Profit Targets
o TP1: $110,254
o TP2: $111,653
The setup offers an estimated 2.4–2.7 risk/reward ratio, depending on precise entry and execution. As always, it’s recommended to wait for confirmation candles or wicks rejecting the support zone before entering.
If the breakout holds and volume expands on the push through TP1, Bitcoin could quickly revisit the $112,000 area in line with broader market optimism and institutional buying. Just be aware of the invalidation level, as any breakdown below $107,440 could trigger a fast move back to prior range lows.
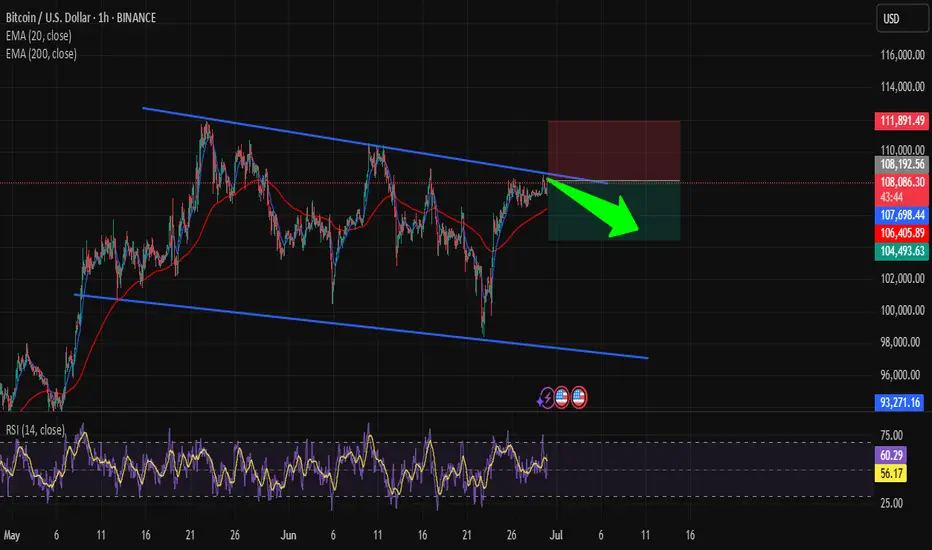
BTC at Critical Resistance… Drop Incoming!Hi traders! Currently analyzing BTCUSD on the 1H timeframe.
Price is reacting to the upper boundary of a descending channel, where sellers are showing strong pressure. This area has previously acted as a significant resistance, pushing price lower multiple times.
I'm now selling from 108,075.19, expecting a bearish move towards my target at the bottom of the channel.
Take Profit: 104,493.63
Stop Loss: 111,891.49
RSI is showing signs of bearish divergence near the resistance area, adding confluence to this setup.
Price may have performed a liquidity grab above the trendline before rejecting the area, which aligns with the current market structure.
I'm actively managing this trade, keeping an eye on how price behaves around this key level.
Disclaimer: This is not financial advice. This is my personal analysis shared for educational purposes only.
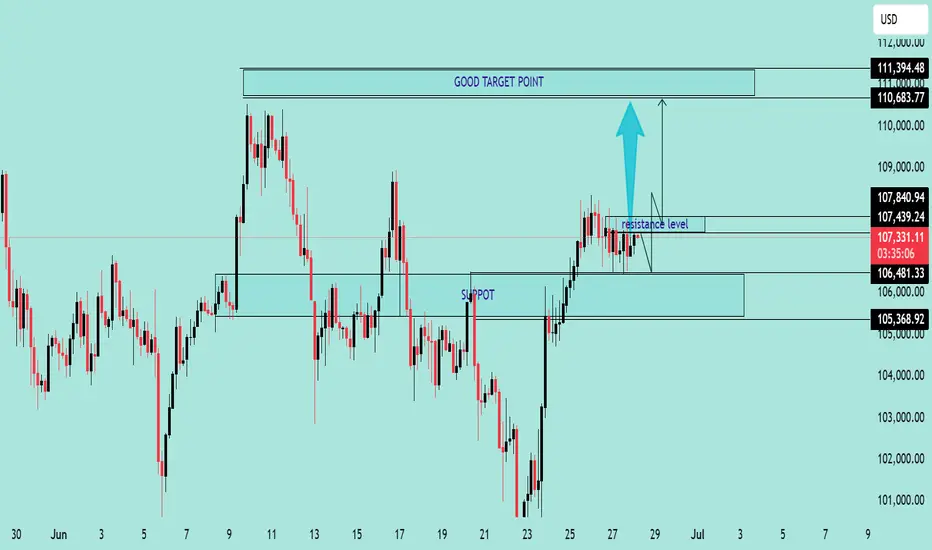
BTC/USD Consolidation Breakout Setup Chart Overview:
The BTC/USD chart shows a strong bullish impulse followed by a consolidation phase just below a key resistance level, suggesting a potential bullish continuation.
🔹 Key Technical Zones:
📍 Support Zone:
105,368 – 106,481 USD
This area acted as a strong demand zone where price reversed aggressively.
📍 Resistance Level:
107,439 – 107,840 USD
Price is currently consolidating just below this resistance, indicating a buildup for a breakout.
🎯 Target Zone:
110,683 – 111,394 USD
A clean breakout above resistance could push price into this target area.
🔹 Technical Signals:
✅ Bullish Flag Formation:
After a strong impulse move, BTC is forming a sideways range, indicating bullish accumulation.
⬆️ Breakout Potential:
A confirmed breakout and retest above 107,840 could validate a move toward the 111K region.
⚠️ Invalidation Point:
A drop below 106,481 would invalidate the bullish bias and may trigger a deeper pullback.
📌 Conclusion:
As long as BTC holds above the 106,481 support and breaks above the 107,840 resistance, bullish momentum is expected to continue toward the 111K zone. Traders should watch for a breakout confirmation and manage risk accordingly. 💹