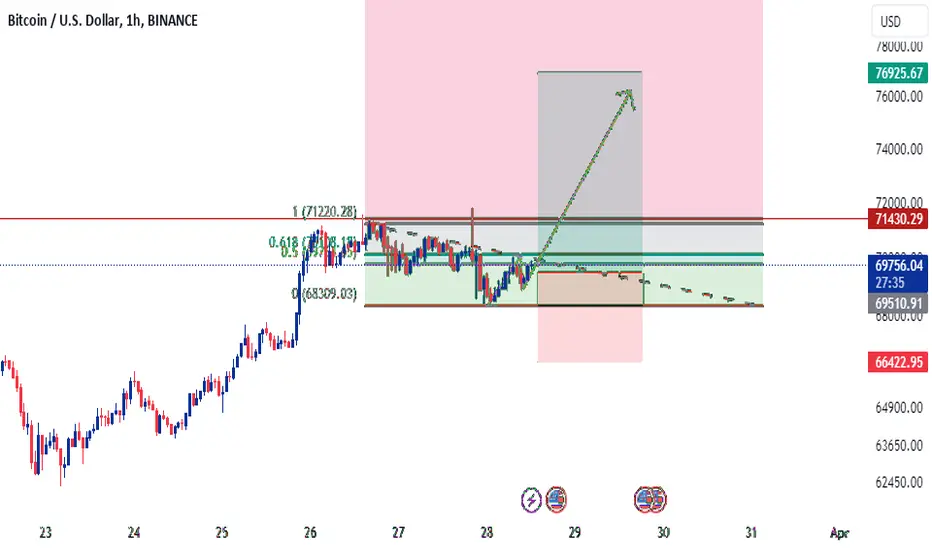
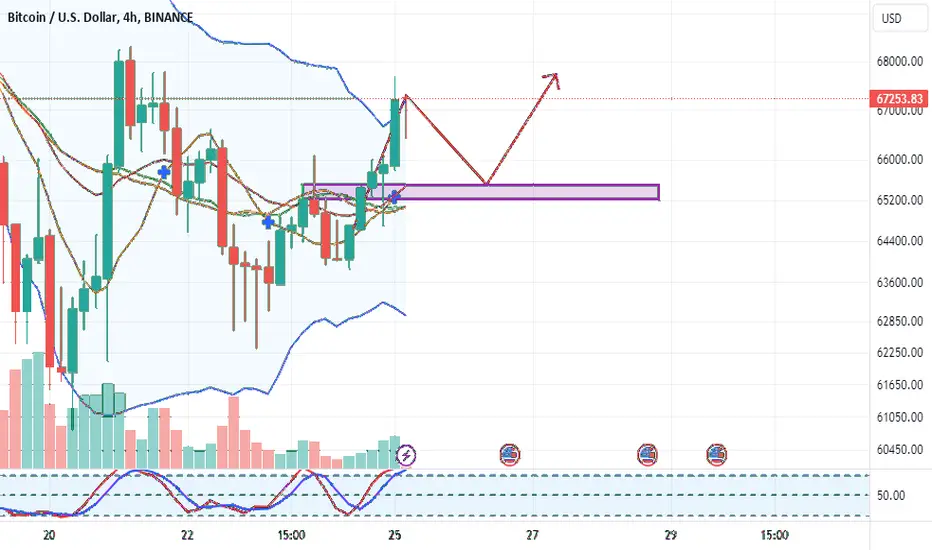
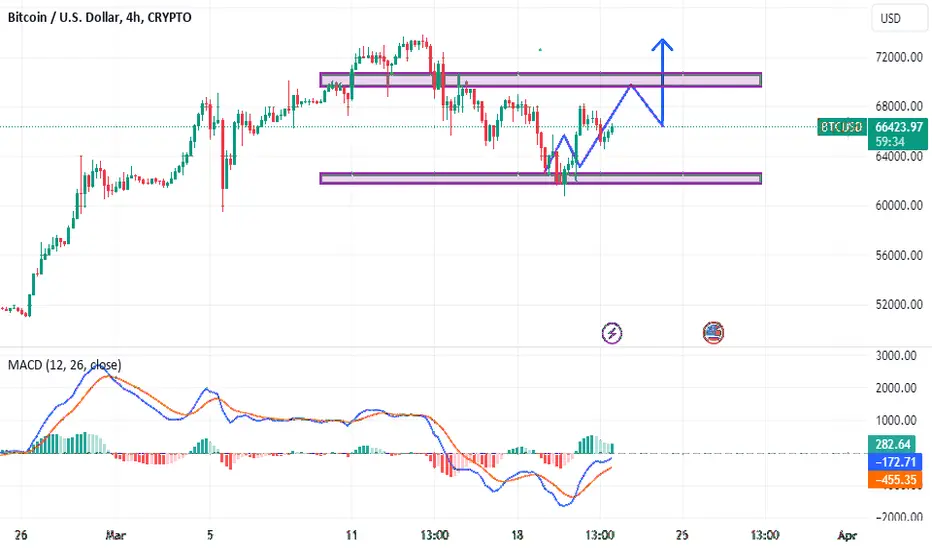
BTC Analysis: Impulse Moves and Bullish PotentialImpulse moves are evident once again in the BTC market, with buyers currently dominating. Through pattern analysis, a symmetrical triangle formation has been identified, indicating the potential for bullish continuation. The projected target of the pattern is set at 76000.
For current support, levels are identified at 69000 - 68500, serving as a buying zone. It's recommended to implement cut-loss strategies if prices break below 66700.
Btctrend
Bitcoin: Revolutionizing Finance in the Digital AgeBitcoin, often hailed as digital gold, continues to redefine the landscape of finance, ushering in an era of decentralization, innovation, and financial sovereignty. Since its inception in 2009, Bitcoin has captivated the imagination of individuals and institutions worldwide, challenging traditional notions of money and value.
At its core, Bitcoin operates on a decentralized network of computers, utilizing blockchain technology to record and verify transactions without the need for intermediaries. This peer-to-peer system ensures transparency, security, and censorship resistance, empowering users to transact freely and securely across borders.
Bitcoin's finite supply of 21 million coins, coupled with its decentralized issuance mechanism, imbues it with scarcity and deflationary properties akin to precious metals like gold. This scarcity model, combined with growing adoption and acceptance, has fueled Bitcoin's meteoric rise in value, making it an attractive store of value and hedge against inflation.
Moreover, Bitcoin's ethos of financial sovereignty and individual empowerment resonates with a growing movement advocating for privacy, autonomy, and transparency in finance. Its censorship-resistant nature makes it immune to government intervention and control, offering a hedge against political instability and authoritarian regimes.
Despite its disruptive potential, Bitcoin faces challenges ranging from scalability issues to regulatory scrutiny and technological limitations. Yet, each obstacle presents an opportunity for innovation and growth, as the Bitcoin community collaborates to address these challenges and propel the cryptocurrency into the mainstream.
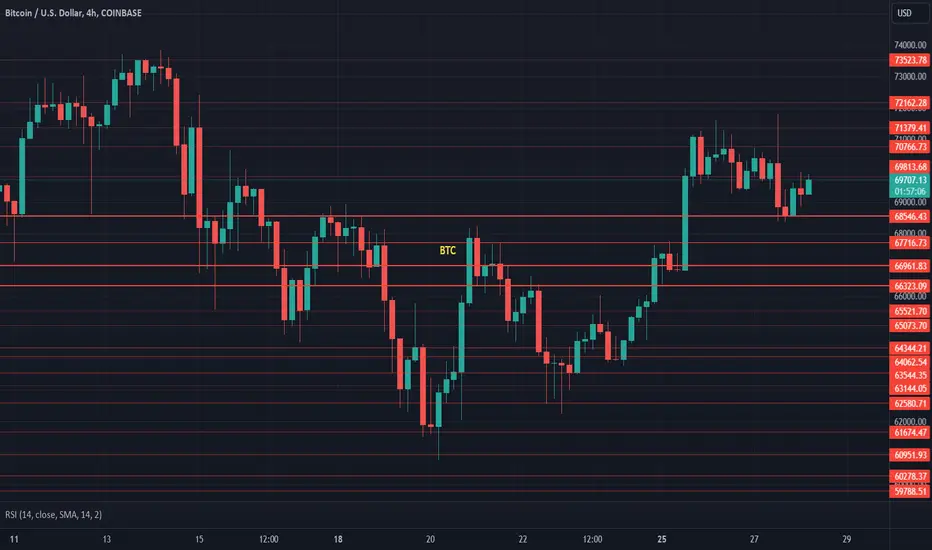
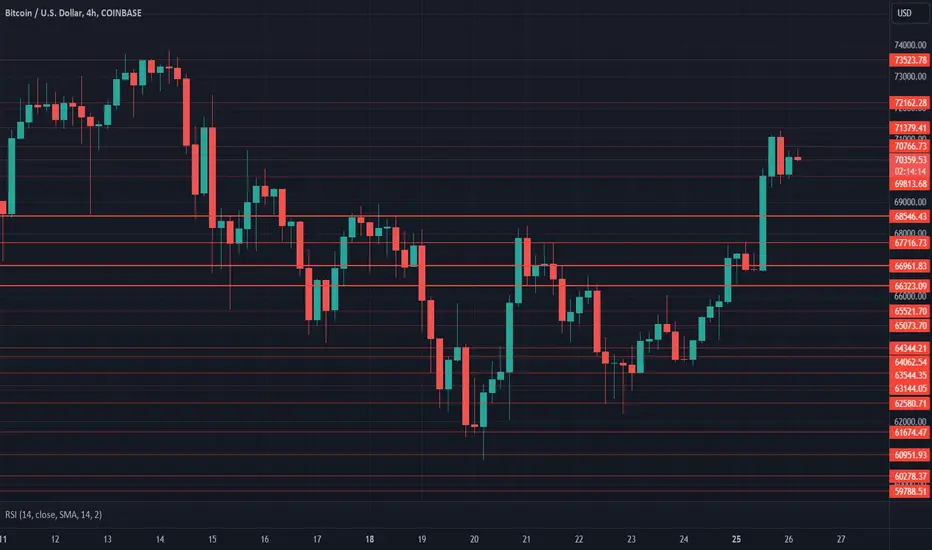
$BTC Daily UpdateCRYPTOCAP:BTC #BTC On $68,548 support followed by bearish engulfing on 4h, Support held good. $69,813 testing as of now. Previous 1D closed bearish, support could be tested further, $71,379 resisted last climb. RSI is looking good on 4h, if maintained the pace it could reattempt the $72,162 resistance. Possible Bullish engulfing forming on 4h - almost 2h to close yet. $66,961 next key support from here, Watch given S/R areas.
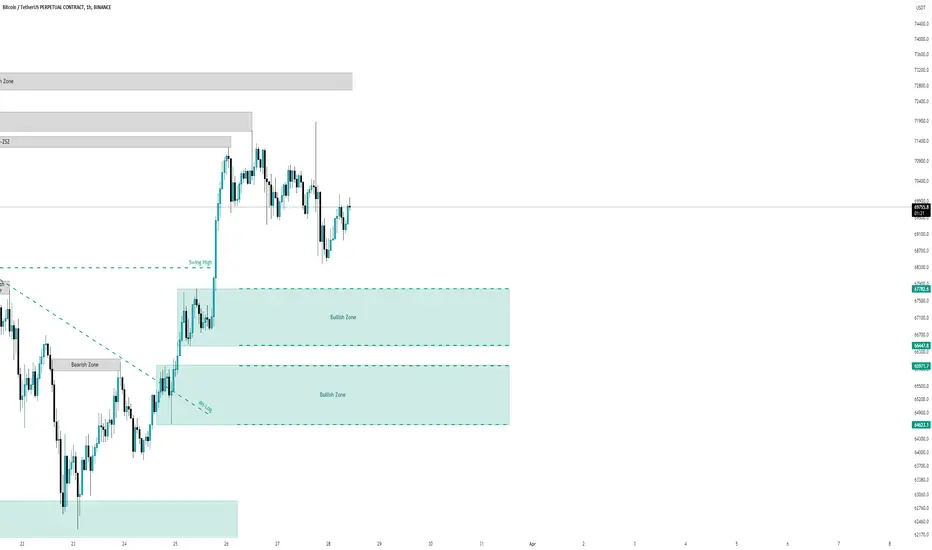
$BTC-28th March- Long/Buy IdeaBTC has broken the previous swing high, will be looking at a long trade/Buy from these two bullish zones.
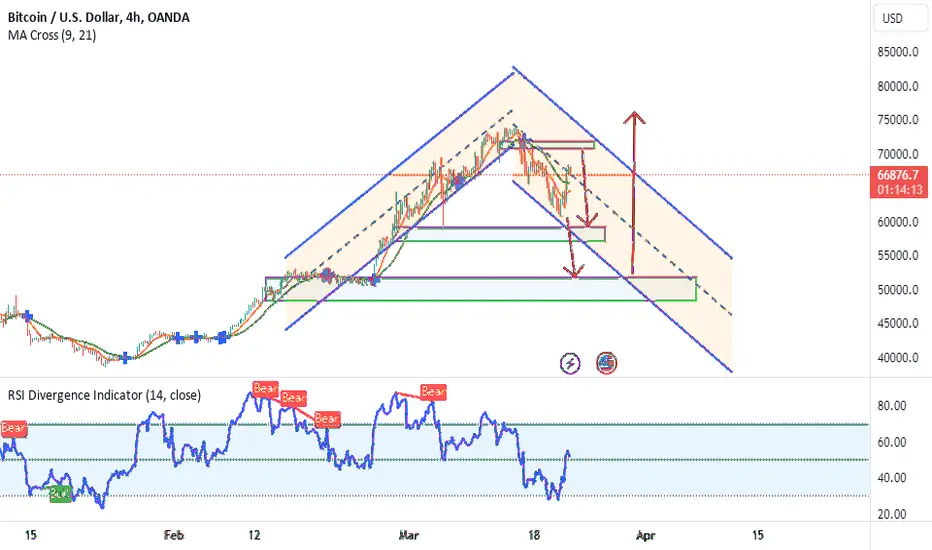
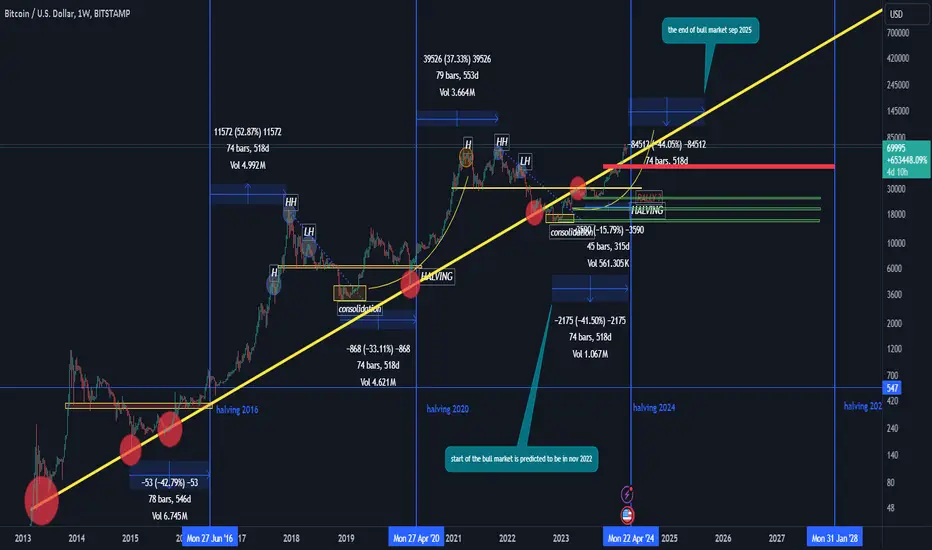
BITCOIN DETAIL ANALYSIS 250K SOON THIS YEARhello Traders, here is the full analysis for this pair, let me know in the comment section below if you have any questions, the entry will be taken only if all rules of the strategies will be satisfied. I suggest you keep this pair on your watchlist and see if the rules of your strategy are satisfied. Please also refer to the Important Risk Notice linked below.
Bitcoin: Navigating the Digital FrontierIn the realm of finance, Bitcoin has emerged as a transformative force, captivating investors and experts alike with its potential to redefine the financial landscape. As a financial expert, I offer insights into the intricacies of Bitcoin and its implications for the global economy.
Bitcoin, a decentralized digital currency, represents a paradigm shift in the way we perceive and utilize money. Its blockchain technology ensures transparency, security, and immutability, laying the foundation for a new era of digital transactions.
One of Bitcoin's most notable characteristics is its finite supply, with a maximum of 21 million coins. This scarcity, combined with increasing demand, positions Bitcoin as a digital store of value, akin to gold, offering protection against inflation and economic instability.
Despite its volatility, Bitcoin has gained mainstream acceptance, attracting institutional investors, corporations, and even governments. This recognition underscores Bitcoin's growing importance as a legitimate asset class and a hedge against traditional financial systems.
From a portfolio management perspective, Bitcoin's low correlation with traditional assets presents opportunities for diversification and risk management. Many investors view Bitcoin as a strategic addition to their portfolios, offering potential for enhanced returns and downside protection.
However, investing in Bitcoin comes with risks, including regulatory uncertainty and technological vulnerabilities. It's crucial for investors to conduct thorough research and exercise caution when navigating the complex landscape of digital assets.
In conclusion, Bitcoin represents a revolutionary step towards a decentralized and inclusive financial ecosystem. As a financial expert, I encourage investors to approach Bitcoin with an open mind, recognizing its potential to reshape the future of finance while remaining vigilant to the challenges and opportunities it presents.

Bitcoin: A Financial Expert's PerspectiveAs a seasoned financial expert, I offer a comprehensive analysis of Bitcoin, the pioneering cryptocurrency that has captivated investors and reshaped the financial landscape.
Bitcoin, often referred to as digital gold, has emerged as a disruptive force in the world of finance. Its decentralized nature and innovative blockchain technology have sparked a wave of interest and investment, positioning it as a potential alternative to traditional currencies and assets.
One of Bitcoin's key attributes is its limited supply, with only 21 million coins ever to be mined. This scarcity, coupled with increasing demand, has led many to view Bitcoin as a store of value akin to precious metals, offering protection against inflation and economic uncertainty.
Despite its volatility, Bitcoin has gained mainstream acceptance, attracting institutional investors, corporations, and even governments. Its potential as a hedge against fiat currencies and traditional financial systems has led to widespread adoption and investment.
From a portfolio management perspective, Bitcoin's low correlation with traditional assets presents opportunities for diversification and risk management. Many investors view Bitcoin as a strategic addition to their portfolios, offering potential for enhanced returns and portfolio resilience.
However, investing in Bitcoin carries risks, including regulatory uncertainty and market volatility. It's essential for investors to conduct thorough research and exercise caution when navigating the dynamic cryptocurrency market.
In conclusion, Bitcoin represents a revolutionary shift in the way we perceive and interact with money. As a financial expert, I encourage investors to approach Bitcoin with careful consideration, recognizing both its potential as a disruptive asset class and the challenges inherent in its adoption and investment.

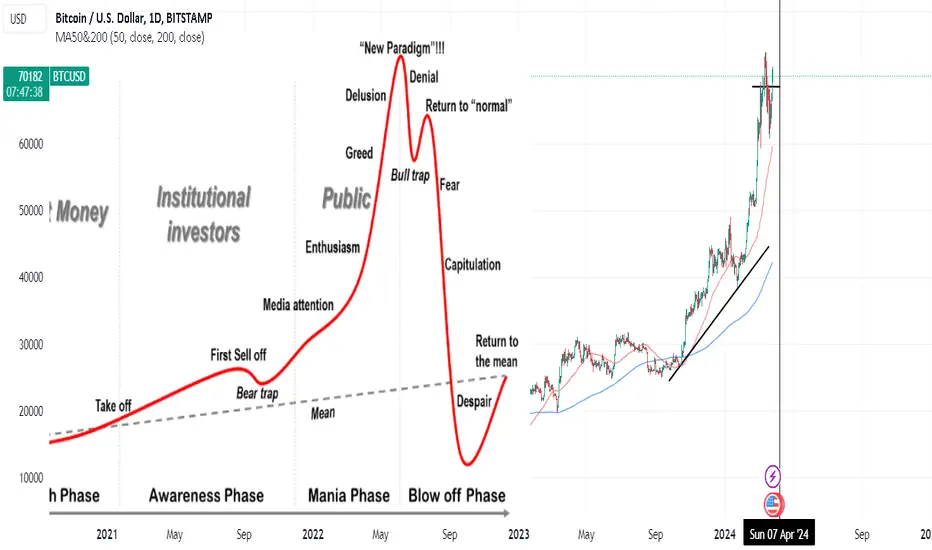
BTC needs a higher sustainable high.During public euphoria, bitcoin needs a sustainable high to maintain it's trend.
Bitcoin: Deciphering Digital AssetsIn the realm of finance, few phenomena have stirred as much excitement and debate as Bitcoin. As a financial expert, I endeavor to delve into the intricacies of this digital currency and its implications for the global financial landscape.
Bitcoin, often hailed as a decentralized digital currency, has captured the attention of investors worldwide with its promise of borderless transactions and financial sovereignty. Its underlying blockchain technology, which ensures transparency and immutability, has sparked a wave of innovation across various industries.
One of Bitcoin's most compelling features is its finite supply, capped at 21 million coins. This scarcity, coupled with increasing demand, has led proponents to view Bitcoin as a digital store of value akin to gold, offering a hedge against inflation and economic uncertainty.
Despite its volatile nature, Bitcoin has garnered mainstream acceptance, with institutional investors, corporations, and even governments acknowledging its potential as a legitimate asset class. The integration of Bitcoin into traditional financial systems reflects a broader recognition of its utility and resilience.
From a portfolio management perspective, Bitcoin's low correlation with traditional assets presents opportunities for diversification and risk management. While its price fluctuations may pose challenges, many investors view Bitcoin as a strategic allocation for enhancing portfolio returns over the long term.
However, regulatory uncertainty and technological risks underscore the importance of caution and due diligence when investing in Bitcoin. As the regulatory landscape evolves, investors must stay informed and adapt their strategies accordingly to navigate potential pitfalls.
In conclusion, Bitcoin represents a seismic shift in the way we perceive and interact with money. Its disruptive potential extends far beyond finance, paving the way for a new era of digital assets and decentralized systems. As a financial expert, I encourage investors to approach Bitcoin with an open mind, recognizing both its opportunities and challenges in shaping the future of finance.

Bitcoin: The Unstoppable Force Shaping Financial LandscapesIn the realm of modern finance, one phenomenon stands out like a titan among mortals: Bitcoin. Born from the ashes of economic turmoil and nurtured by the ethos of decentralization, Bitcoin has become the beacon guiding the evolution of financial paradigms.
At its core, Bitcoin embodies the principles of transparency, autonomy, and resilience. It operates without the shackles of traditional banking systems, empowering individuals with control over their wealth like never before. With each transaction recorded on an immutable ledger, Bitcoin ensures integrity and trust in an inherently trustless environment.
But Bitcoin is more than just a digital currency; it's a symbol of defiance against centralized authority. Its decentralized nature challenges the status quo, offering a glimpse into a future where power is distributed among the masses rather than concentrated in the hands of the few.
Despite facing skepticism and regulatory hurdles, Bitcoin persists, evolving and adapting with each challenge it encounters. Its meteoric rise from obscurity to mainstream recognition is a testament to its resilience and the growing acceptance of cryptocurrencies as a legitimate asset class.
As traditional financial institutions grapple with the implications of this digital revolution, Bitcoin continues to surge forward, transcending borders and ideologies. It has sparked a global conversation about the nature of money and the future of finance, forcing even the staunchest critics to take notice.
In the ever-changing landscape of finance, Bitcoin remains a constant, a beacon of hope for those seeking financial freedom and autonomy. Its journey is far from over, but one thing is certain: Bitcoin has irrevocably altered the course of history, and its impact will be felt for generations to come.
Bitcoin: Pioneering the Future of FinanceIn the realm of digital innovation, Bitcoin emerges as a groundbreaking force reshaping the landscape of finance and technology. As the world's first decentralized cryptocurrency, Bitcoin embodies the spirit of innovation, decentralization, and financial empowerment.
Born out of the enigmatic vision of Satoshi Nakamoto in 2009, Bitcoin revolutionizes traditional financial systems by eliminating the need for intermediaries like banks or governments. Its underlying technology, blockchain, ensures transparency, security, and immutability, paving the way for a new era of trustless transactions.
Bitcoin's meteoric rise to prominence has captivated the imagination of investors, technologists, and visionaries worldwide. Its decentralized nature empowers individuals to control their wealth and transact freely, transcending geopolitical boundaries and fostering financial inclusion on a global scale.
Moreover, Bitcoin's finite supply of 21 million coins imbues it with scarcity, akin to precious metals like gold, making it an attractive store of value and hedge against inflation. Its deflationary nature incentivizes long-term investment and fosters a culture of savings and wealth preservation.
However, Bitcoin's journey is not without challenges. Volatility, scalability, and regulatory scrutiny pose significant hurdles to its widespread adoption and acceptance. Yet, each obstacle presents an opportunity for innovation and growth, as the Bitcoin community collaborates to address these challenges and propel the cryptocurrency into the mainstream.
As we stand on the precipice of a digital revolution, Bitcoin serves as a beacon of hope and possibility, ushering in a new paradigm of financial sovereignty and technological advancement. Its decentralized ethos and pioneering spirit inspire a future where financial freedom and innovation flourish, empowering individuals to take control of their destinies in a rapidly evolving world.
$BTC Daily UpdateCRYPTOCAP:BTC #BTC $71,379 resistance in effect, Finally back above $68,546, RSI on 1D and 4H looks fine. Next resistance area $72,162-$73,523, $68,546 support yet to be tested,
BTC still Super BullishAs long as BTC holds its last bull run resistance as a support, we cannot assume it to be bearish in any way. Just Zoom out to weekly chart and it is easy to see everything going on

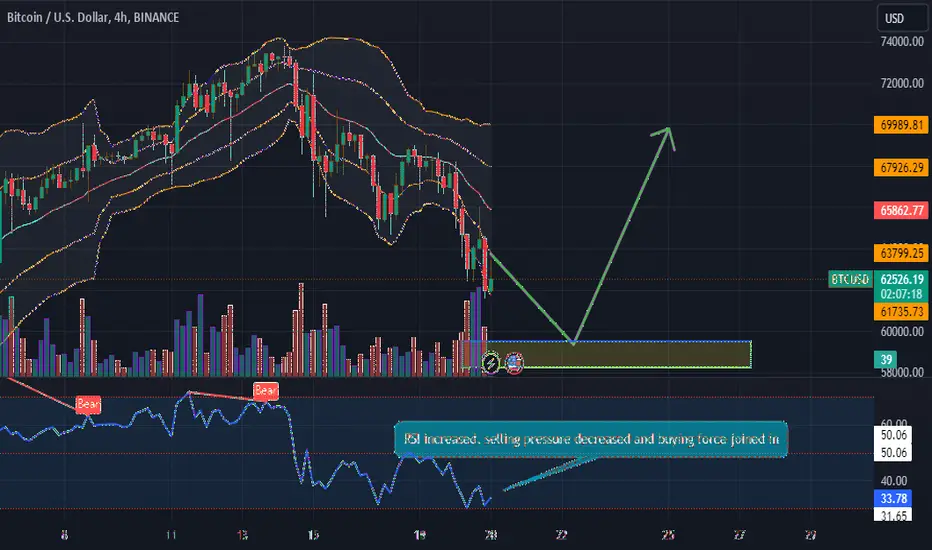
BTCUSD :Unveiling a Trading Strategy Yielding Up to 714 Pipsstrategic analysis and keen observation of market trends are paramount for success. A critical aspect of this is identifying key support and resistance zones where significant market activity is expected to occur. In the case of BTCUSDT, the main support area, buy zone, and supply area lie within the range of 60800 to 61700. Within this range, both whales and investors are poised, awaiting the opportune moment for a rally that could potentially yield up to 714 pips.
At the lower end of this range, around 60800, lies a crucial support level where buying pressure historically tends to increase. This level represents a point at which market participants perceive Bitcoin as undervalued, prompting increased buying activity as investors seek to capitalize on potential price appreciation. Conversely, the upper end of the range, approximately 61700, acts as a supply area where selling pressure typically intensifies. Here, traders who entered positions at lower levels may choose to take profits, leading to a temporary stall or reversal in price momentum.
The convergence of these support and resistance zones creates a dynamic environment where market sentiment can quickly shift. Observing price action within this range provides valuable insights into the balance of supply and demand forces at play. Traders closely monitor factors such as trading volume, order flow, and price volatility to gauge the strength of prevailing market trends and anticipate potential breakout or reversal opportunities.
For whales and institutional investors, this range represents an attractive accumulation zone where significant liquidity is concentrated. These market participants often possess substantial capital and strategic insight, enabling them to influence price movements through large buy or sell orders. As such, their presence within the 60800 to 61700 range signals a consensus belief in Bitcoin's long-term value proposition, further bolstering confidence among retail traders.
The anticipated rally of up to 714 pips hinges on the successful navigation of this critical range. A breakout above 61700 could trigger a surge in buying activity as resistance levels are breached, paving the way for further upside potential. Conversely, a breakdown below 60800 may signal weakness in bullish momentum, potentially leading to a retest of lower support levels.
In conclusion, the main support area, buy zone, and supply area of 60800 to 61700 serve as focal points for market participants seeking to capitalize on Bitcoin's price movements. By carefully analyzing price dynamics within this range and monitoring the actions of whales and institutional investors, traders can position themselves to capitalize on potential rally opportunities while managing risk effectively.

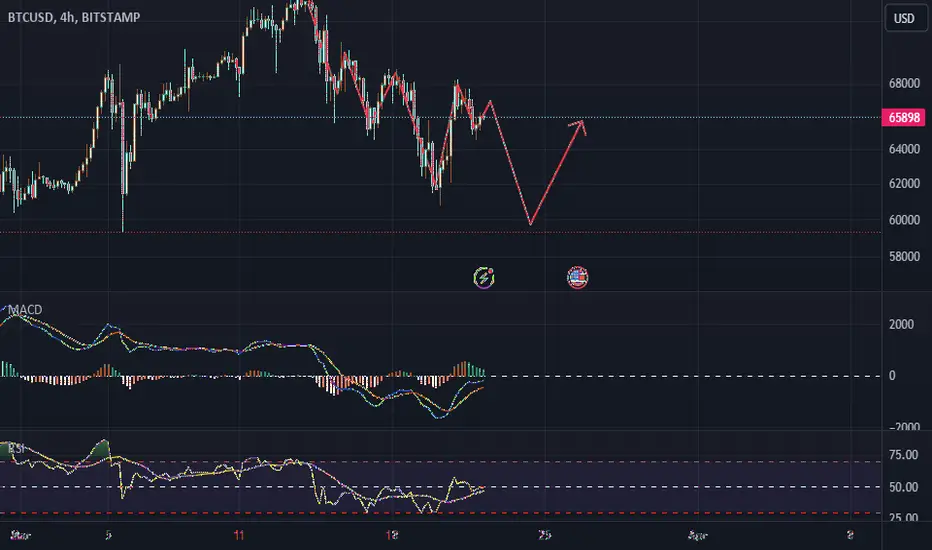
BTC: Riding the Waves of Market DynamicsBitcoin (BTC) remains at the forefront of the ever-evolving cryptocurrency landscape, characterized by its resilience amidst market fluctuations. Recent price movements underscore the dynamic nature of BTC, with both bullish surges and bearish corrections shaping its trajectory.
Traders and investors closely monitor BTC's price action, analyzing technical indicators and market sentiment for insights into potential trends. While some speculate on the formation of technical patterns like the Inverse Head and Shoulders, others emphasize key support and resistance levels, such as the critical $64,000 threshold.
As BTC continues to captivate the attention of market participants worldwide, its price movements serve as a reflection of broader sentiment towards digital assets. Amidst the volatility, stakeholders remain adaptable, prepared to adjust their strategies to navigate the evolving landscape of cryptocurrency trading.
In this ever-changing environment, staying informed and agile is paramount for traders seeking to capitalize on opportunities and mitigate risks in the dynamic world of BTC.
BTC: A Beacon Amidst Market FluxIn the realm of cryptocurrencies, Bitcoin (BTC) stands as a steadfast beacon, guiding investors through the turbulence of market fluctuations. Its recent trajectory reflects the dynamic nature of digital assets, with volatility being both a challenge and an opportunity.
As BTC oscillates between bullish surges and corrective dips, traders analyze various indicators to decipher potential trends. The $64,000 mark emerges as a critical juncture, signaling shifts in sentiment and price dynamics.
Despite the uncertainty, BTC maintains its allure, drawing both seasoned investors and newcomers into its orbit. Its resilience amidst market flux serves as a testament to its enduring appeal and position as the pioneer of the crypto world.
As stakeholders navigate the ups and downs of BTC's journey, one thing remains clear: Bitcoin continues to shape the future of finance, offering a beacon of hope and opportunity in an ever-evolving landscape.
Deciphering Gold: Insights from a Financial AnalystGold, the timeless metal, holds a special place in the world of finance, captivating investors and analysts with its allure and significance. As a financial analyst, delving into the intricacies of gold offers a unique perspective, unveiling insights into market trends and investment strategies.
At its core, gold represents stability and value. Its scarcity and enduring demand make it a coveted asset, particularly during times of economic uncertainty and market turbulence.
Understanding the factors influencing gold prices requires a keen eye for global trends and macroeconomic indicators. Geopolitical tensions, central bank policies, and currency fluctuations all play pivotal roles in shaping the dynamics of the gold market.
Furthermore, gold's versatility extends beyond mere investment. Its applications in jewelry, technology, and industry contribute to its demand profile, influencing market sentiment and price movements.
As financial analysts, navigating the complexities of the gold market demands thorough research and astute analysis. Examining historical trends, assessing supply and demand dynamics, and staying informed about geopolitical developments are essential for making informed investment decisions.
In conclusion, gold remains a cornerstone asset in the financial world, offering stability and diversification benefits to investors. By viewing gold through the lens of a financial analyst, one can gain valuable insights into its role within the broader economic landscape and capitalize on emerging opportunities.

Bitcoin: Pioneering the Future of FinanceIn the realm of digital currencies, Bitcoin stands as a trailblazer, revolutionizing the way we perceive and transact value. Born out of a vision for decentralized currency, Bitcoin has evolved from a niche concept to a global phenomenon, reshaping the landscape of finance as we know it.
At its core, Bitcoin represents a paradigm shift away from traditional centralized banking systems. By leveraging blockchain technology, Bitcoin transactions are secured, transparent, and immutable, eliminating the need for intermediaries and empowering individuals with greater control over their finances.
Bitcoin's decentralized nature not only offers financial autonomy but also serves as a hedge against inflation and government manipulation. With a fixed supply cap of 21 million coins, Bitcoin stands as a scarce digital asset, immune to the pitfalls of fiat currencies susceptible to inflationary pressures.
Moreover, Bitcoin's borderless nature transcends geographical constraints, facilitating seamless peer-to-peer transactions across the globe. Whether it's remittances to family members in distant countries or charitable donations to communities in need, Bitcoin provides a frictionless means of transferring value, irrespective of traditional banking infrastructure.
Despite its meteoric rise in popularity, Bitcoin has not been without its challenges. Volatility remains a prominent feature of the Bitcoin market, presenting both opportunities and risks for investors. Additionally, regulatory uncertainties and concerns about illicit activities have prompted scrutiny from governments and financial institutions worldwide.
However, amidst these challenges, Bitcoin continues to garner mainstream acceptance and adoption. Institutional investors, corporations, and even governments are increasingly recognizing the potential of Bitcoin as a store of value and a hedge against economic uncertainty.
As we look to the future, Bitcoin's impact on the financial landscape is poised to grow exponentially. With ongoing technological advancements and increasing recognition as a legitimate asset class, Bitcoin is paving the way for a more inclusive, transparent, and decentralized financial system, where power is returned to the hands of the people.
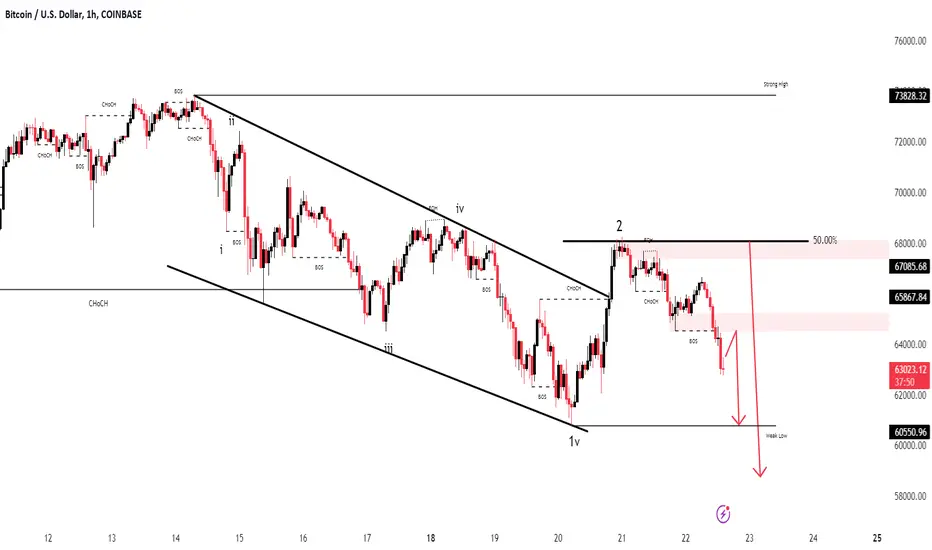
BTCUSDPair : BTCUSD ( Bitcoin / U.S Dollar )
Description :
Completed " 12 " Impulsive Waves
Break of Structure
RSI - Divergence
Falling Wedge
CHoCH
Fibonacci Level - 61.80%
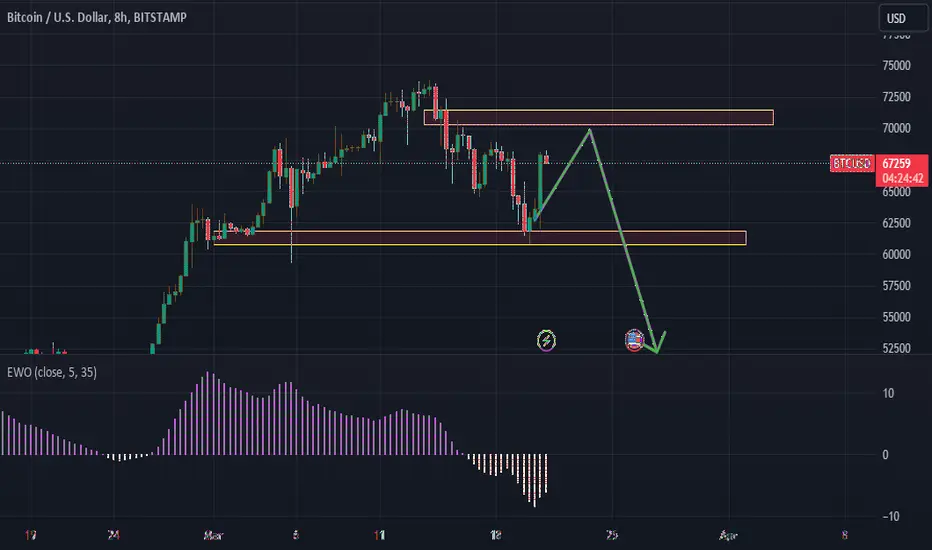
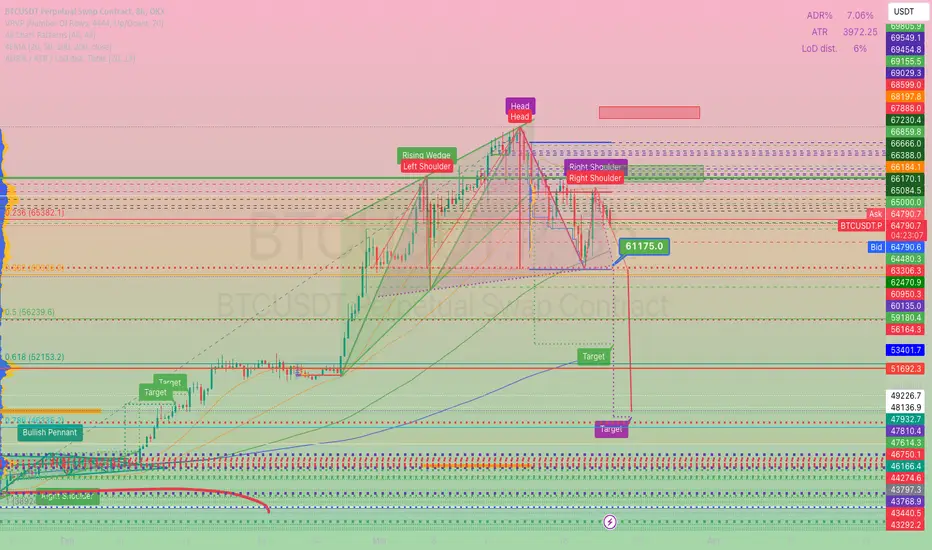
BTCUSDT Short trading ideaOKX:BTCUSDT.P
Short trading idea
=
Head and shoulders
+
Rising wedge
+
Fibonacci retracement 0.618
+
Fibonacci retracement 0.786
+
Retest level 30000
=
Enter 61175
=
Exit 53921 + 47241 + 31047
I am interested in your opinion on this algorithm of actions
deposit 20% of the asset
order 20% of deposit
shoulder ×20
cross margin
take profit 25+-% of the order
stop loss 5+-% of the order
day loss 1% of deposit
RR 1 to 5
Short position
Enter against a negative news background
+
When trendsetters are in a negative mood
+
No upcoming reports, speeches
+
Bearish chart and candlestick patterns
+
A pool of indicators signals a downtrend
#DYOR
BTC: Transforming the Future of FinanceBitcoin (BTC), the pioneer cryptocurrency, continues to revolutionize the financial landscape, offering a decentralized alternative to traditional banking systems. Since its inception in 2009, Bitcoin has garnered widespread attention and adoption, challenging conventional notions of money and value.
At its core, Bitcoin operates on a peer-to-peer network, utilizing blockchain technology to facilitate secure and transparent transactions without the need for intermediaries. This decentralized approach empowers individuals to transact directly with one another, fostering financial autonomy and freedom.
Bitcoin's limited supply of 21 million coins and its deflationary nature make it a sought-after store of value, akin to digital gold. Its decentralized issuance and censorship-resistant properties offer a hedge against economic uncertainties and inflation, attracting investors seeking to preserve wealth.
Moreover, Bitcoin embodies the ethos of financial empowerment and inclusivity, providing access to financial services for individuals underserved by traditional banking systems. Its borderless nature allows users to bypass financial restrictions and participate in the global economy seamlessly.
Despite facing challenges such as scalability issues and regulatory scrutiny, Bitcoin's resilience and growing adoption have solidified its position as a leading digital asset. Its decentralized ethos and borderless accessibility continue to attract investors, technologists, and enthusiasts worldwide.
As we navigate the complexities of the digital age, Bitcoin stands at the forefront of a financial revolution, reshaping the way we perceive and interact with money. Its decentralized ethos and disruptive potential inspire a new era of financial freedom and innovation, where individuals have greater control over their financial destinies.
BTC Bitcoin Technical Analysis and Trade Idea#BTC #Bitcoin has rallied on the back of the Fed holding rates and the USD tanking. The move seems over extended and has traded into a key resistance level. On the 1D time frame we can see lower lows/highs and a bearish break of structure. In the video we discuss a possible short opportunity on a 15m timeframe if price action sets up the right conditions.

$BTC Daily UpdateCRYPTOCAP:BTC #BTC Back on $66,323 support, put bullish engulfing on last 1D close, RSI on 1D and 4H looks good, expect $67,716-$68,546 test if followed thru. Next key support from here $64,344. Watch given S/R
