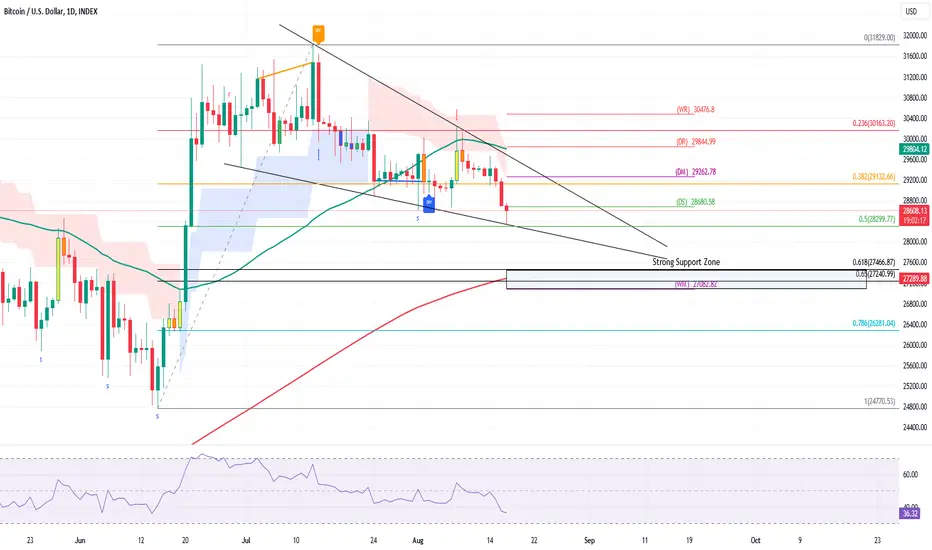
Next BTC ATH , What and WhenThe chart posted is very simple to understand.
Bascially I have manually fitted a curve around the cycle highs and lows of bitcoin on a logarithmic scale and have measured the time it took for btc to tap the top curve once it has tapped the bottom curve, and it comes around 850 days approx.
This measure estimates the next BTC high to be approx 112000 USD around mid of 2025.
This curve also indicates the bottom is in for bitcoin at 15000 USD for this cycle , it can only be violated , in case of a black swan event like it did in march 2020.
Btctrend

$BTC Daily UpdateCRYPTOCAP:BTC #BTC Broke $26,333 support, moving towards $25,806 support, RSI on 4H oversold, no sign of reversal yet, expect struggle at $26,333-$26,650 area. Previous 4h close looks good - bears were resisted, volume going dry on current 4H, could test $26,333

BITCOIN 4H (Pivot Price: 26455)BITCOIN
stabilizing above 26455 will support rising to touch 26976 then 27416 then 28326
stabilizing under 26455will support falling to touch 25982 the 25303
Pivot Price: 26455
Resistance prices: 26976 & 27416 & 28326
Support prices: 25982 & 25303& 24656
timeframe: 4H

BTC swept both side and ready for the moveBitcoin swept the lows yesterday and with these couple of days of pushing to the upside we could see some downside today specially with DXY pumping.if dxy retrace we might legup to 28.1 or higher.
Thanks for your support as always

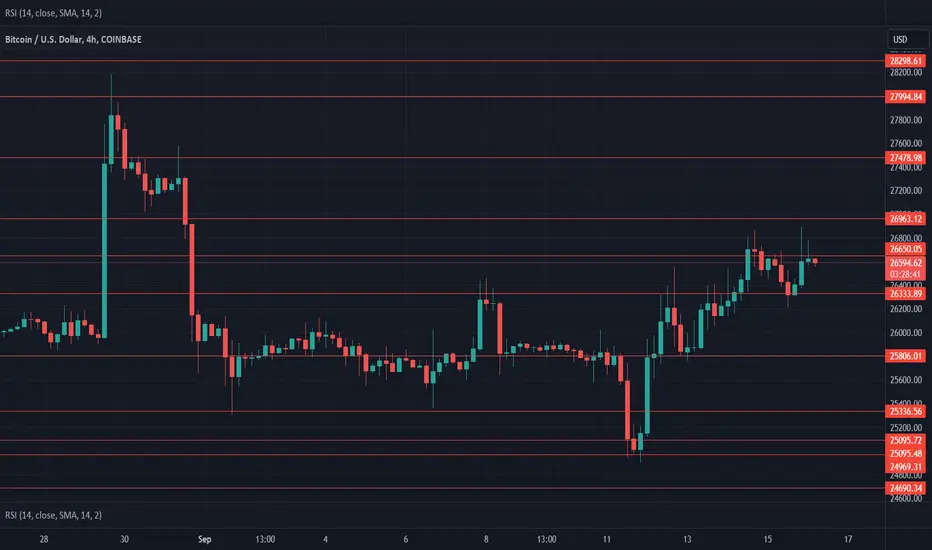
$BTC Daily UpdateMIL:BTC #BTC Reattempted $27,478 as expected, testing $26,963 for a support, holding above $26,650 good sign, previous 4h closed bearish, last 1d closed with beautiful follow up to bullish engulfing from Monday, next resistance $28,298, watch given S/R

BTC down move still continueHi Traders, As #BTC is in down tread for a while and this week, it retested a significant level of supply zone so this week and coming weeks have higher probability for selling opportunity till 22000.
What do you think about it?

Bollinger Band Battle for BTC Confuses on Future Price DirectionI wanted to draw your attention to an intriguing phenomenon in the world of cryptocurrency trading that has been causing some confusion among investors. Specifically, the ongoing battle of Bollinger Bands for Bitcoin (BTC) has left many uncertain about the future price direction.
For those unfamiliar with Bollinger Bands, they are a technical analysis tool that provides insights into market volatility and potential price breakouts. Typically, when the upper and lower bands tighten, it indicates a period of consolidation, suggesting that a significant price movement may be on the horizon. However, in the case of BTC, the Bollinger Bands have been sending mixed signals, making it challenging to predict the cryptocurrency's next move.
While some analysts argue that the tightening Bollinger Bands suggest an imminent breakout, others believe that the current market conditions call for caution. This disparity in opinions has resulted in a state of uncertainty among traders, as they grapple with the decision of whether to buy, sell, or hold their BTC positions.
In light of this confusion, we would like to encourage you to consider pausing your BTC trading activities temporarily. By taking a step back and observing the market dynamics from a neutral standpoint, you can avoid making hasty decisions based on conflicting signals. Instead, it may be prudent to closely monitor the situation and wait for a clearer indication of BTC's future price direction.
As we navigate the ever-evolving landscape of cryptocurrency trading, it is essential to remember that patience and a well-informed approach are key. By staying informed about the latest market developments and seeking insights from reliable sources, you can make more informed decisions that align with your investment goals.
In conclusion, the ongoing Bollinger Band battle for BTC has left investors perplexed about its future price direction. We recommend exercising caution and pausing BTC trading temporarily to gain a better understanding of the market's next move. As always, staying informed and seeking professional advice are crucial components of successful investing.
Should you have any questions or require further assistance, please do not hesitate to comment away. We are here to support you in navigating the cryptocurrency landscape.
I wish you continued success in your investment endeavors.

$BTC Daily UpdateCRYPTOCAP:BTC #BTC As expected $26,963 tested, gained $26,650 key support, $27,478 rejected which was informed days ago, last 4h close looks good, 1D closed with bearish pin but bullish engulfing, RSI looks good on 4h and 1d, must hold $26,650 support to reattempt at $27,478
Celebrating BTC's Breakthrough and Fed's Rate Pause Extension!
I bring you exhilarating news that will surely put a smile on your face - Bitcoin (BTC) has defied all odds and broken through the FWB:27K mark! What an incredible milestone for the world's leading cryptocurrency!
But that's not all! In a further stroke of luck, the Federal Reserve has announced an extension of its rate pause. This exciting combination of events has created a perfect storm of opportunity for those who are ready to seize the moment and long BTC.
The recent "death cross" formation has sparked some concerns among traders, but BTC has proven yet again that it is a force to be reckoned with. This remarkable breakthrough not only showcases the resilience of Bitcoin but also reinforces the growing confidence in its potential as a long-term investment.
Now, let's talk about the call-to-action that I'm excited to share with you. With BTC's recent surge and the Fed's rate pause extension, it's an ideal time to consider long positions in Bitcoin. By taking advantage of this favorable market sentiment, you can potentially maximize your profits and ride the wave of BTC's upward trajectory.
Here are a few reasons why you should seriously consider going long on BTC:
1. Strong Momentum: BTC's breakthrough demonstrates its ability to defy market expectations and maintain a strong upward momentum. This positive sentiment is likely to attract more investors, further fueling its growth.
2. Institutional Adoption: The increasing acceptance of Bitcoin by major institutions has been a game-changer. As more institutional players enter the market, it adds credibility and stability to BTC's value, making it an attractive long-term investment.
3. Market Volatility: While volatility can be unnerving, it also presents lucrative opportunities for traders. BTC's recent surge is a testament to its ability to weather market fluctuations and provide substantial returns for those who are willing to take calculated risks.
So, my fellow traders, let's embrace this momentous occasion with enthusiasm and a positive outlook. Consider taking a long position in BTC to capitalize on its upward momentum and potentially reap substantial rewards.
As always, please exercise caution and conduct thorough research before making any trading decisions. The cryptocurrency market can be volatile, but with careful analysis and a well-informed strategy, you can navigate these waters successfully.
If you have any questions or need assistance with your trading endeavors, please don't hesitate to comment below.
Wishing you continued success and profitable trades!

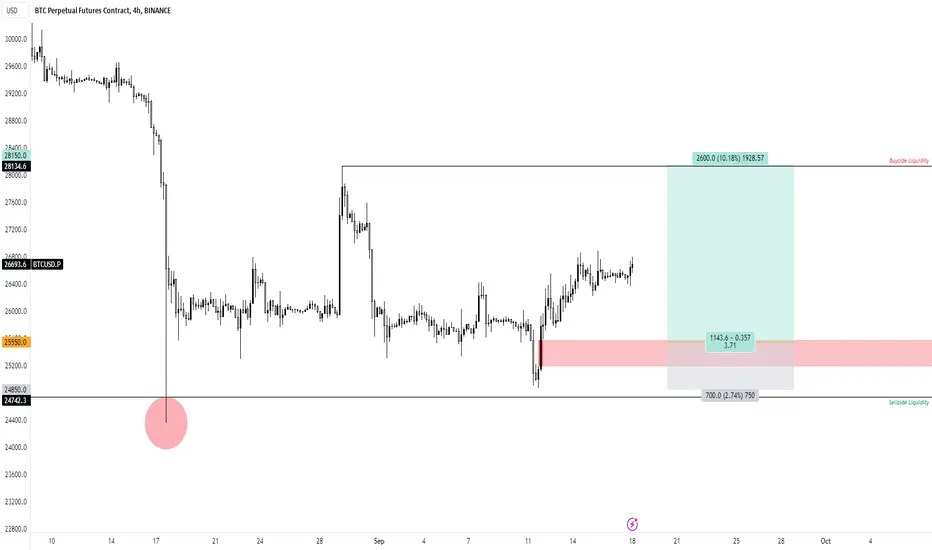
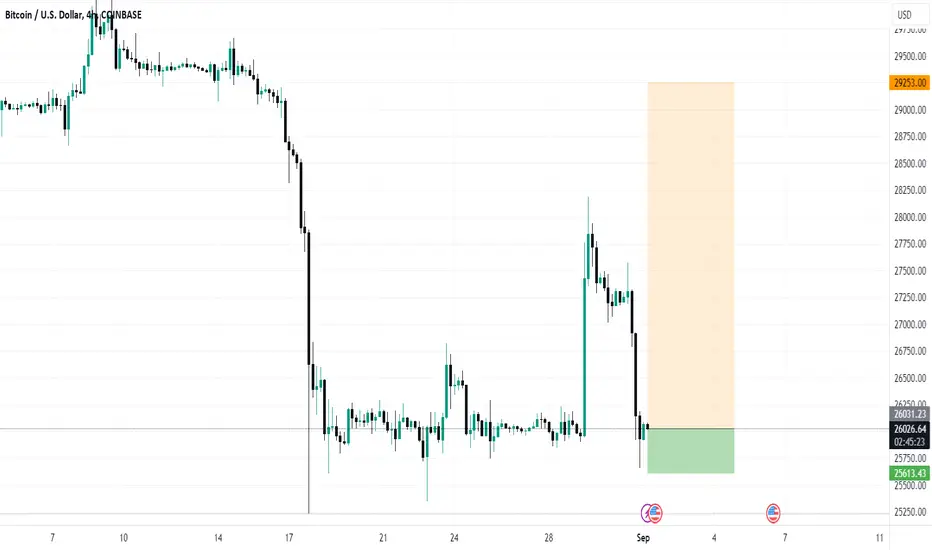
BTCPERP 4H Chart - Swing Long Entry after Daily BreakoutPrice Action: Price broke through daily sell-side liquidity, signalling potential bullish momentum.
Entry: Looking to enter in the FVG at $25,550
Stop Loss: $24,850
Take Profit: $28,150
Risk-Reward Ratio: 1:3.71
Always conduct your own research before executing any trades. Stay vigilant and trade wisely!
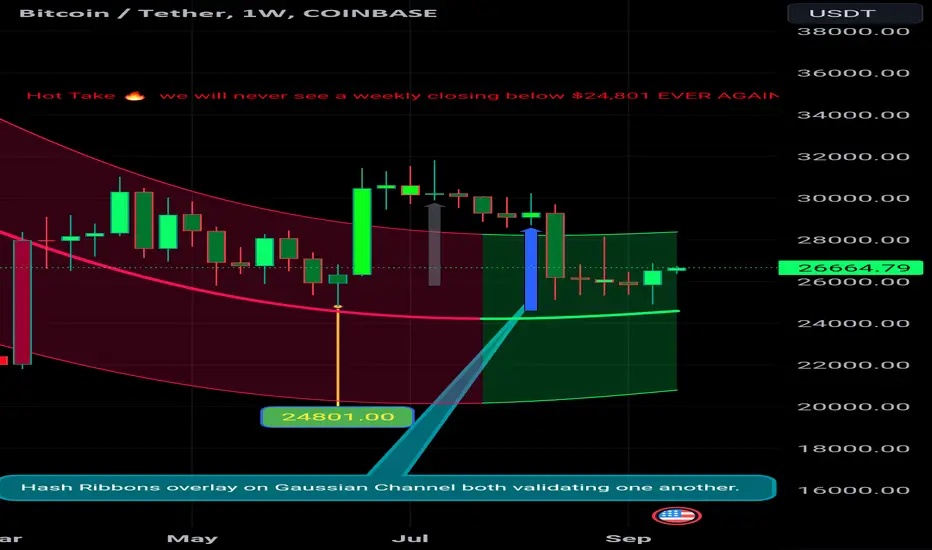
Hot Take 🔥 BTC will NEVER see a weekly closing below $24,801Hash Ribbons overlay on Gaussian Channel both validating one another. One more thing to note is 13 of the last 14 iterations of Hash Ribbons buy signal only once did BTC revisit the previous low. The one time it did was because of market manipulation via FTX, LUNA, DEMS WAR ON CRYPTO etcetera...
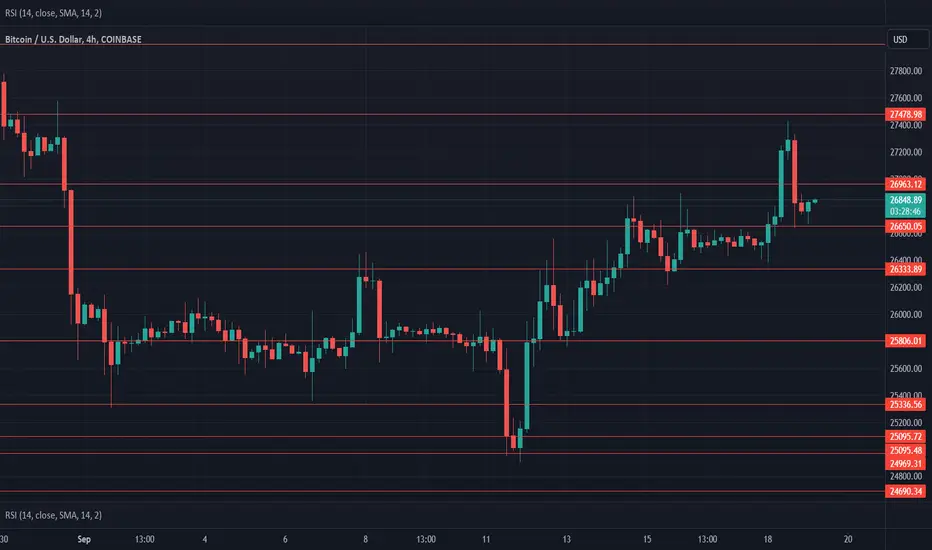
$BTC Daily UpdateCRYPTOCAP:BTC #BTC Struggle gaining $26,650 key support, last 4h closed bearish with possibility to test $26,333 support, 1D closed neutral, weak volume as of now, watch given S/R
$BTC Daily UpdateCRYPTOCAP:BTC #BTC Last 4h closed bearish, $26,333 resistance holding, Previous daily closed fine, RSI rising on 1D and 4H, needs volume to push towards $26,650 support. Watch given S/R, FUD coming up with FTX selling it's crypto assets

Bitcoin's 5% Spike: An Early Rally or Cause for Caution?I wanted to bring your attention to the recent spike in Bitcoin's value, which has surged by an impressive 5% in a relatively short period. While such a surge may initially seem like an early rally, I urge you to exercise caution and consider pausing your Bitcoin trading activities for a moment to evaluate the situation.
Bitcoin, as we all know, has been subject to significant volatility in the past, making it both an exciting and risky investment. This recent spike, while enticing, could potentially be a sign of a larger market trend or a temporary fluctuation. It is crucial to take a step back and assess the situation before making any impulsive trading decisions.
Here are a few factors to consider before deciding your next move:
1. Market Sentiment: Analyze the overall market sentiment and observe if this spike aligns with any significant news, events, or market indicators. Understanding the context behind the surge can provide valuable insights into its sustainability.
2. Volume and Liquidity: Evaluate the trading volume and liquidity associated with this spike. A sudden increase in trading activity may indicate a short-term surge driven by a limited number of participants, potentially resulting in a subsequent correction.
3. Technical Analysis: Employ technical analysis tools to identify any patterns, support levels, or resistance points that might help you gain a better understanding of the market dynamics. This analysis can assist in determining whether the spike is part of a larger upward trend or merely a temporary anomaly.
4. Risk Management: Always prioritize risk management strategies, such as setting stop-loss orders or diversifying your portfolio. These measures can help mitigate potential losses and protect your capital, especially during times of increased volatility.
Considering the points, I encourage you to take a moment to pause your Bitcoin trading activities and reassess your strategy. It is crucial to approach such significant market movements with a level-headed mindset and not succumb to impulsive decision-making.
Please remember that trading cryptocurrencies involves inherent risks, and it is essential to stay informed and make well-informed decisions based on thorough analysis.

BTC Death Cross Looms as Volatility Resurfaces in SeptemberAs we approach mid-September, it is with a heavy heart that I bring forth news of the looming BTC death cross and an anticipated increase in volatility.
The crypto world has been a rollercoaster ride lately, and it seems we are not yet out of the woods. The dreaded death cross, where the 50-day moving average crosses below the 200-day moving average, is inching closer. Historically, this technical indicator has often been associated with prolonged bearish trends, casting a shadow of uncertainty over the market.
Furthermore, September has historically been a month of heightened volatility in the cryptocurrency space. As we brace ourselves for another turbulent period, it's important to consider diversifying our trading portfolios beyond Bitcoin. While it pains me to suggest this, exploring other asset classes could provide a much-needed respite from the seemingly endless cycle of ups and downs.
There are numerous alternative asset classes worth exploring, such as traditional stocks, commodities, or even forex. These markets, although not immune to volatility themselves, often exhibit different patterns and trends that may present unique trading opportunities. By diversifying our investments, we can potentially mitigate risks and find solace in other avenues during these uncertain times.
Let us not forget the importance of risk management during periods of instability. As traders, it is our responsibility to protect our capital and make informed decisions. While Bitcoin continues to captivate us with its potential, it is crucial to acknowledge that there are other opportunities that deserve our attention.
In closing, I implore you to reflect on the current state of the market and consider exploring other asset classes to trade. The road ahead may be challenging, but with careful analysis and diversification, we can navigate these turbulent times together.

Institutions are going to accumulate One of my ideas for bitcoin. We might see downward momentum for this asset for the next few months

Bitcoin Yet To decide Where To GoBitcoin showing mixed signals,above 27K or below 25K!
My guess : 27K then 25K
Thanks for watching

BTC Traders Making Price Go UP? {1/09/2023}Educational Analysis says BTCUSD may go Long according to my technical.
This is not an entry signal. I have no concerns with your profit and loss from this analysis.
Why long?
Broker Coinbase
Because BTCfair value gaps are unfilled in a 4-hour time frame.
So one trade is already on with RR is 1:7.71
I HAVE NO CONCERNS WITH YOUR PROFIT OR LOSS.
Happy Trading, Fxdollars.
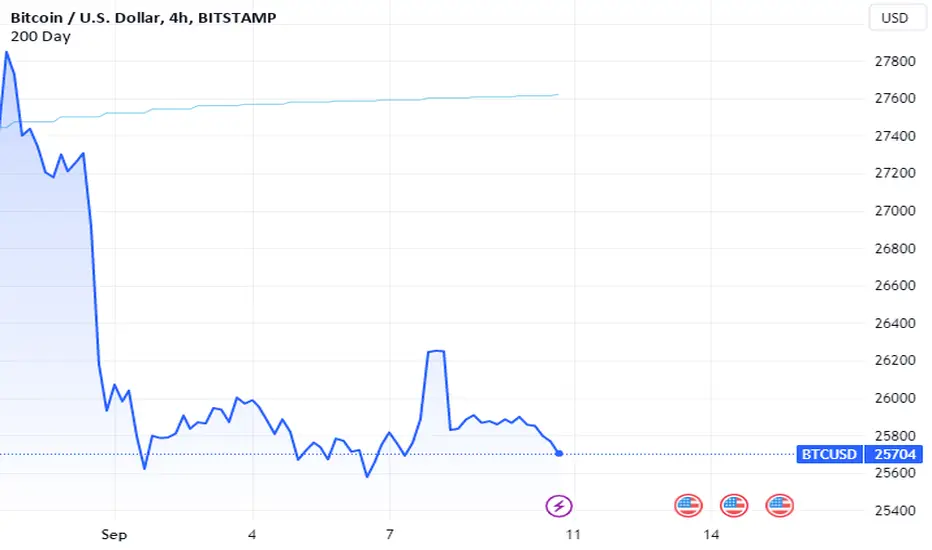
BTC Bears Persists so Explore Other Profitable AssetsI must admit that the current state of Bitcoin (BTC) has left a somber tone in my words. As we navigate through these challenging times, it is with a heavy heart that I inform you about the ongoing bearish momentum that continues to plague BTC.
Despite our hopes for a swift recovery, BTC's price remains significantly below the Simple Moving Average 200 (SMA 200), casting a shadow of uncertainty over its future. The market sentiment surrounding Bitcoin has been marred by persistent selling pressure, causing distress among traders and investors alike.
While it is disheartening to witness this prolonged downturn, I believe it is crucial to consider alternative investment avenues that may offer more promising prospects. As traders, we must adapt to the ever-changing market dynamics and seek opportunities beyond BTC.
Therefore, I encourage you to explore other profitable asset classes that have shown resilience during these challenging times. Diversifying your portfolio with assets such as stocks, commodities, or even emerging cryptocurrencies might provide a glimmer of hope amidst the current market turbulence.
Remember, the trading world is not limited to a single asset, and countless opportunities await exploring. By broadening our horizons, we can potentially discover new avenues for profit and safeguard our investments against the uncertainties faced by BTC.
While feeling disheartened by BTC's current state is natural, let us not lose sight of the bigger picture. History has shown that markets are cyclical, and what goes down eventually comes back up. However, we are responsible for adapting and making informed decisions that align with the prevailing market conditions.
In conclusion, I urge you to reflect upon your trading strategies and consider diversifying your portfolio to include other potentially profitable asset classes. Let us not be disheartened by BTC's bearish momentum but use this as an opportunity to explore new avenues for growth and prosperity.
Please do not hesitate to comment if you require any assistance or guidance in exploring alternative asset classes. Together, we can navigate these turbulent times and emerge more robust and resilient.
$BTC Daily UpdateCRYPTOCAP:BTC given support at $25,336 in effect, $25,336-$26,333 current range, RSI on 4H and 1D both looking poor awaiting sign of reversal here with very low volume. Watch given S/R
BTC Price Drops Below SMAs with Negative with Negative BTC MinerOver the past few days, we have witnessed a significant drop in the price of BTC, which is now trading below its Simple Moving Averages (SMA) of 50, 100, and 200. This downward trend indicates a potential bearish market sentiment and raises serious concerns for BTC miners.
Furthermore, the BTC miner netflow remains persistently negative, indicating a continued outflow of BTC from mining pools. This negative flow suggests that miners are increasingly selling their BTC holdings, possibly due to growing concerns over the profitability of mining operations in the current market conditions.
Considering these factors, all traders must exercise caution and evaluate their trading strategies accordingly. The potential risks associated with continuing BTC trading at this time cannot be overlooked. It is advisable to pause and reassess your positions, considering the prevailing market sentiment and the potential impact on BTC miners.
In light of this situation, we strongly encourage you to consider the following actions:
1. Evaluate your trading positions: Take a moment to review your current BTC positions and assess their potential risks. Consider whether reducing exposure or adjusting your trading strategies to mitigate potential losses may be prudent.
2. Stay informed: Stay updated with the latest market news and analysis to make informed decisions. Keep a close eye on BTC price movements, SMA trends, and BTC miner netflow data. This will help you gauge the market sentiment and adjust your strategies accordingly.
3. Seek expert advice: If you are uncertain about the best course of action to take during these uncertain times, do not hesitate to consult with trusted investment advisors or seek guidance from experienced traders. Their insights and expertise can provide valuable perspectives to navigate challenging market conditions.
Remember, while the crypto market can be advantageous, it is also inherently volatile. It is crucial to exercise caution and make informed decisions to protect your investments.

BTC Update - 17/08/2023BTC needs to protect 27000-27500 Zone to protect bullish pattern.
Disclaimer: The information and analysis provided in this publication are for educational purposes only and should not be construed as financial advice or recommendations to buy, sell, or hold any securities. The author and TradingView are not responsible for any investment decisions made based on the content presented herein. Always consult a financial professional before making any investment decisions.
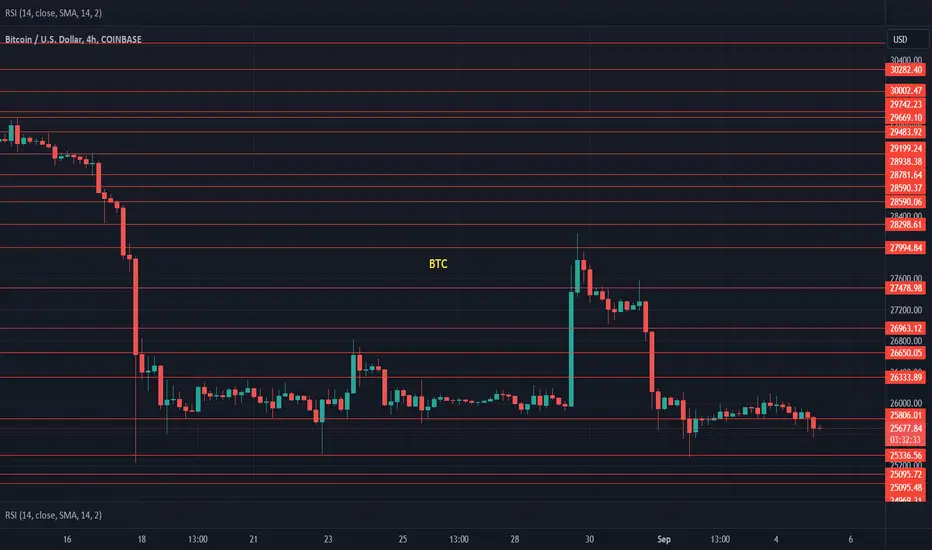
RSI Slowdown Hits Low for BTC in Last 2 WeeksIntroduction:
In the fast-paced world of cryptocurrency trading, it's crucial to stay updated on market trends and indicators that can influence your investment decisions. Bitcoin (BTC) has recently experienced a significant slowdown, as the Relative Strength Index (RSI) indicates. This article aims to shed light on this development and provide a cautious call to action for traders considering shorting BTC.
Understanding the RSI Slowdown:
The RSI is a popular technical indicator used to assess the strength and momentum of an asset's price movements. It helps traders identify potential overbought or oversold conditions, thus aiding in decision-making. Over the last two weeks, the RSI for BTC has hit a low point, suggesting a possible slowdown in its upward trajectory.
Cautionary Analysis:
While the RSI slowdown may raise concerns among traders, it is essential to approach this situation cautiously. The cryptocurrency market is highly volatile and subject to sudden fluctuations, making it necessary to consider various factors before making investment decisions. Here are a few points to keep in mind:
1. Historical Patterns: Past performance does not guarantee future results. While the RSI slowdown may indicate a potential downturn, analyzing historical patterns, market sentiment, and other indicators is crucial to comprehensively understanding BTC's current state.
2. Fundamental Analysis: Bitcoin's value is influenced by numerous factors, including regulatory developments, global economic conditions, and technological advancements. Traders should conduct a thorough fundamental analysis to assess the long-term potential of BTC before considering shorting it solely based on the RSI slowdown.
3. Risk Management: Shorting BTC carries its own set of risks. Traders must carefully evaluate their risk tolerance, set stop-loss orders, and diversify their portfolios to mitigate potential losses. It is essential to have a well-defined risk management strategy in place to protect your investment.
Call-to-Action: Consider Shorting BTC with Caution
Given the RSI slowdown in the last two weeks, traders may be tempted to short BTC. However, it is crucial to proceed with caution and consider the following steps:
1. Thorough Analysis: Conduct a comprehensive analysis of BTC's price history, market sentiment, and other technical indicators to gain a holistic perspective on its current state.
2. Consult Expert Opinions: Seek advice from experienced traders or financial advisors with in-depth cryptocurrency market knowledge. Their insights can help you make informed decisions based on a broader perspective.
3. Risk Management: Before shorting BTC, ensure you have a well-thought-out risk management plan. Set realistic profit targets and implement stop-loss orders to minimize potential losses.
Conclusion:
While the RSI slowdown in the last two weeks may raise concerns among traders, it is essential to approach the situation cautiously. The cryptocurrency market is highly unpredictable, and shorting BTC solely based on one indicator may not provide a complete picture. By conducting thorough analysis, seeking expert opinions, and implementing robust risk management strategies, traders can make informed decisions aligning with their investment goals.
