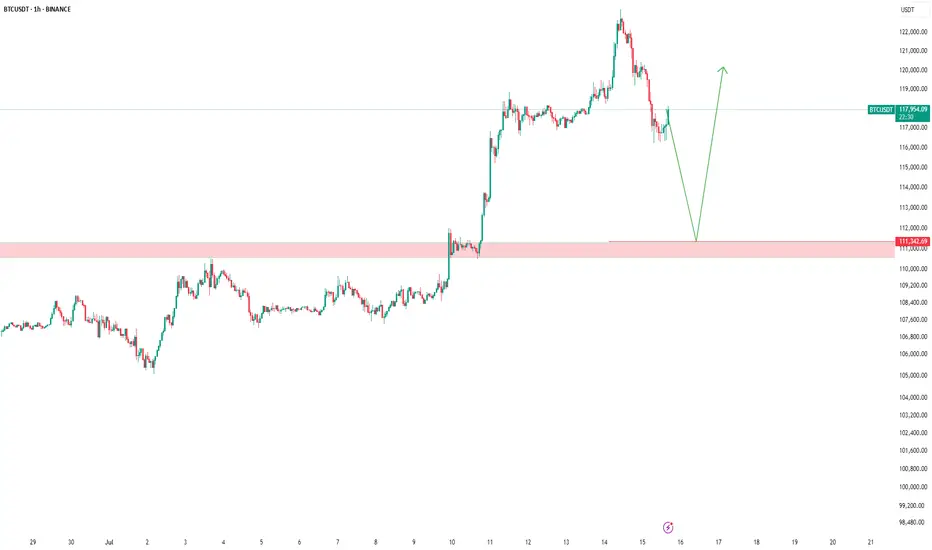
BTC Analysis — Long-Term Buy Zone AheadI'm watching $111,000 as a major buy zone on Bitcoin.
If price retraces to that level, I’ll be ready to enter a long position.
This is not a prediction — it’s a scenario.
Smart traders don’t guess, they prepare.
Let price come to your level. No chasing.
📍Set your alerts and stay patient.
Btcudst
Bitcoin's decline will continueBitcoin's recent trend is quite clear, clearly within a weak, narrow range. Ethereum, however, exhibits relatively greater volatility, offering greater room for maneuver.
Currently, Bitcoin is expected to maintain this range until at least the end of this month. Regarding Ethereum, the overall trend hasn't reversed. While there have been rebounds, the strength of these rebounds has been noticeably weak. Both Bitcoin and Ethereum prices remain within a downward trend. For short-term trading, we prioritize short positions on rebounds.
Short positions can be established around 113,500 for Bitcoin, with a target of 112,600.
Short positions can be established above 4250 for Ethereum, with a target of 4120.

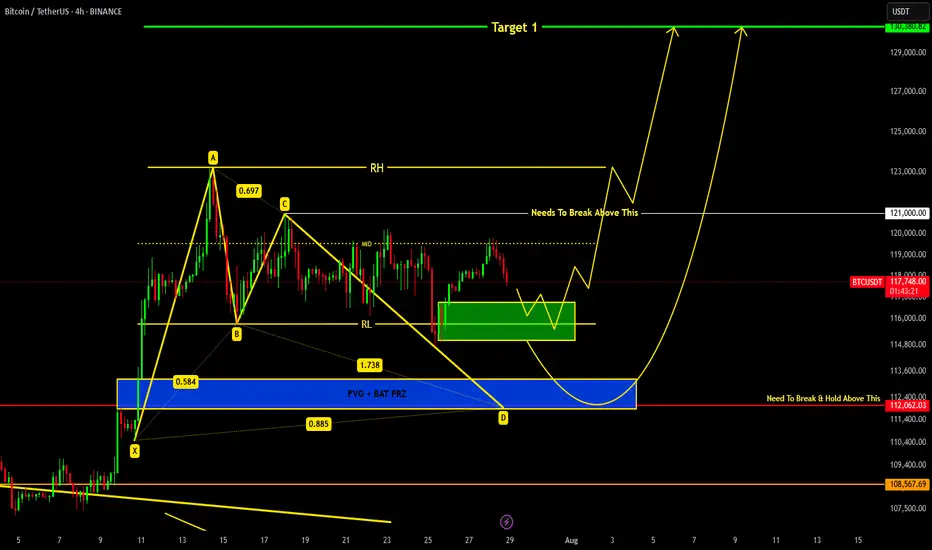
Bitcoin: $120K Breakthrough – Getting Ready for $130K–$134K!Bitcoin: $120K Breakthrough – Getting Ready for $130K–$134K!
🚀 Bitcoin (BTC/USD) – Technical Review, August 2025
• Support: $110K–112K holds — above it, bulls retain initiative.
• Momentum resumes: BTC broke through $120K, thanks to $260 million inflow into Bitcoin via ETFs and potential Bullish IPO. Drive is maintained. Possible target is $130K–$134K.
• Technical outlook: Recovery above $115K after record highs in July. Breakout — will give way to $128K. Hidden risks — fall below $110K.
• Long-term targets: Technical measurement points to potential up to $146,400 if above $112K holds and top is broken. RSI remains favorable, volumes on exchanges are declining — signal of institutional outflow.
Bottom line: Bitcoin is confidently holding above the key $110-120K zone. A breakout of $120K is a starting point for a move to $130-$134K, and then to $146K. Watch for consolidation or pullback near current levels.
Tactics:
- Buy on dip: around $112-115K with targets of $130-134K.
- Breakout buy: if it consolidates above $120K, target $130-$134K, then $146K.
- Stop loss: under $110K.


TONUSDTHello Traders! 👋
What are your thoughts on TONCOIN?
TON/USDT remains in a long-term ascending channel and is currently approaching a major resistance area. The price has respected the lower boundary of the channel and continued its upward trajectory.
If the resistance zone is broken in the coming attempts, it could open the path toward the next medium-term targets.
Until then, we expect price to consolidate below this key level with potential for a bullish breakout on renewed momentum.
Outlook: Bullish, as long as price holds within the ascending structure. A confirmed breakout above resistance will strengthen the bullish bias.
Don’t forget to like and share your thoughts in the comments!❤️

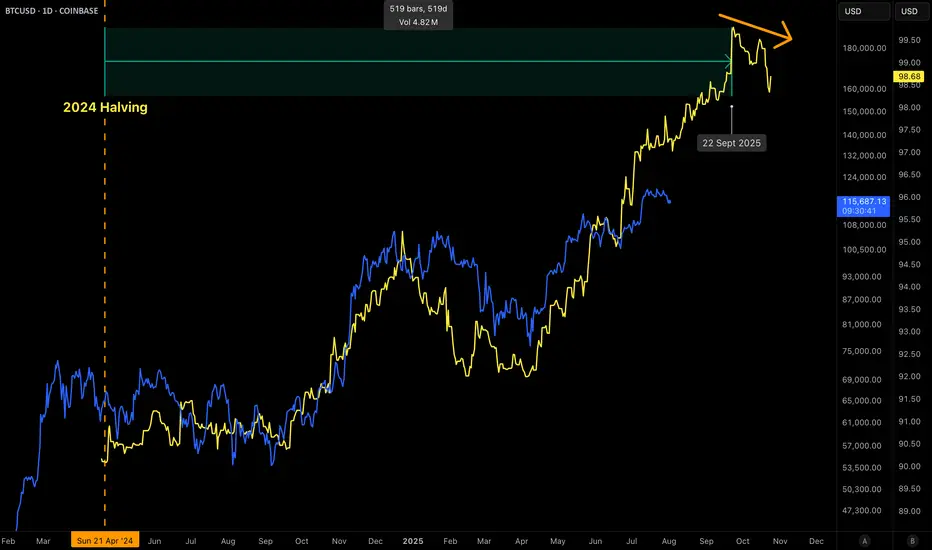
BITCOIN 2025 TOP PREDICTION!This chart represents the M2 Money Supply / BTCUSD correlation with an 84-day delay.
You can see that the M2 Money Supply has formed a double top (with a lower high) in late September.
The price of bitcoin tops out 525–532 days after the halving in every cycle.
What does this mean?
In my opinion, bitcoin will continue to follow the direction of M2 in a highly correlated manner. This would mean that BTC's top is only 2 months away.
What price will bitcoin top?
That I'm not entirely sure of yet. The M2 / BTC correlation can be placed in a plethora of different scales. However, it currently looks like the top will be BELOW $200,000.
I hope to be proven wrong, but as of right now, bitcoin is following previous cycles perfectly (excluding the fact that we created a new ATH prior the halving, this was because of ETFs).
Given diminishing returns (and assuming that "supercycle" is not reached), $135,000 - $190,000 top in late September makes sense.
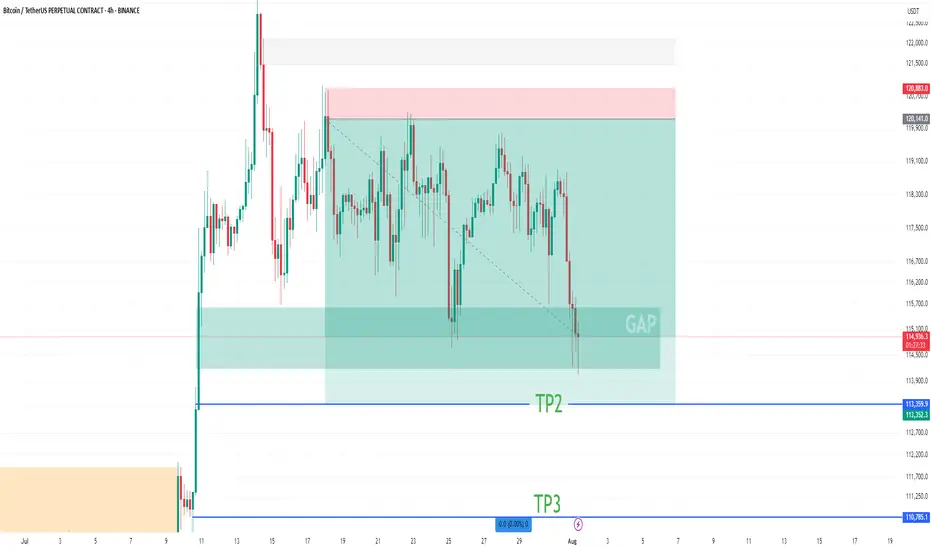
BTC Short Update Hello ❤️
Bitcoin
Let's have an update on Bitcoin analysis
💁♂️ First Target 🔥
Near Second Target
According to the analysis I posted on the page, Bitcoin touched the first target and is now near the second target
It is a good place to save profits. The price gap is filled
Please don't forget to like, share, and boost so that I can analyze it for you with more enthusiasm. Thank you. 💖😍
BITCOIN Current Update !!!we are heading towards support region around 116.8k-115k from where we can expect a reversal.
If price breaks down 115k level then a bat harmonic pattern is also forming which indicates it's PRZ at 113-112k region...
Remember 121k is key level which needs to be broken in order to remain bullish !!!
BTC to $1,000,000 by End of 2025? 📈 BTC to $1,000,000 by End of 2025? Here's a Macro View No One’s Charting Yet
While most are targeting $100K–$250K, this model suggests $1M BTC is possible — briefly — before global markets adjust.
🔎 Why?
Post-halving supply crunch is just starting to kick in
Sovereign wealth funds may rotate out of gold quietly
AI-run financial systems could hard-code BTC as a digital reserve
Institutional ETF demand hasn’t peaked — it’s still forming a base
🧠 The Twist:
If Bitcoin hits $1M, it won’t be because of retail.
It’ll be because the global financial system is silently being rewritten.
At that level, BTC becomes the benchmark, not the outlier.
Not advice. Just the next layer deeper.
📊 Agree? Disagree? Let’s chart it.
#BTCUSD #Bitcoin #Crypto #LongTermView #MacroTrading #HalvingCycle #TradingView
L1NK 0N BI0

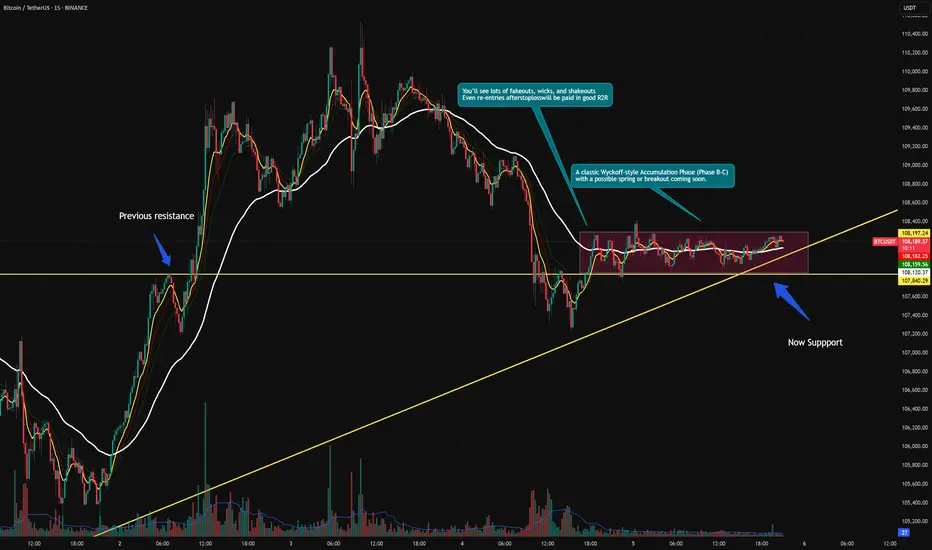
BTCUSDT – Accumulation Confirmed? Wyckoff Blueprint Playing Out Bitcoin continues to compress inside a defined range, resting above both a rising trendline and a former resistance turned support zone. This structure fits cleanly within a Wyckoff-style Accumulation Phase (B-C).
We’re now at a critical moment where smart money may be absorbing supply, preparing for the next phase.
🔍 Key Observations:
Range-bound price action with higher lows and muted volume
Spring-like wick and recovery from the bottom of the range
Support holding at prior breakout zone and ascending trendline
Structure shows signs of stealth accumulation with a possible breakout ahead
Sideways movement with fading volatility
Gradual compression within the range
Strong support defended multiple times (might make the support weaker as well !)
A potential spring/retest event may already be in play
You’ll see fakeouts, wicks, and hesitation in this phase — designed to trap weak hands. But the underlying behavior points to preparation, not distribution.
The quiet before the markup. Let the market reveal its hand. 📈
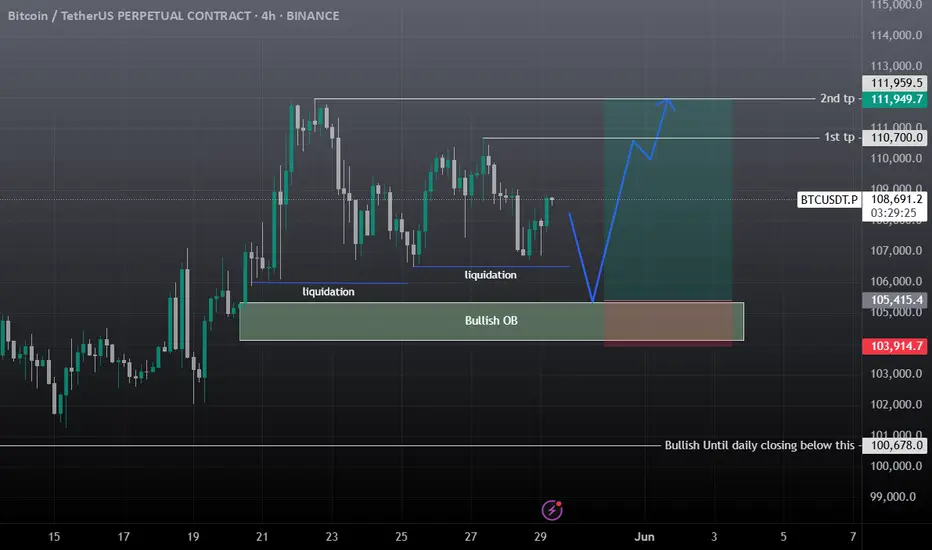
BTC Scalp Long / Buy SetupWait for the entry first, BTC must sweep the liquidation levels below side first then it should start pumping towards the tp, if it takes 2nd tp first then trade is not valid, if it takes first tp and then come back at entry level trade is still valid. if 4hr candle closing below the Bullish OB then close the position otherwise wick doesn't matter.
Long positions have achieved profits, BTC market outlook📰 News information:
1. Pay attention to the trend of gold and US bonds
📈 Technical Analysis:
At present, BTC has rebounded and profited, and rebounded to around 108,000 again. 109,000 is also the upper track of the Bollinger Band. There is a certain suppression in the short term. Before the suppression fails to break through effectively, BTC may still fall into a weak and volatile market. If BTC hits resistance and pressure above 108,000-109,000 during the day, you can consider shorting. In view of the current volatile market, everyone must strictly control their positions, use leverage prudently, and do a good job of risk management to cope with market uncertainties.
🎯 Trading Points:
SELL 108,000-109,000
TP 107,000-106,000-105,000
In addition to investment, life also includes poetry, distant places, and Allen. Facing the market is actually facing yourself, correcting your shortcomings, confronting your mistakes, and strictly disciplining yourself. I hope my analysis can help you🌐.
TVC:GOLD OANDA:XAUUSD FX:XAUUSD FOREXCOM:XAUUSD PEPPERSTONE:XAUUSD FXOPEN:XAUUSD
BTC 93k first or 120-124k end july, both possiblehere is my vieuw of Bitcoin for the next next 2-3 months,
i think btc can hit 93k before going to 120k+ but if market remains bullisch structure we might hit first 120-124k before going lower to 93,
its very possible we test 93k first then 120-124k and test 93k again so we print a double bottom there like i show on the chart, double bottom schould bring us slowley to 140k by begin-mid september,
people think bullrun tops in oktober-dec, all social media is expecting that but in crypto always the opposite happens what the massa think, i think cycle tops 2025 september.
we will go to 160k in q1 2026, but thats another story lets see how this play out first,
have a nice day all its just my vieuw of btc at the end is crypto and nobody knows
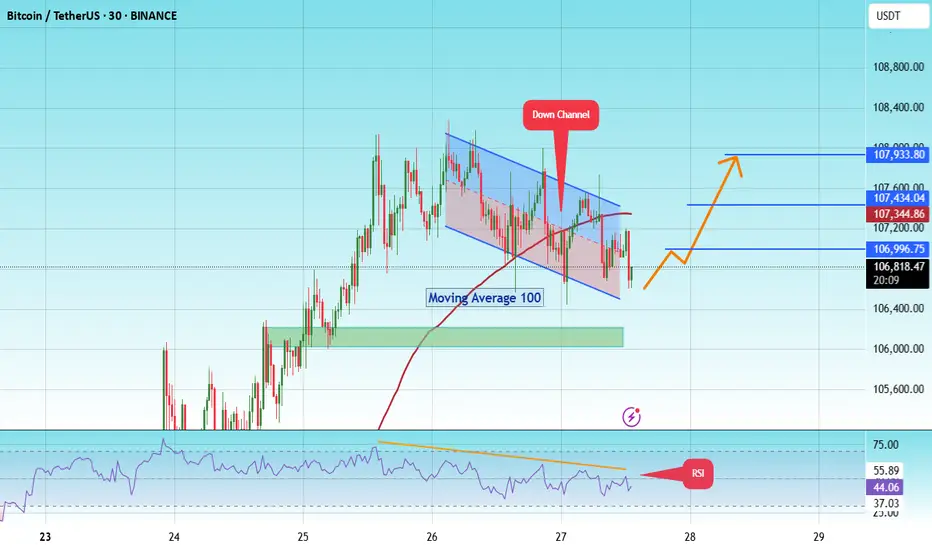
BITCOIN - Price can continue grow inside flat to $107933 level#BTC
The price is moving within a descending channel on the 1-hour frame and is expected to break and continue upward.
We have a trend to stabilize above the 100 moving average once again.
We have a downtrend on the RSI indicator that supports the upward move with a breakout.
We have a support area at the lower boundary of the channel at 106500, acting as strong support from which the price can rebound.
We have a major support area in green that pushed the price upward at 106000.
Entry price: 106736
First target: 106996
Second target: 107434
Third target: 107933
To manage risk, don't forget stop loss and capital management.
When you reach the first target, save some profits and then change your stop order to an entry order.
For inquiries, please comment.
Thank you.
Bitcoin Crash To $93k Incoming?!!!!I am discussing the bearish signs i am seeing right now on Bitcoin, and talking about the confirmations I want to see, that will confirm that Bitcoin is about to crash down to 93k!!!

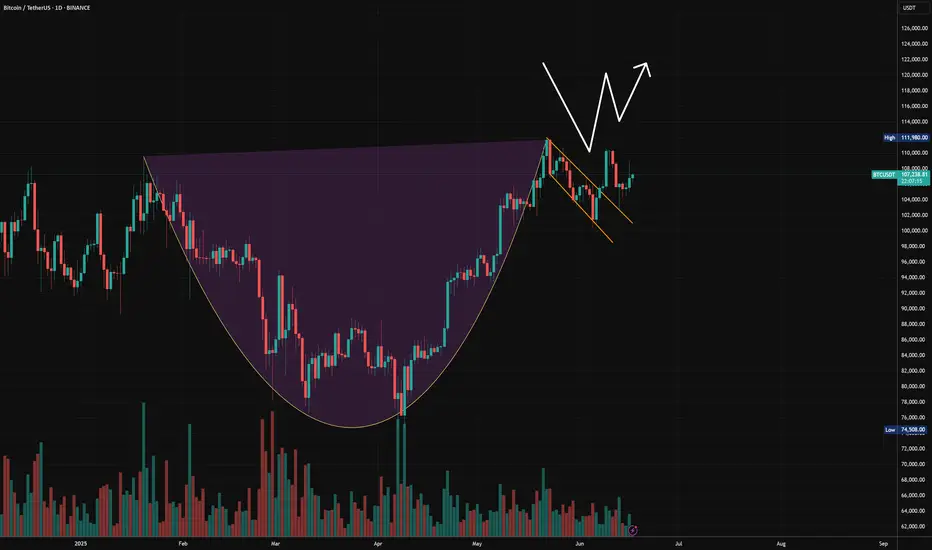
W pattern off the handle. #Bitcoin to 168K.From my most recent post of the Cup & Handle I see a W pattern. Price broke out of the handle to retest to confirm support creating a double bottom.
This is a very good sign to confirm the C&H for this bullish near future.
If we continue upwards and break the psychological resistance zone at 111K, I expect 168K within 3-6 months.
I attached the Cup and Handle analysis to the current.
#BTC/USDT#BTC
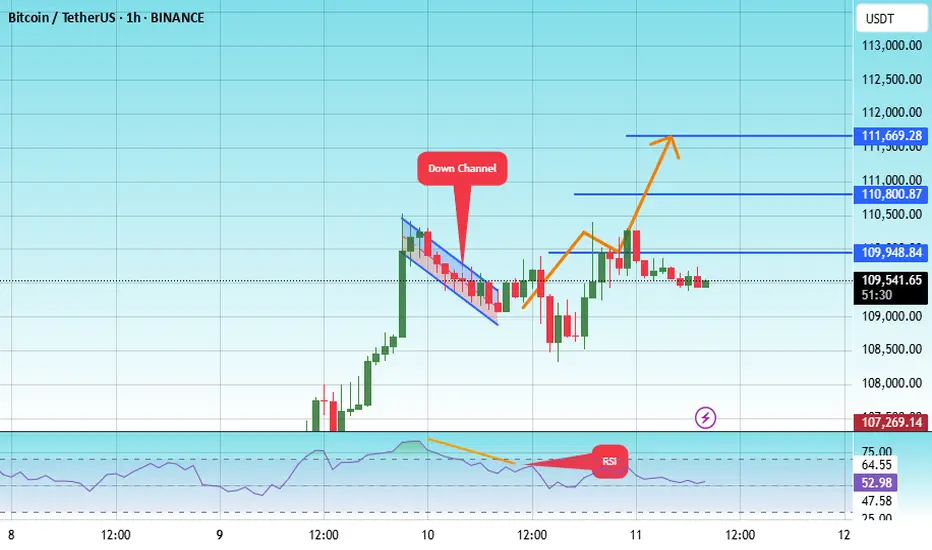
The price is moving within a descending channel on the 1-hour frame, adhering well to it, and is heading for a strong breakout and retest.
We are experiencing a rebound from the lower boundary of the descending channel. This support is at 108883.
We have a downtrend on the RSI indicator that is about to be broken and retested, supporting the upward trend.
We are looking for stability above the 100 Moving Average.
Entry price: 109380
First target: 109948
Second target: 110800
Third target: 111670
BTCUSDT Price Analysis – Potential Drop Incoming! 🔲 Chart Zones
🟥 Resistance Zone (~111,000–112,000):
Price has touched this zone multiple times and failed to break higher – this is a strong resistance area. 🚫📈
🟪 Support Zone (~101,000–102,000):
A historically strong demand area where price previously bounced up. 💪📉
🔍 Current Price Behavior
📊 Price Level: Around 108,666.66
🔄 The chart shows lower highs forming, indicating weakening bullish momentum.
📉 Bearish projection drawn (blue zigzag line) suggests a potential double top forming below resistance.
📉 What’s Expected?
🔵 Big Drop Alert! ⬇️
If the price fails to break above and gets rejected again, the chart predicts a sharp move down toward the support zone.
🎯 Target Area: ~101,000–102,000 (Support zone)
📌 Summary
🧱 Resistance holding strong
💤 Momentum slowing down
⚠️ Bearish move likely
🏹 Targeting support zone for potential bounce
⚠️ Trading Tip 🧠
Watch for confirmation before entering trades! A break below the recent lows could trigger a short opportunity, while a bounce near support could offer a buy setup. 🛑📈

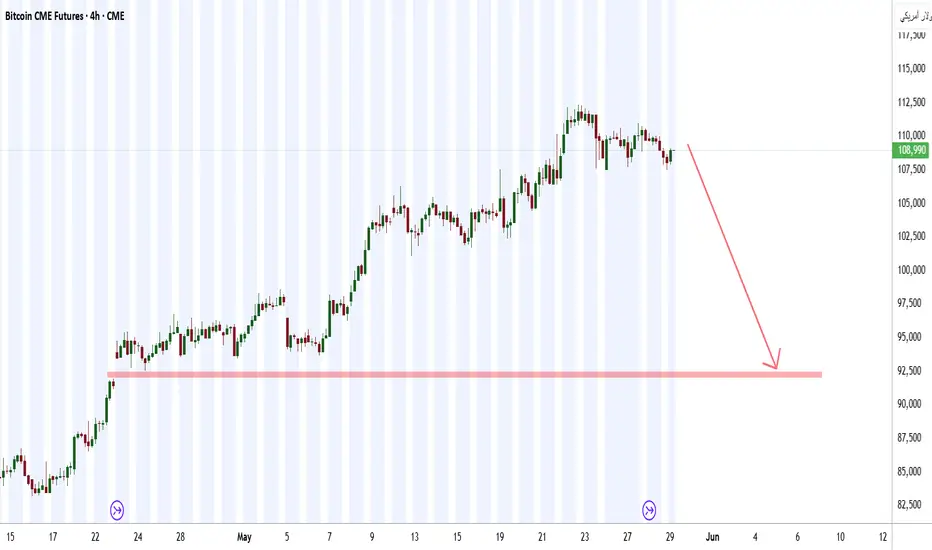
BTC CMA 92,000BTC CMA 92,000
We are currently at a temporary peak and strong, but not final, selling zone. We have a price gap reaching 92k, and a strong reversal to it is expected. Stay tuned for any new updates.
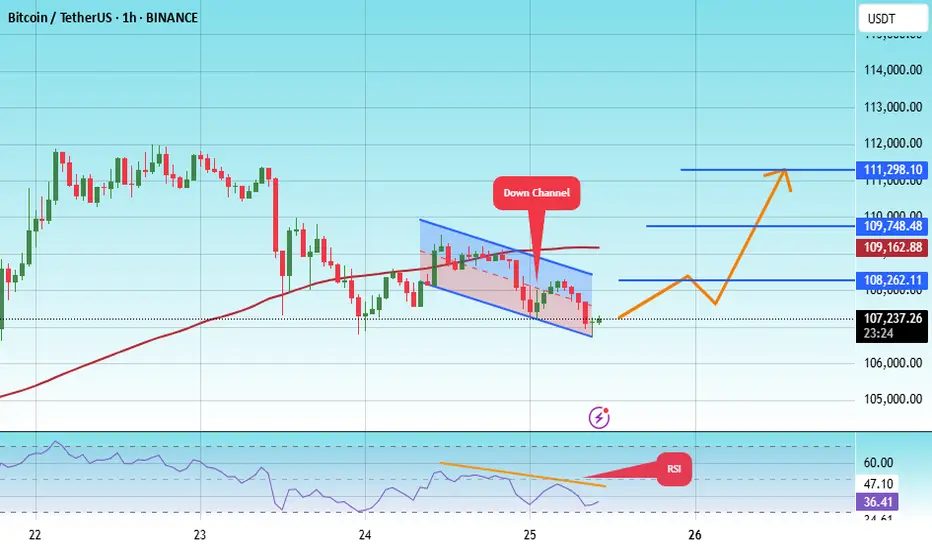
#BTC/USDT#BTC
The price is moving within a descending channel on the 1-hour frame, adhering well to it, and is on its way to breaking it strongly upwards and retesting it.
We are seeing a rebound from the lower boundary of the descending channel, this support at 106792.
We have a downtrend on the RSI indicator that is about to break and retest, supporting the upward trend.
We are looking for stability above the 100 moving average.
Entry price: 107234
First target: 108262
Second target: 109748
Third target: 111298
BTC DOMINANCEBitcoin dominance could break down at this point, potentially signaling the start of an exceptional altseason.

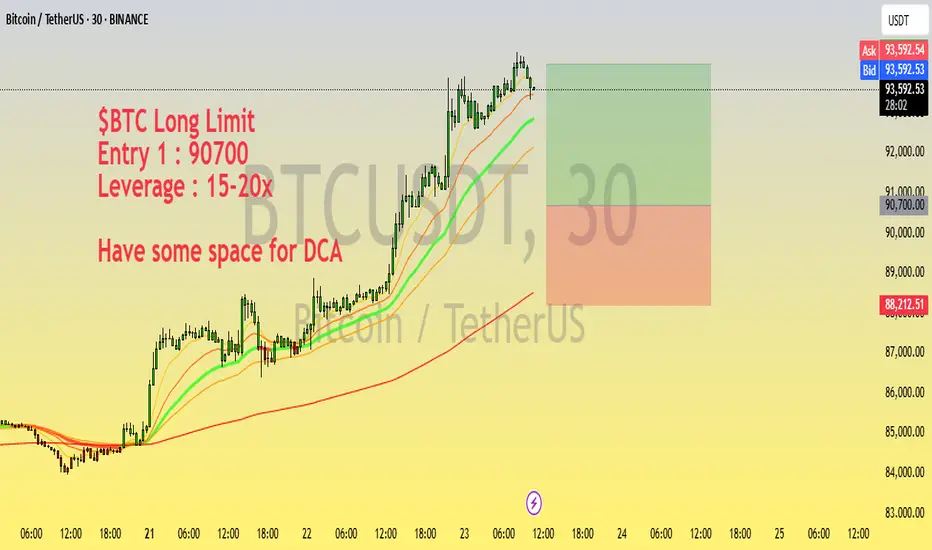
$BTC Long Setup | Entry @ 90700 | 15-20x Leverage | DCA FriendlyLooking to long BTC from the 90,700 zone with a high-conviction setup on support.
Trade Plan:
Entry 1: 90,700
Leverage: 15-20x
Setup: Price holding above key support with bullish structure forming on lower timeframes
Note: Leave room for DCA if price dips further
Monitor closely for reaction around support — tight SL recommended for capital protection.
Disclaimer: Not financial advice. DYOR and manage your risk accordingly.
#BTC/USDT#BTC
The price is moving within a descending channel on the 1-hour frame, adhering well to it, and is on its way to breaking it strongly upwards and retesting it.
We are seeing a rebound from the lower boundary of the descending channel, which is support at 82900.
We have a downtrend on the RSI indicator that is about to break and retest, which supports the upward trend.
We are looking for stability above the 100 moving average.
Entry price: 83240
First target: 85150
Second target: 86435
Third target: 87858
