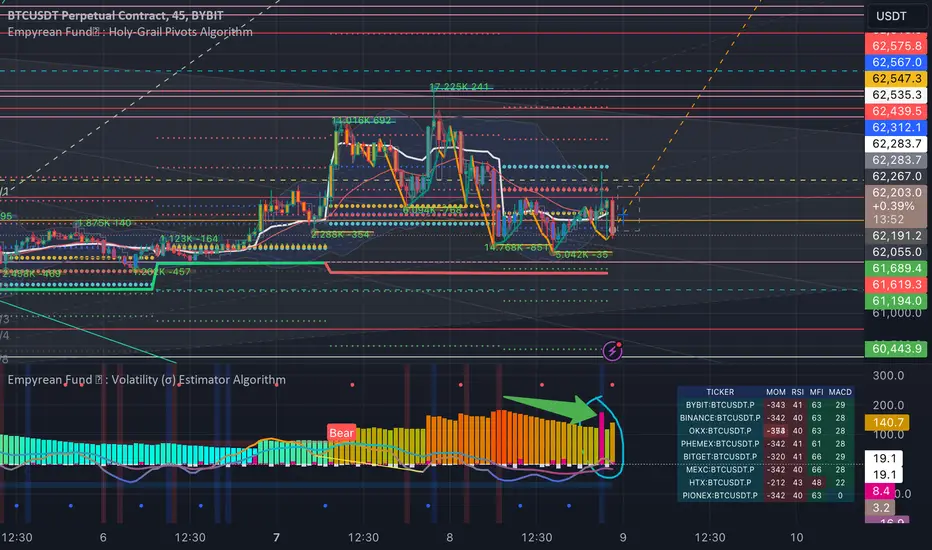
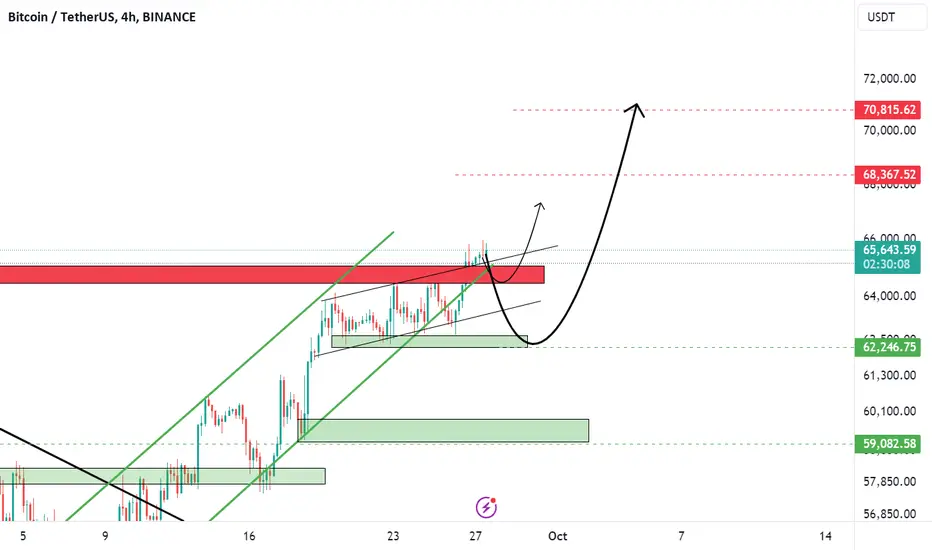
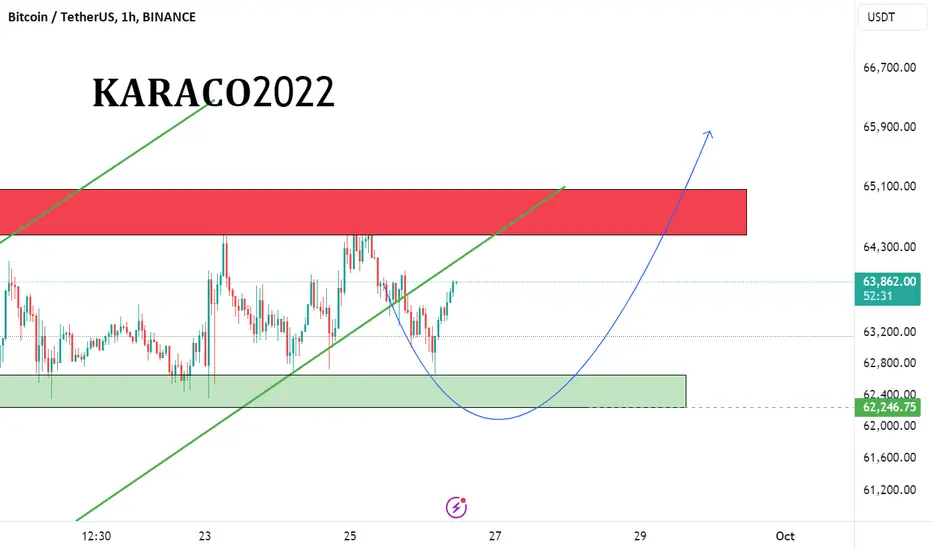
I think this whale is ready to pump at 62K perhaps to 65KFrom my analysis we are green for pamp but the whale is sitting duck, he made first entry but to test 63k if any follower, therefore he will dump to 62K before push this hard to 66K before exit market. Lets see
Btcudst
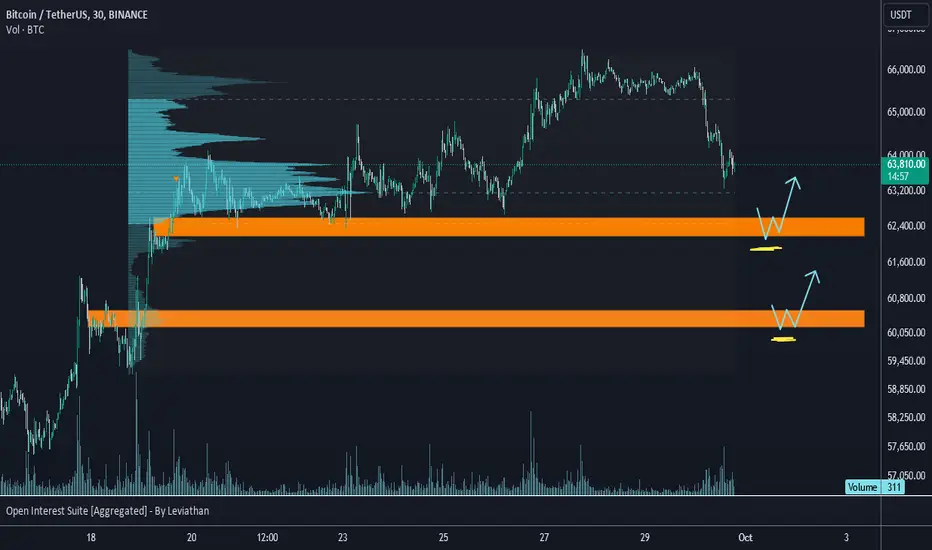
BTC AnalysisHello friends,
As you can see, BINANCE:BTCUSDT going down. I have eyes on two zones. First and my favorite is 60k. second ENTRY zone is 62k.
If price reach those zones, Big liquidation happens, and Open Interest raised, then I will open LONG position. Otherwise I will stay out of the market.
Cheers
$BTC DAILY ANALYSIS. IS THE BIG SHORT AT THE DOOR?As I expected in the analysis dated September 15, the link of which I left below, the price first retreated to 57,000 when it was at 60,000 and then continued its upward movement and reached the extreme supply area by taking the high that I expected to be liquidity.
It is quite normal for the price to slow down in this area. Since the price is currently in the decision phase, taking trades in lower time frames may end up as stop loss. The internal structure is still bullish and I think the demand area that the price is currently in may react upwards. Then, if I see bearish momentum to kick in and an entry model in the 4H time frame, I will look for sells.
Another scenario is using the 70,000 high as liquidity, which is a bit unlikely imo, and then the price falling with a strong bearish momentum. As long as 72000 is not exceeded, and I would expect a daily candle closure above, I think the first range that the price will likely to go is 49000 - 44000.

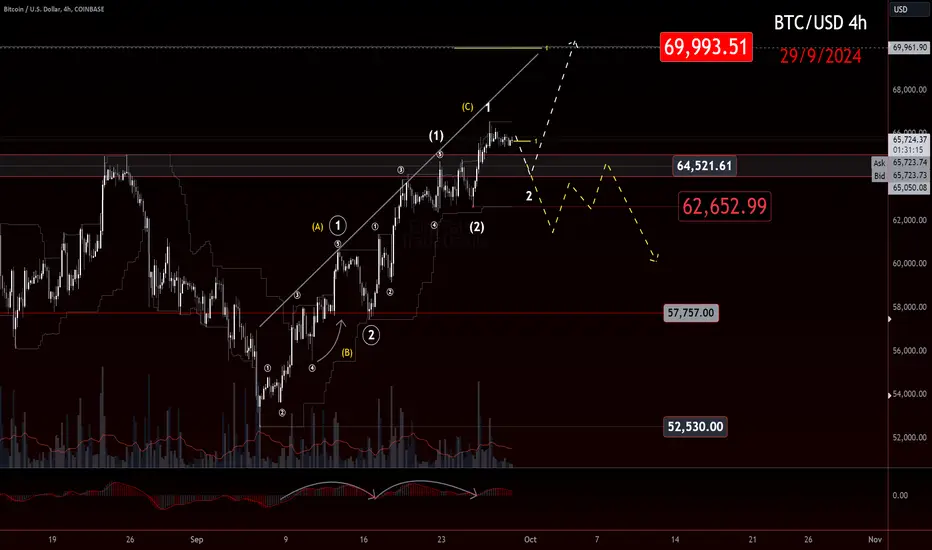
Bitcoin coming down or continuation? Levels to watch!If you find this information inspiring/helpful, please consider a boost and follow! Any questions or comments, please leave a comment!
Still in from 57775
Lost entry from 52752 to human error.
Levels of interest (LOIs) ⏰
70k: next pivot.
64.5k: Bulls want up away or a flip!
Break below, possible resist.
62.6k: Break kills 3rd 1,2. Larger corrective?
57757: Break = bulls 🫣
Trade Safe.
Trade Clarity.
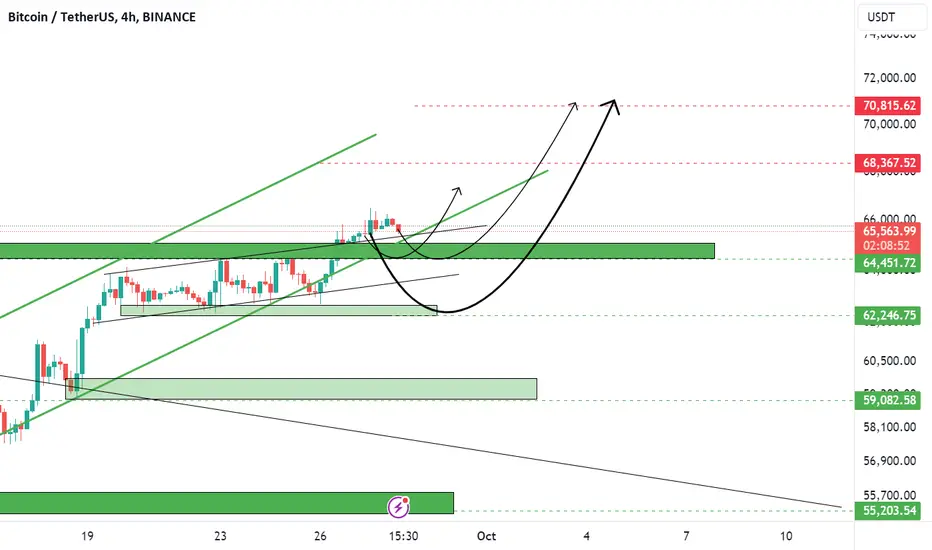
Was Bitcoin Growth Fake?Bitcoin is now correcting after breaking the important resistance of 65,000 and as long as it can hold at 62,000 and 59,000 there is no need to worry.
Therefore, we can hope for a green tomorrow for the cryptocurrency market, but in any case, it is better to be careful and take small and safe steps.
Bitcoin analysis today The possibility of correction How to enteBitcoin finally managed to reach the important and psychological price of 65,000.
Upon reaching this range, it is natural for some people to save and profit, and it is natural for loss limits to be activated in this range.
Therefore, we can have the possibility of correction from this support range, especially with negative divergence.
In this analysis, as shown in the chart, the support ranges were determined and its possible movement was also investigated.
Bitcoin analysis today Today's important news Is Bitcoin pumped?In today's analysis of Bitcoin, we mentioned the most important resistance from the successive attacks of this digital currency.
Even though Bitcoin reached its most important resistance, we did not see much retreat from this currency, and this can be a sign of hope to break this important resistance.
The support ranges of Bitcoin are the prices of 62,000 and 60,000, respectively, which support this currency.
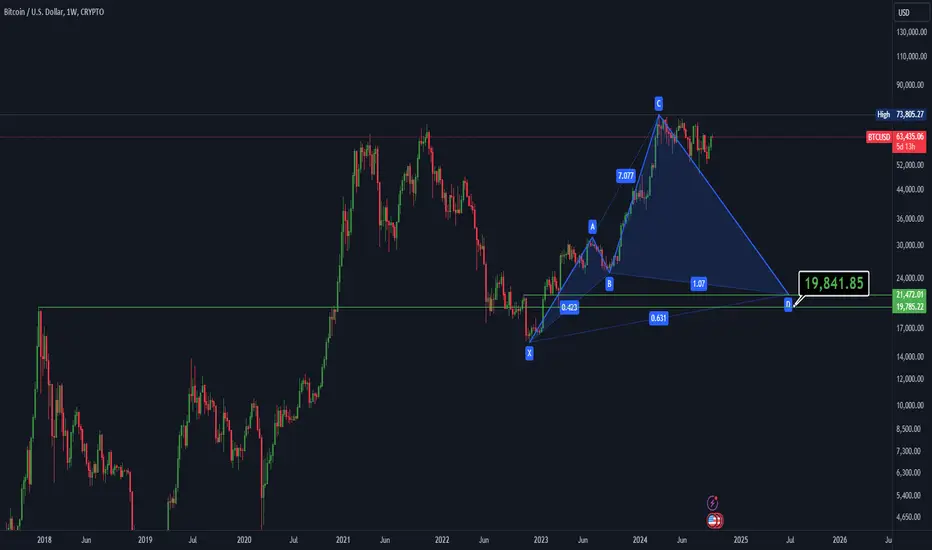
One simple analysis of BTC priceHello guys, here is some simple analysis of BTC price and we're expecting. We're preparing for deep crash on all the markets, not just Crypto. In our opinion in the most optimistic case, we can expect BTC bottom around $19k in worst around $10k.
Bitcoin analysis today Pump after the failure of 65 thousand or In today's Bitcoin analysis, we reported the most important move and decision of this currency.
Breaking 65000 means the beginning of a strong growth for Bitcoin and not breaking this price means another correction...
On the other hand, in the Dominance Tether review, we announced the support of this index and the possibility of its small growth, which if it cannot break its resistance, will be considered as a spark for a further fall and the growth of the digital currency market.
Also, we determined the important support and resistance ranges in the worst case and gave our opinion as a guide for you companions.
We also talked about the possible movement of Bitcoin in the next 24 hours.
Watch this analytical video for more details.

#BTC/USDT#BTC
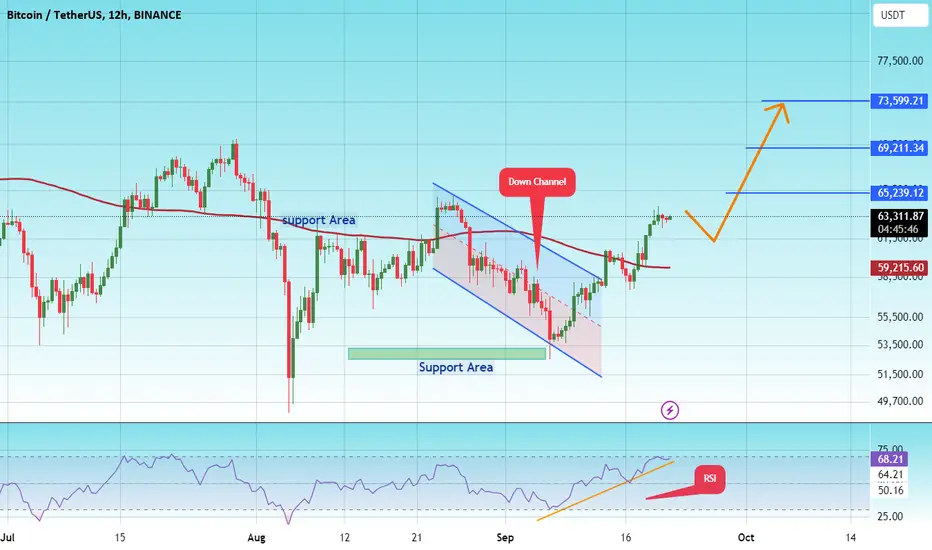
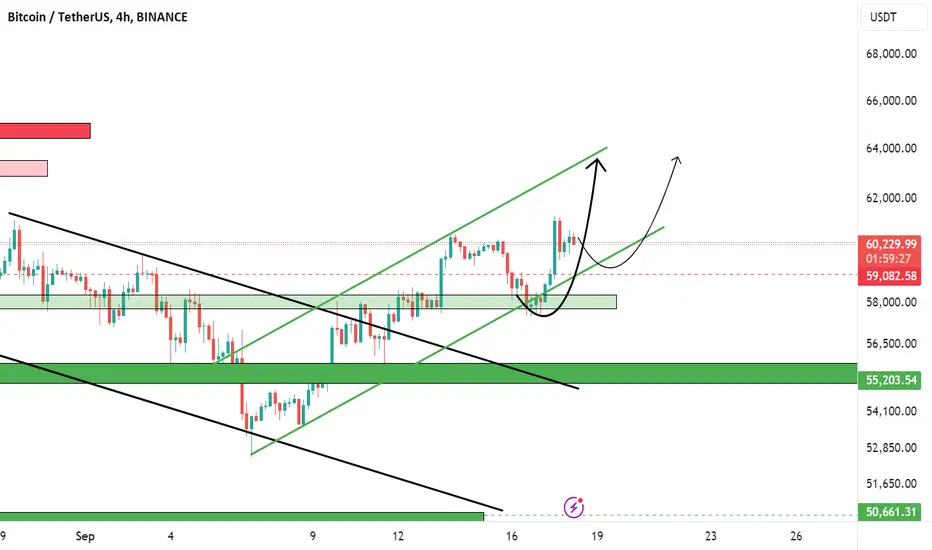
The price has broken the descending channel on the 12-hour frame upwards and is expected to continue
We have a trend to stabilize above the moving average 100 again
We have an upward trend on the RSI indicator that supports the rise by breaking it upwards
We have a support area at the lower limit of the channel at a price of 53000
Entry price 62000
First target 65240
Second target 69200
Third target 73600
BTC Bitcoin Technical Analysis and Trade Idea👀 👉 BTC has recently broken market structure to the upside, signalling a potential bullish opportunity. The breakout is evident on both the daily and 4-hour charts, suggesting a buying setup could be forming. In this video, we’ll analyse market structure, price action, and focus on the prevailing trend. We’ll also highlight a potential trade setup, contingent on the price action aligning with our outlined scenario.
**Disclaimer:** This content is for educational purposes only and should not be interpreted as financial advice. 📊✅

#BTC/USDT
#BTC
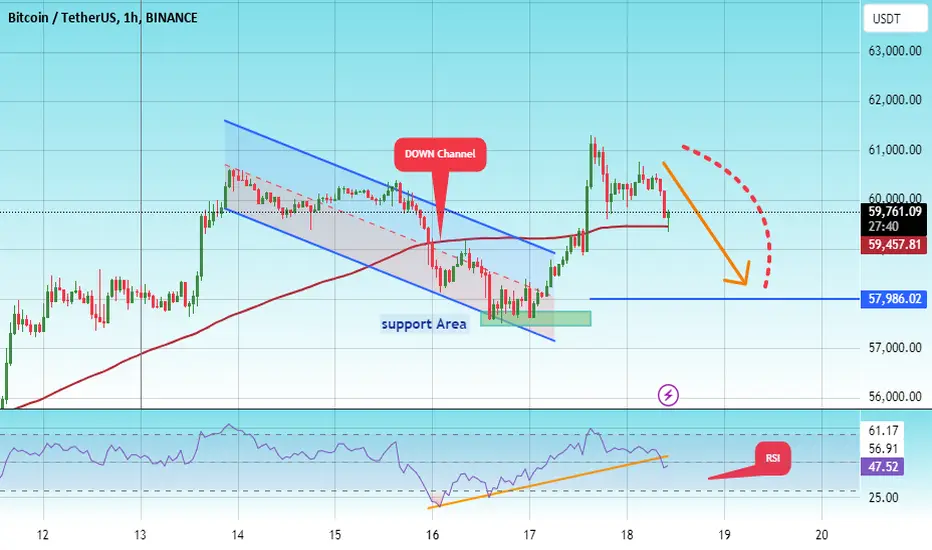
The price broke the descending channel on the 4-hour frame upwards but the broken channel is expected to be retested
Also, the 100 moving average is broken again
We have an uptrend on the RSI that is expected to be broken
We have a support area at the lower limit of the channel at 57700
Entry price 59700
Target 57980
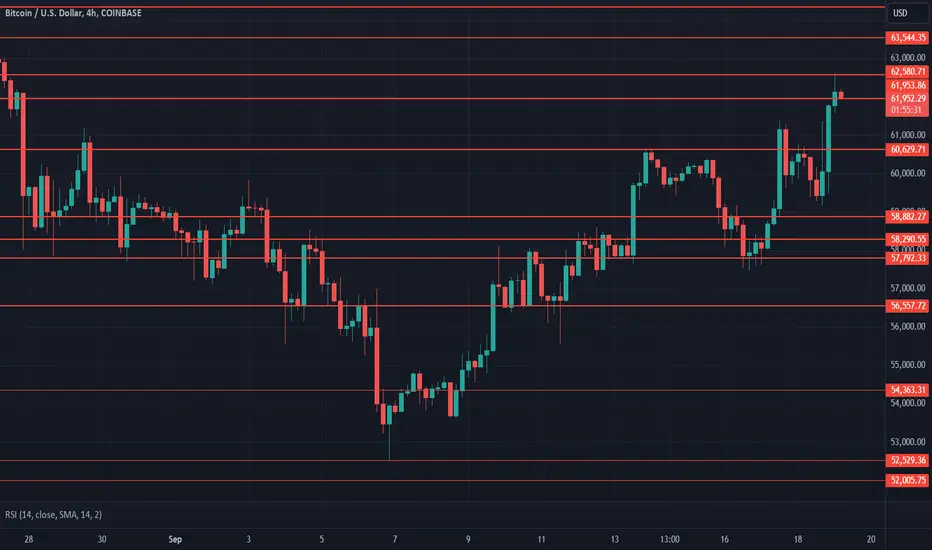
$BTC Daily UpdateCRYPTOCAP:BTC #BTC broke out of $62,629, testing $62,580, breakout retest pending, haven't yet established new support and currently struggling at $61,953-$62,580. Beautiful follow up to bullish engulfing on previous 1D close, needs to establish a strong support at $62,580-$63,544 to avoid fakeout.
Bitcoin analysis today Dominance says to be careful Bitcoin and In today's analysis of Bitcoin, we talked about its most important resistance, which is currently facing this resistance.
If this important resistance is broken, we can see Bitcoin grow in the first step to 70,000, which we discussed in this video about how to reach this price.
On the other hand, we examined Dominance Tether in this analysis and talked about the fact that nothing special has happened yet because Dominance Tether is still on its support.
We talked about today's news, what effect it will have on Bitcoin and the possible movement of Bitcoin in the next 24 hours.
BTCUSDT - Bullish MomentumBINANCE:BTCUSDT is showing bullish momentum after following a retracement. Currently price has broken several lower highs on 1 and 4 hr timeframe. Expecting the bullish momentum to continue!

SasanSeifi| BITCOIN: Will a Pullback Lead to Lower Levels?Hey there, ✌
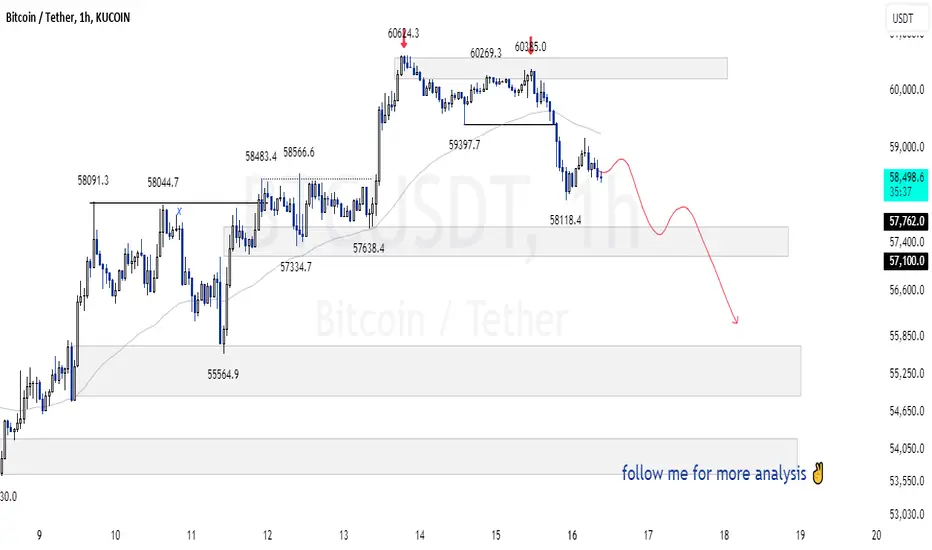
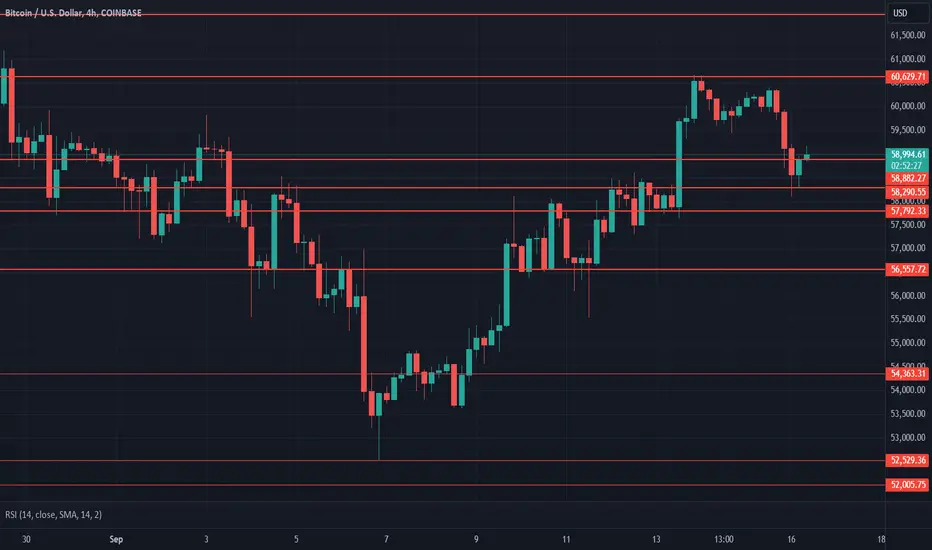
Bitcoin is currently trading around the $58,500 range. Given the lack of stabilization above the $60,000 level, we could be facing a bearish trend. Additionally, with the recent break below the $59,300 mark, the short-term outlook on the 1-hour chart appears bearish.
We expect that after completing a pullback, the price may move towards the corrective targets of $57,500, $57,000, $56,700, and $56,000.
❌ Key resistance levels to watch are around $59,000 and $59,700.
💢 Keep in mind that this is just my personal perspective and not financial advice. I’d love to hear your thoughts and exchange ideas!
Good luck and happy trading! ✌😎
Feel free to reach out if you have any questions – I’m here to help!✌
$BTC Daily UpdateCRYPTOCAP:BTC #BTC $60,629 resistance held strong, $58,290 support in effect rn, current 1D looking bullish, last weekly close put bullish engulfing - expect $64,344 test if followed thru. RSI on 4H looks fine, continue watching given S/R
BTCUSDPair : BTCUSD ( Bitcoin / U.S Dollar )
Description :
Completed " 12345 " Impulsive Waves
Break of Structure
RSI - Divergence
Bullish Channel as an Corrective Pattern in Short Time Frame
Demand Zone

BTC BITCOIN Technical Analysis and Trade Idea👀 👉 In this video, we explore BTC, which has recently exhibited bearish momentum with a break of structure on the 4-hour time frame. The pair has pulled back and is now retracing into a critical resistance level. I see potential for further downside and am closely monitoring whether the price holds below the current range low. If a breakout occurs, I plan to enter a sell position, as explained in the video. However, if the price action doesn't align with the discussed setup, there will be no trade.
It's essential to understand that these insights are speculative and not guaranteed predictions. Confirming specific price actions before entering any trades is crucial, as emphasised in the video. The analysis offers an in-depth look at the current trend, market structure, and price behaviour. Remember, this content is for educational purposes and does not guarantee success. Trading involves significant risks, so always implement strong risk management strategies. 📈✅

BTCUSDPair : BTCUSD ( Bitcoin / U.S Dollar )
Description :
Completed " 12345 " Impulsive Waves
Break of Structure
RSI - Divergence
Rising Wedge as an Corrective Pattern in Short Time Frame and Breakout of Lower Trend Line
Demand Zone

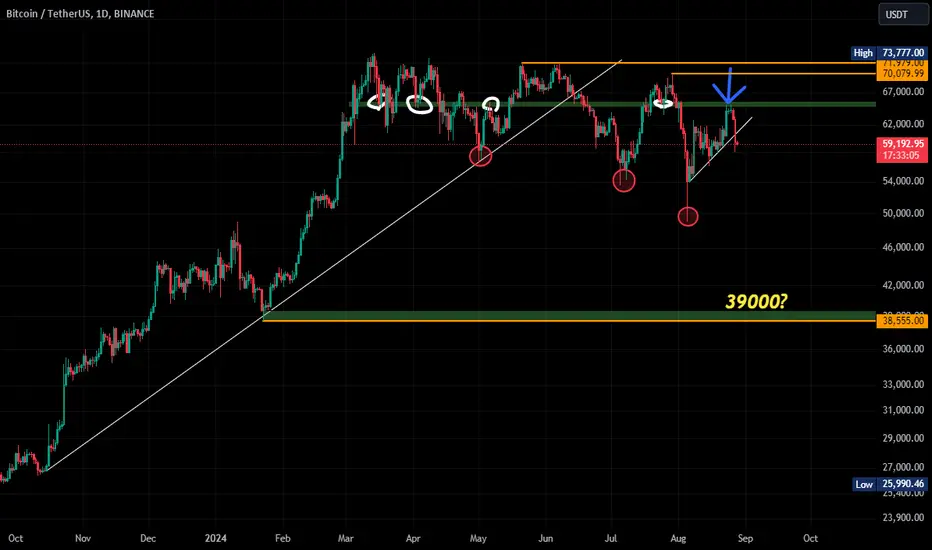
I think Bitcoin can reach $39,000I think Bitcoin can reach $39,000, after that, we can comment again. Market trends can change
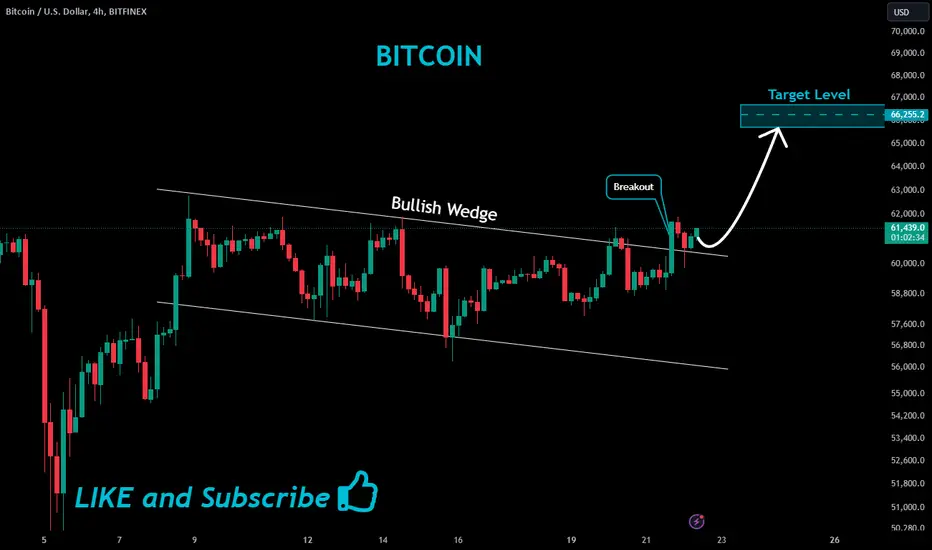
BITCOIN Bullish Bias! BITCOIN is trading in an
Uptrend and the pair has
Formed a bullish flag
Pattern so as the pair
Is breaking out we
Are bullish biased
And we will be expecting
A further move up !
Bitcoin analysis - short term idea (longer term included)I've been on a losing streak recently for day trades, but I am optimistic about this trade idea! As illustrated in the chart (90 minute chart), the price of bitcoin is holding steady above $58k (last weeks value high). The orderbook also shows strong bids appearing at this price level (Green dashed line). The first visit to this level resulted in a sustained move up on Tuesday. This is a good sign that shows price is accepting this zone(58k to 62k) and is stabilizing/balancing within it. Just about an hour ago, the green dashed line was revisited. This also cleans up Monday's value area low. Based on this, I am positioned long. See chart for entry, target and stop loss.
This short term Bitcoin trade idea is backed by my longer term analysis I posted a little over a week ago. Chart link below for that.
Boost and follow for more ideas! Thanks!
