Today's Bitcoin Signal: Time to be braveHello friends🙌
Given the good price movement from support and buyers entering, now we can enter the position with capital and risk management and move with it to the specified targets.
🔥Join us for more signals🔥
*Trade safely with us*
Btcupdate

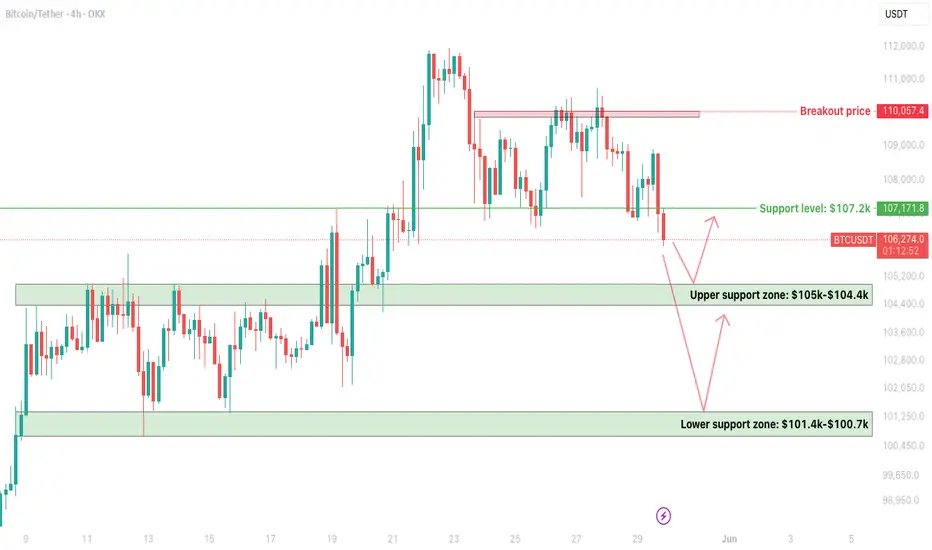
BTC 4H – Critical Support Zones Being TestedCRYPTOCAP:BTC is currently retesting its $107.2k support, which has now turned into resistance after a decisive breakdown.
Support Levels to Watch:
- Upper Support Zone: $105k – $104.4k
- Lower Support Zone: $101.4k – $100.7k
Bounce from $104.4k–$105k will be a temporary relief, but it needs strength to reclaim $107.2k.
If the upper zone is not held, the next leg will be towards the lower zone, near $101.4k—$100.7k.
Breakout confirmation only above $110k (previous rejection zone).
The market is showing signs of weakness, especially with increased selling around resistance. Avoid rushing into trades—better setups may come if key zones hold or break.
Tip: Watch for bullish divergences or strong volume at the lower support for potential reversal setups.
Bitcoin Rally Overextended: Patience is Key for the Next Move💹 BTC/USDC – Bullish Outlook, heres my Trade Plan.
Bitcoin (BTC/USDC) is currently maintaining a strong bullish trajectory 🚀, showing impressive momentum after breaking through recent resistance levels 🔓.
However, price is now overextended from the last swing low, and I’m anticipating a pullback into value 🔄 — specifically targeting the 50%–61.8% Fibonacci retracement zone drawn from the latest swing low to swing high 📐. This zone often acts as a rebalancing point for institutional traders and provides confluence for smart entries 🎯.
I’ll be closely watching this retracement area for signs of support forming, and more importantly, a bullish break in market structure 🧠📊. Only after that confirmation, would I consider executing a long position — no structure break, no trade ✅.
This isn’t about predicting — it’s about reacting with discipline.

Bitcoin Approaches Resistance as Momentum Cools: What’s Next?Bitcoin has been on a strong upward trend 🚀, but recent moves show signs of exhaustion as it approaches major resistance zones 🛑. The appearance of a three-drive pattern on the 4-hour chart, suggests the market could be due for a healthy correction 🔄. While the broader trend remains bullish, I'm watching for a potential pullback and then looking for renewed strength (bullish BoS) before considering new long positions. Patience and confirmation are key in these conditions! 👀✨

Bitcoin Price: HODL Mode Fuels $140K ATH PushBitcoin, the pioneering cryptocurrency, is once again at the forefront of financial discussions, exhibiting a remarkable display of resilience and strength that points towards an imminent surge to uncharted price territories. The current market narrative is dominated by several compelling indicators: a significant increase in long-term holders, a climbing realized capitalization, the inherent stability provided by its difficulty adjustment mechanism, and a pervasive return to "HODL mode" among investors. These factors, combined with recent price action and expert analyses, suggest that Bitcoin is not just preparing for new all-time highs but is solidifying its position as a mature and indispensable asset in the global financial landscape.
Long-Term Holders Strengthen Their Grip: A Foundation for Future Growth
One of the most telling indicators of Bitcoin's underlying strength and investor conviction is the behavior of its long-term holders (LTHs). These are addresses that have held their Bitcoin for an extended period, typically over 155 days, signaling a strong belief in its future value rather than short-term speculation. Recent data reveals a significant uptick in the number of these steadfast investors, indicating a profound shift in market sentiment. This trend is critical because it removes a substantial portion of the circulating supply from immediate selling pressure, creating a scarcity that naturally supports price appreciation.
The "HODL mode" phenomenon, a term coined from a misspelling of "hold" in a 2013 forum post, perfectly encapsulates this behavior. It describes the strategy of buying and holding cryptocurrencies regardless of price fluctuations, driven by a long-term bullish outlook. The return of this "HODL mode" is not merely anecdotal; it is quantifiable through on-chain metrics. When long-term holders accumulate and resist selling, it signifies a collective conviction that current prices do not reflect Bitcoin's true intrinsic value or future potential. This behavior creates a strong psychological floor for the price, as fewer coins are available for sale on exchanges, making it harder for large sell-offs to occur.
Complementing this, Bitcoin's Realized Cap has been climbing to uncharted territory. The Realized Cap is a variation of market capitalization that values each Bitcoin at the price it was last moved on-chain, rather than its current market price. It essentially represents the aggregate cost basis of all coins in circulation. When the Realized Cap climbs, especially to new all-time highs, it indicates that a significant amount of Bitcoin has been acquired at higher prices and is being held, suggesting that the overall market is holding onto its coins with stronger conviction. This metric serves as a robust measure of the network's fundamental value and the collective cost basis of its investors. Its ascent to new peaks underscores the increasing capital flowing into Bitcoin and the growing confidence among those holding it. This phenomenon is often observed during bull markets, as new capital enters the ecosystem and existing holders refuse to sell, signaling a healthy and maturing market.
The strengthening grip of long-term holders and the rising Realized Cap collectively paint a picture of a market that is fundamentally sound and poised for sustained growth. It suggests that Bitcoin is moving from a speculative asset to a more mature store of value, attracting investors who are less concerned with short-term volatility and more focused on its long-term potential as a digital asset.
Bitcoin's Difficulty Adjustment: The Engine of Predictable Monetary Policy
One of Bitcoin's most ingenious and often underestimated features is its difficulty adjustment mechanism. This self-regulating system ensures that new blocks are found, and thus new Bitcoin are mined, at a remarkably consistent rate of approximately every 10 minutes, regardless of the total computational power (hash rate) dedicated to the network. Every 2,016 blocks, or roughly every two weeks, the network automatically adjusts the difficulty of the mining puzzle. If more miners join the network, increasing the hash rate, the difficulty increases, making it harder to find the next block. Conversely, if miners leave, the difficulty decreases.
This mechanism is the bedrock of Bitcoin's predictable monetary policy. Unlike traditional fiat currencies, whose supply can be arbitrarily increased by central banks, Bitcoin's supply schedule is immutable and transparent. The difficulty adjustment ensures that the issuance of new Bitcoin remains consistent until the total supply of 21 million coins is reached. This predictability is a cornerstone of Bitcoin's value proposition as a sound money alternative. It eliminates the uncertainty and potential for inflation that plagues fiat currencies, making Bitcoin a reliable store of value over the long term.
The consistent block time and predictable supply schedule, enforced by the difficulty adjustment, contribute significantly to Bitcoin's appeal as a deflationary asset. Investors are drawn to assets with a finite and transparent supply, especially in an era of unprecedented global monetary expansion. This mechanism not only secures the network from external attacks by making it prohibitively expensive to manipulate but also instills confidence in its long-term scarcity and value. It is this algorithmic certainty that underpins Bitcoin's potential to become a global reserve asset, providing a stark contrast to the discretionary policies of central banks.
Why are Bitcoin and Crypto Prices Going Up Today?
The recent surge in Bitcoin and broader cryptocurrency prices can be attributed to a confluence of factors, many of which are interconnected with the underlying strength discussed above. Bitcoin's impressive climb past $107,000 and its break above $108,000 at the start of the week are not isolated events but rather manifestations of building bullish sentiment.
One primary driver is the return of institutional interest and capital inflows. As Bitcoin matures and gains regulatory clarity in various jurisdictions, traditional financial institutions are increasingly comfortable allocating capital to the asset class. This institutional adoption provides significant buying pressure and lends legitimacy to the market. The establishment of Bitcoin ETFs in various regions, for instance, has opened new avenues for institutional investors to gain exposure without directly holding the underlying asset.
Secondly, the macroeconomic environment continues to play a pivotal role. Persistent inflation concerns, coupled with the potential for further quantitative easing by central banks, drive investors towards scarce assets like Bitcoin as a hedge against currency debasement. The narrative of Bitcoin as "digital gold" gains traction during periods of economic uncertainty, attracting both retail and institutional capital seeking to preserve purchasing power.
Thirdly, technical indicators are flashing strong buy signals. Bitcoin's weekly chart, for instance, is flexing significant strength. A sustained break above key resistance levels, such as the $108,000 mark, often triggers further buying as traders and algorithms recognize the bullish momentum. The return of "HODL mode," as evidenced by the behavior of long-term holders, further reduces selling pressure, allowing prices to climb with less resistance. This combination of fundamental strength and technical breakouts creates a powerful upward spiral.
Finally, anticipation of future events also fuels price rallies. The upcoming June 11 CPI report, for example, is being closely watched by analysts. Inflation data can significantly impact market sentiment, and a favorable report (e.g., lower-than-expected inflation) could signal a more dovish stance from central banks, potentially leading to increased liquidity and risk-on appetite, which benefits Bitcoin. An analyst has even suggested that the Bitcoin price could "explode" after the CPI report, indicating the market's sensitivity to such macroeconomic releases.
Bitcoin Chart Pattern, Return of ‘HODL Mode’ Point to Imminent All-Time BTC Price High
The technical analysis of Bitcoin's price charts, combined with on-chain data indicating a return to "HODL mode," strongly suggests that an imminent all-time high (ATH) is on the horizon. Chart patterns are crucial tools for traders and investors to identify potential future price movements based on historical data. When Bitcoin breaks above significant resistance levels, especially after a period of consolidation, it often signals the start of a new upward trend. The recent break above $108,000 is a prime example of such a breakout, indicating that the market has absorbed previous selling pressure and is now ready for higher valuations.
The "HODL mode" phenomenon, as discussed earlier, is a powerful fundamental indicator that reinforces technical signals. When a large proportion of the circulating supply is being held by long-term investors who are unwilling to sell, it creates a supply shock. This reduced selling pressure means that even moderate buying interest can lead to significant price increases. This is particularly true when new capital enters the market, as it encounters a much thinner order book on the sell side. The confluence of a bullish chart pattern and the return of "HODL mode" creates a self-reinforcing cycle: technical breakouts encourage more HODLing, which in turn reduces supply and facilitates further breakouts.
Analysts are increasingly confident that these combined factors point to an imminent all-time high for BTC. The previous all-time high serves as a psychological and technical barrier, but once breached, it often transforms into a new support level, paving the way for further price discovery. The current market structure, characterized by strong accumulation by long-term holders and a clear upward trajectory on the charts, suggests that the path of least resistance for Bitcoin is upwards.
Bitcoin Weekly Chart Flexes Strength—Is The Moonshot Just Getting Started?
Looking at Bitcoin's weekly chart provides a broader perspective on its long-term trend and current momentum. The weekly chart smooths out daily volatility, revealing more significant patterns and trends. Currently, Bitcoin's weekly chart is indeed flexing considerable strength, characterized by consistent higher lows and higher highs, strong closing prices, and increasing trading volume during upward movements. This sustained bullish momentum on a longer timeframe suggests that the current rally is not a fleeting pump but potentially the beginning of a more substantial "moonshot."
The term "moonshot" in crypto parlance refers to a rapid and significant price increase, often to unprecedented levels. While such parabolic moves can be speculative, the current strength on Bitcoin's weekly chart appears to be fundamentally driven. The accumulation by long-term holders, the predictable supply schedule enforced by the difficulty adjustment, and the increasing institutional adoption all contribute to a more sustainable upward trajectory. This is not just about short-term trading gains; it's about a fundamental revaluation of Bitcoin's role in the global financial system.
The question of whether the "moonshot" is just getting started implies that the current price levels are merely a stepping stone to much higher valuations. This perspective is supported by the fact that Bitcoin is still in its relatively early stages of global adoption compared to traditional asset classes. As more individuals, corporations, and even nation-states begin to integrate Bitcoin into their financial strategies, the demand will continue to outstrip the limited supply, fueling further price appreciation. The weekly chart's strength provides a visual confirmation of this underlying bullish narrative, suggesting that the journey to new price frontiers is indeed well underway.
Bitcoin Price Could Explode After June 11 CPI Report, Says Analyst
The highly anticipated June 11 CPI (Consumer Price Index) report is poised to be a significant catalyst for Bitcoin's price action. The CPI is a key economic indicator that measures the average change over time in the prices paid by urban consumers for a market basket of consumer goods and services. It is a primary gauge of inflation, and its release often triggers significant market reactions across all asset classes, including cryptocurrencies.
An analyst's prediction that Bitcoin's price could "explode" after the CPI report highlights the market's sensitivity to inflation data. If the CPI report comes in lower than expected, it could signal that inflationary pressures are easing, potentially leading central banks to adopt a more dovish monetary policy (e.g., interest rate cuts). Lower interest rates reduce the opportunity cost of holding non-yielding assets like Bitcoin, making them more attractive to investors. Conversely, if inflation remains stubbornly high, it could reinforce Bitcoin's narrative as an inflation hedge, also potentially driving its price up as investors seek refuge from fiat currency debasement.
The market's reaction to such reports is often driven by expectations. If the report aligns with or exceeds dovish expectations, it could lead to a surge in liquidity and risk appetite, benefiting Bitcoin. Conversely, an unexpectedly hawkish report could lead to short-term volatility. However, the overarching sentiment among many analysts is that even in a hawkish scenario, Bitcoin's role as a hedge will continue to attract capital. The June 11 CPI report is therefore a critical event that could provide the immediate impetus for Bitcoin's next major price movement, potentially validating the "moonshot" thesis.
Bitcoin Price Will See ‘Short-Term Correction’ Before $140K: Analysts
While the overall sentiment for Bitcoin is overwhelmingly bullish, some analysts predict a "short-term correction" before the price initiates a rally to all-time highs above $140,000. This perspective is not necessarily bearish; rather, it reflects a healthy market dynamic. Corrections are a natural part of any asset's price discovery process, allowing the market to consolidate gains, shake out overleveraged positions, and attract new buyers at slightly lower price points.
A short-term correction typically involves a temporary pullback in price after a significant upward move. This can be triggered by profit-taking from early investors, macroeconomic news, or technical resistance levels. Analysts who foresee such a correction often view it as a necessary reset that builds a stronger foundation for the next leg of the rally. For instance, a drop could see Bitcoin retest key support levels that were previously resistance, confirming their strength before moving higher.
The prediction of a correction before reaching $140,000 suggests that while the long-term outlook is incredibly strong, the path to new all-time highs may not be a straight line. Such a correction could present an excellent buying opportunity for those who missed the initial surge or wish to increase their holdings. It also aligns with the idea of a healthy market that allows for organic growth rather than unsustainable parabolic pumps. The $140,000 target itself is a significant psychological and technical level, and reaching it would mark a substantial milestone for Bitcoin, further solidifying its position as a premier digital asset.
The Return of Altcoin Season: Why Bitcoin Dominance Must Fall To 62%
As Bitcoin continues its ascent, the conversation often shifts to the broader cryptocurrency market, specifically the potential for an "Altcoin Season." Altcoin Season refers to a period when altcoins (cryptocurrencies other than Bitcoin) experience significant price appreciation, often outperforming Bitcoin. For an Altcoin Season to truly kick off, analysts often point to a crucial prerequisite: a decrease in Bitcoin's dominance.
Bitcoin dominance (BTCD) measures Bitcoin's market capitalization as a percentage of the total cryptocurrency market capitalization. Currently, Bitcoin's dominance is relatively high, reflecting its recent strength and the capital flowing into it. However, for altcoins to flourish, capital needs to flow from Bitcoin into other cryptocurrencies. This typically happens when Bitcoin has made significant gains, and investors begin to seek higher returns in riskier, smaller-cap altcoins.
The specific threshold of Bitcoin dominance falling to 62% is often cited as a key indicator for the start of Altcoin Season. When Bitcoin's dominance drops to this level or lower, it suggests that a substantial amount of capital is rotating out of Bitcoin and into altcoins, signaling a broader market rally. This rotation is a healthy sign of market maturation, as it indicates that investors are diversifying their portfolios and recognizing the value proposition of other blockchain projects.
The return of Altcoin Season would signify a broader bullish trend across the entire cryptocurrency ecosystem. It would mean that the value proposition of decentralized finance (DeFi), non-fungible tokens (NFTs), and various Layer 1 and Layer 2 solutions built on other blockchains is gaining traction. While Bitcoin remains the undisputed king, a thriving altcoin market indicates a robust and diversified digital economy. The anticipation of this shift further underscores the dynamic and evolving nature of the cryptocurrency market, where Bitcoin's strength often paves the way for the growth of the entire ecosystem.
In conclusion, Bitcoin stands on the precipice of a new era of growth, driven by a powerful synergy of fundamental strength, technical indicators, and evolving market dynamics. The unwavering conviction of long-term holders, evidenced by a climbing Realized Cap and a pervasive "HODL mode," forms a robust foundation. The predictable monetary policy enforced by the difficulty adjustment mechanism instills unwavering confidence in its scarcity. Recent price surges, fueled by institutional interest and macroeconomic tailwinds, underscore its immediate bullish momentum. While a short-term correction may be on the cards, it is viewed as a healthy precursor to an explosive rally towards and beyond the $140,000 mark. Furthermore, Bitcoin's continued strength is expected to eventually pave the way for an "Altcoin Season," signaling the maturation and diversification of the broader crypto market. For investors and
enthusiasts alike, ignoring Bitcoin's current trajectory would be to miss a pivotal moment in the ongoing digital revolution, as it solidifies its grip on the financial future.
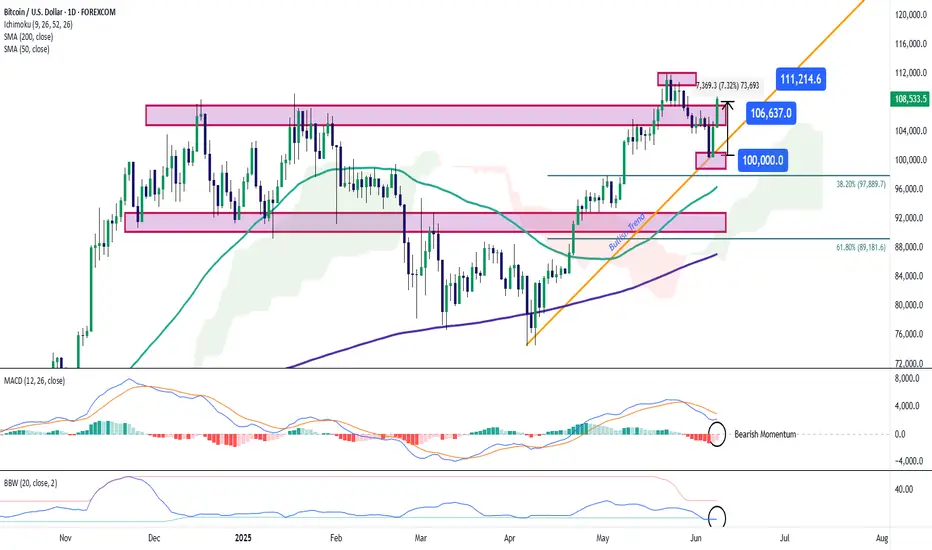
Bitcoin Approaches the $110,000 Zone Once AgainBitcoin has seen a strong bullish surge in recent trading sessions, climbing more than 7% and now trading back above $108,000 per BTC. The buying bias has been consistently fueled by the announcement from Metaplanet, which plans to raise over $5 billion to acquire Bitcoin — a move that has temporarily restored short-term confidence in the market. As euphoria continues to build in the short term, buying pressure may become increasingly relevant in the upcoming trading sessions.
New Uptrend Line Forming
Following recent upward movements, a new bullish rebound has formed on the chart, initiating a consistent uptrend as price action nears historical highs once again. If buying pressure remains stable, this emerging trendline could gain greater relevance in the short term.
MACD
The MACD histogram continues to oscillate below the neutral 0 line, which suggests that the primary market momentum still lies in bearish territory. If the histogram keeps showing lower values, the previously dormant selling pressure could begin to regain strength.
Bollinger Bands Width
The line measuring the width of the Bollinger Bands remains at low levels, indicating a steady decline in long-term average volatility. If this behavior persists, it could signal the beginning of a consolidation phase in Bitcoin’s price during the next few sessions.
Key Levels to Watch:
$111,000 per BTC: Previous all-time high zone. A breakout above this level could strongly reactivate the bullish bias and open the door to a more aggressive uptrend in the short term.
$106,000 per BTC: Nearby support that may serve as a buffer against potential selling corrections in the sessions ahead.
$100,000 per BTC: A key psychological support level, aligned with recent local lows. Price action falling below this level could put the current bullish formation at risk.
Written by Julian Pineda, CFA – Market Analyst
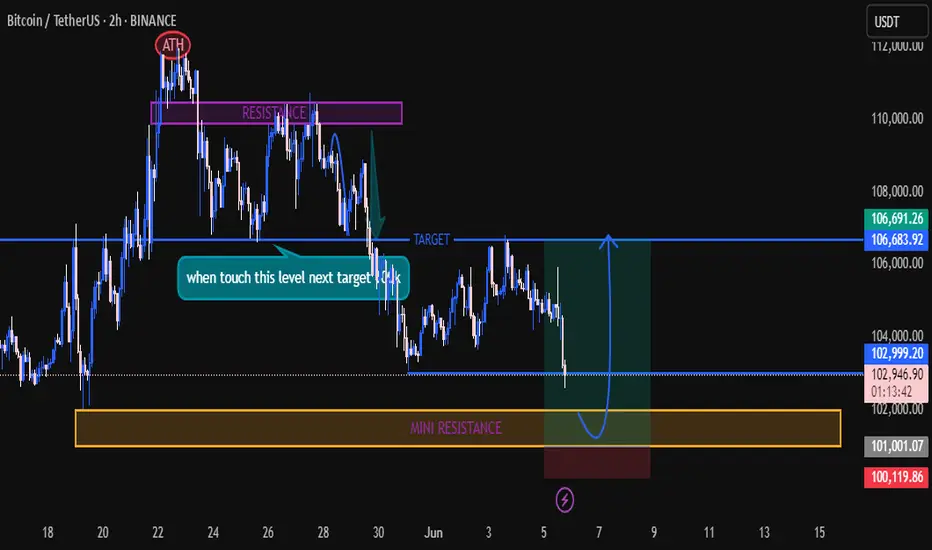
Bitcoin (BTC/USDT) 2-hour chart, focused on the buy side only!📊 Chart Overview
The chart shows BTC/USDT on the 2-hour timeframe, featuring clear levels of resistance, mini-resistance, and target zones. Let’s break down the buy idea:
🚀 Key Zones & Levels
💜 Resistance Zone (Purple Box):
Historical price ceiling.
Price dropped from this area several times.
🟦 Target Zone (Blue Line):
106,691 - 106,683 USDT.
Target for the next bullish move!
🟧 Mini Resistance (Yellow Box):
Around 102,000 USDT.
Acting as support (buy zone!) now.
💰 Buy Setup & Entry Area
✅ Buy Zone:
Just below 103,000 USDT, aligning with the mini resistance / support box (yellow).
✅ Entry Level:
Between 102,000 - 103,000 USDT.
Best if price consolidates or forms a reversal candle here.
🟢 Target:
First target: 106,000 USDT
Next major target: 106,683 - 106,691 USDT.
📉 Stop Loss:
Below 101,000 USDT for protection.
🎯 Trading Plan
1️⃣ Wait for a bullish reversal candlestick at the mini resistance box (~102,000 - 103,000 USDT).
2️⃣ Enter long (buy) position.
3️⃣ Target profit at 106,000 and 106,691 USDT.
4️⃣ Stop below 101,000 to manage risk.
⚡️ Summary
🟢 Buy: At mini resistance (~102,000 - 103,000).
🎯 Targets: 106,000 - 106,691.
❌ Stop: 101,000.
🚀 Let's ride the bullish wave! 💹📈🟢
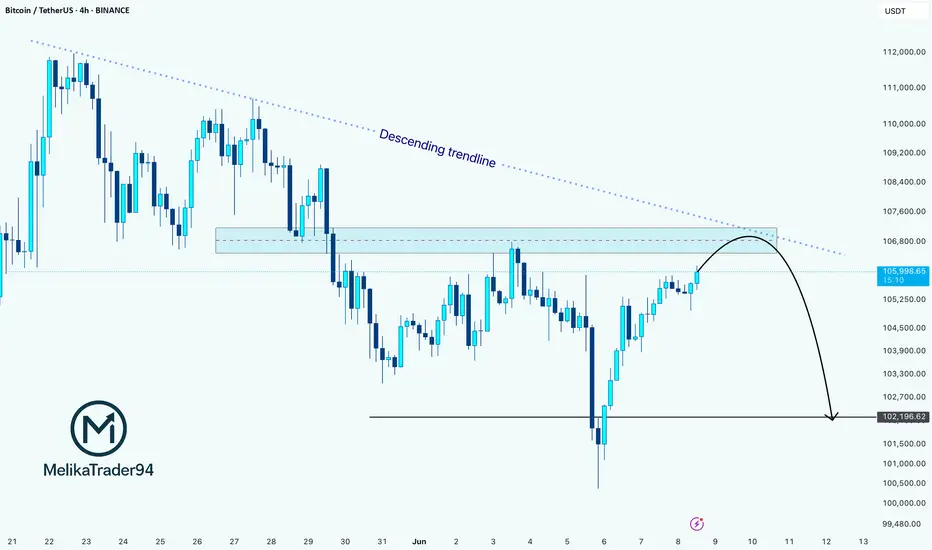
BTC Testing Major Resistance >>> Rejection Likely?Hi guys!
Did you see my last analysis about Btc? Let's break it down more!
Bitcoin is now testing a major resistance zone around $106.8K, where a descending trendline has already pushed the price down several times.
This area could act as a reversal point again. If BTC fails to break above, we might see a move down toward $102.2K — a strong support level from earlier this month.
Right now, the market is showing signs of weakness near resistance, so this could be a good spot to watch for a short setup — unless bulls step in with strong volume and break out cleanly.
attention to these levels:
Resistance: $106.8K (trendline + supply zone)
Support target: $102.2K
Outlook: Bearish unless breakout confirmed
BTCUSDT: Your Next Move? The Blue Box OpportunityAlright, focusing on BTCUSDT. This blue box is a critical buying zone.
The market's recent moves demand clarity. You need to know where genuine opportunity lies, avoiding the traps that catch most traders.
I've identified this blue box as a prime area where demand could ignite. But don't just jump in. Here's the plan:
Watch the Volume Footprint: Is there real accumulation, or just noise?
Spot CDV Divergences: Hidden strength often appears here, even if price looks weak.
Confirm on LTF: A clear breakout above minor resistance, followed by a retest as support, is your green light.
Be vigilant for liquidity hunts – those quick dips that shake out weak hands before a real move. If this blue box holds, and we get these confirmations, my bias is firmly upwards.
I only focus on assets with sudden, significant volume increases. BTCUSDT's current setup, combined with this potential volume, makes it a high-interest play.
Keep a very close eye on this blue box. Understanding these subtle signals means you can navigate these intricate dynamics, securing your position for potential gains. Miss this, and you might regret it.
📌I keep my charts clean and simple because I believe clarity leads to better decisions.
📌My approach is built on years of experience and a solid track record. I don’t claim to know it all but I’m confident in my ability to spot high-probability setups.
📌If you would like to learn how to use the heatmap, cumulative volume delta and volume footprint techniques that I use to determine very accurate demand regions, you can send me a private message. I help anyone who wants it completely free of charge.
🔑 On my profile, you can find an extensive track record spanning hundreds of analyses and many examples of my strategies in action. To keep things concise here, I'm sharing just a few of my most recent successful calls as a small snapshot of my ongoing work:
📊 FLOKIUSDT - +%100 From Blue Box!
📊 TRXUSDT - I Do My Thing Again
📊 OGNUSDT | One of Today’s Highest Volume Gainers – +32.44%
📊 TIAUSDT | Still No Buyers—Maintaining a Bearish Outlook
📊 Simple Red Box, Extraordinary Results
Feel free to check out my TradingView profile for all of them; listing everything here would genuinely take too long! 😉

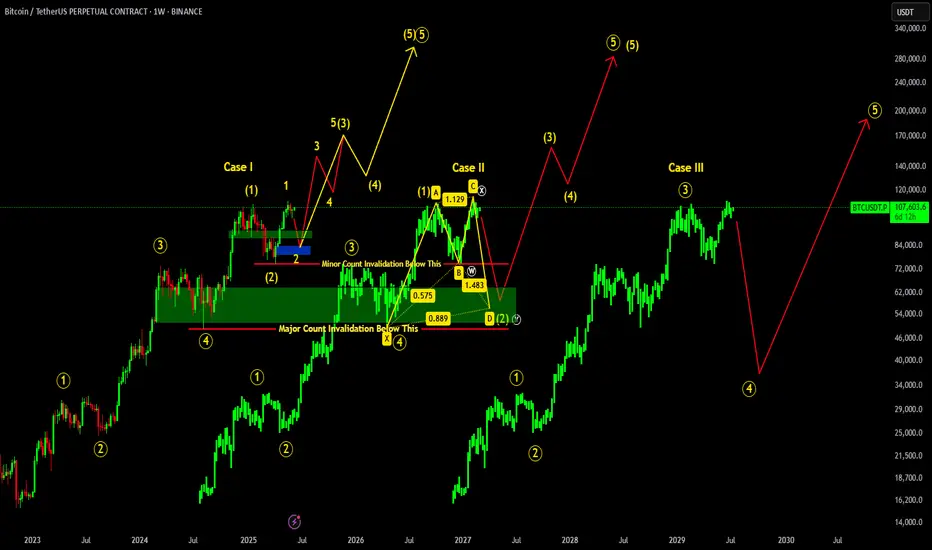
BITCOIN ROAD TO 300K !!! ELLIOTT WAVE CASE STUDYThere are three possible cases for Bitcoin which we can now consider according to Elliot wave count on big picture:
Case I: According to this count if we hold above 74.5k , recent low, we may see major shift in BTC. Retracement Up to 92-79k is good which will form inverse head & shoulders, potentially breaking ATH up to 170K, if things goes well & 74.5K region remains on hold.
Case II: If in case 74.5K region breaks, then it will invalidate minor count causing BTC to retrace more up to 64-52K major reversal zone region. If such thing happens, bullish shark pattern will be formed causing major reversal from that region BUT 49K region should remained hold!!!
Case III: Worst case scenario if 49K region breaks, then it will cause major count invalidation dropping BTC further up to 45-33K region.
It didn’t reject. It repriced.BINANCE:BTCUSDT just tested the 4H OB at 105,044 — and didn’t break. That’s not weakness. That’s precision. The kind of structure Smart Money doesn’t chase, it absorbs.
Here’s the breakdown:
Price retraced into a clean OB off the 0.236 fib, holding structure without even needing to sweep the BPR below
Volume supported the move — no absorption, no deviation
Short-term high is now marked at 106,487, and above that, my next draw is 108,941
If price closes back above 106,000 with momentum, the path of least resistance is clear: continuation. If we lose the OB and reclaim fails, BPR becomes the fallback zone — anything deeper, and we’re re-evaluating the narrative.
Execution plan:
Long from OB (already tested) — continuation depends on reclaiming 106K
TP1: 106,689
TP2: 108,941
Invalidation: 103,429 (50% fib) or hard break into 102.7 BPR
There’s no “maybe” in structure. Price is either reacting or it isn’t. This one is.
Setups this precise don’t wait — they’re mapped. You’ll find more in the profile description.

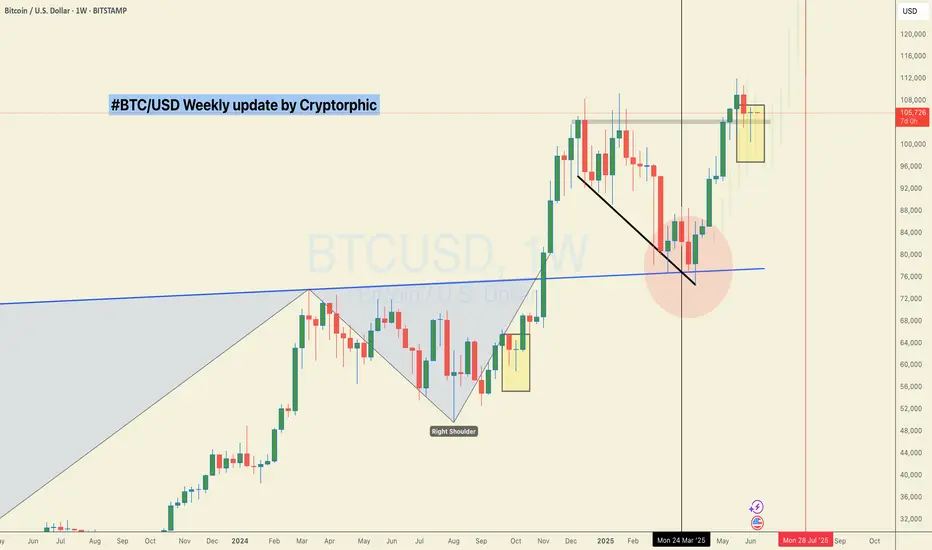
#BTC/USD Close Fight but bulls win! $117K Still in sight!CRYPTOCAP:BTC Weekly Update:
BTC closed the week up by just 0.08%, leaving behind a long wick and a tiny body, forming a Dragonfly Doji, one of the strongest candlestick patterns, signalling a fierce battle between bulls and bears.
✅ This time, the bulls won by a small margin, but a win is a win.
✅ BTC successfully held its key support.
✅ The CC is green, which is a positive sign.
The price action remains choppy, but the trend is still pushing upward from here.
Invalidation:- Weekly Close below $100k
What do you think?
Do let me know in the comments section. And please hit the like button.
Thank you
#PEACE
Going parabolic before topping in October?In the last 133 days of the 18 bars or about 548 days from last halving , price has gone parabolic before topping at the 0.382 fib level. Things might get volatile in the coming months.

Will BTCUSD see $90,000 ever again? Phoenix FX mid term analysisBTCUSD 4-Hour Outlook: The Week Ahead
🔴 Key Resistance Zones
First Resistance
$107 000–$108 500
Recent swing highs where price stalled before the last leg down. Clearing and closing above $105 000 on the 4H would open the door toward this zone.
Final Resistance
$111 000–$113 000 (If broken expect a run to $115,000)
The all-time-high area. Heavy sell-side liquidity lives here and past price action shows repeated FVG fills and wicks into this region.
🔵 Critical Support & Buy Zones
Discount Buy Zone:
$92 000–$89 000 (50% at $89 150)
A deeper weekly FVG and longer-term trend support. The ultimate “buy the dip” area if the premium zone gives way.
Premium Buy Zone:
$100 000 – $99 000 (50% at $99 450)
A 4H Fair Value Gap that aligns with our higher-timeframe trend support. The recent bounce here signals strength—and a possible launchpad back into resistance.
📊 Weekly Price Action Scenarios
Bullish Theory:
If BTC can close cleanly above $105 000 on the 4H, look for a run into $107 000–$108 500 (First Resistance). A follow-through push could then target $111 000–$113 000 (Final Resistance) by week’s end with a potential further move to $115 000 where the 8 year trend will be tested again.
Bearish Theory:
Failure to reclaim $105 000, or a clear rejection in the $107 000–$108 500 zone, could usher in a retest of the Premium Buy Zone (~$100 000). A break below $99 000 would shift focus toward the Discount Buy Zone around $92 000–$89 000.
💡 Trade Ideas for the Week
Potential Long Ideas
Entry: 4H candle close above $105 000
Targets: First take-profit at $108 500; stretch target $112 000–$113 000
Stop-Loss: Below $103 000
Zone Re-Entry Long
Entry: Bullish 4H candle close in $100 000–$99 000
Targets: $107 000 then $112 000
Stop-Loss: Below $97 500
Potential Short Ideas
Entry: Bearish price action (e.g., engulfing candle or wick rejection) in $107 000–$108 500
Targets: $100 000→$92 000
Stop-Loss: Above $109 000
Just a Heads-Up:
This is my take on the charts—not gospel, not financial advice, and definitely not a crystal ball 🔮.
Trading is part skill, part patience, and part “what just happened?” 😅
We all see things a little differently, and that’s the beauty of it.
So if you’ve got a hot take, wild theory, or just want to drop some chart wisdom—hit the comments!
Let’s grow, learn, and laugh through the madness together. 🚀📈
Each one, teach one.
— Phoenix FX Team 🔥🦅

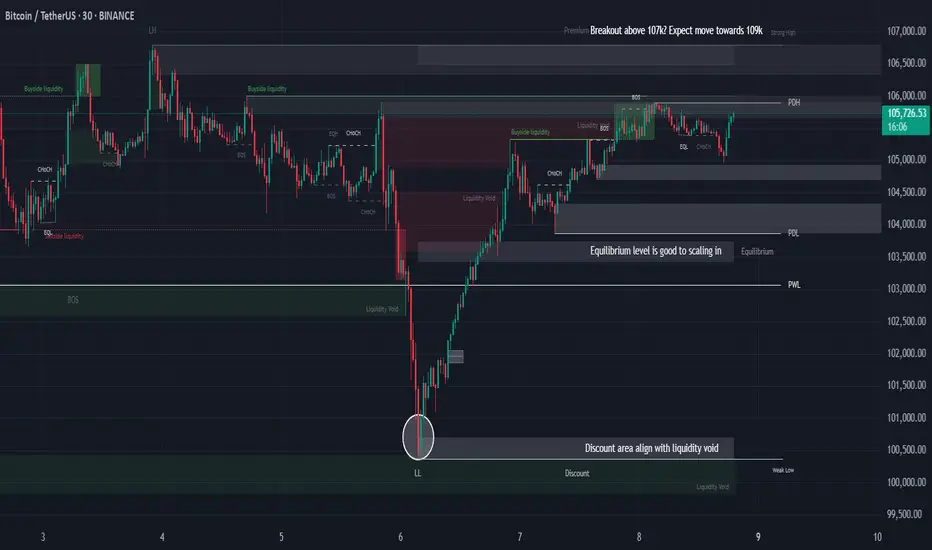
BTC at Resistance, Correction or Breakout to 109K?Yo traders! 😎 Here's a clean smart money breakdown of BTC/USDT on the 30-min chart. Be ready—this could be the calm before the pump or the trap before the dump 🧠⚡
🧠 Key Observations:
1. BTC is currently at a resistance zone, reacting near 107K, which is the Previous Daily High (PDH) 🧱 → Be cautious here—a rejection could trigger a correction.
2. If price successfully breaks above 107K, the next liquidity magnet is at 109K, right at a Strong High level. That’s where price might get drawn to 🚀
3. In case of rejection or correction, we’re watching the equilibrium zone (EQ) as a high-probability scaling-in area 🎯 → It gives a better risk-reward and aligns with the overall bullish structure.
4. Look how the discount zone aligns beautifully with a liquidity void 🤝 → Smart money loves these confluences. That’s where they often step in.
5. Previous structure shows a Lower Low (LL) followed by a strong displacement upward, indicating a potential Change of Character (ChOCH) ➡️ Bullish Bias 🔄🐂
6. We also got a clean sweep of sell-side liquidity before price pumped. This confirms accumulation by smart money below the EQ area 📉💰
⚡ Summary:
🔺 Above 107K = Breakout Potential → 109K Target
🔻 Rejection at 107K = Watch EQ zone for re-entry
⚠️ Don't rush in at resistance—wait for confirmation (BOS, retest, or signs of strength)
💬 What’s your take? Are you waiting for the breakout or prepping to buy the dip? Let’s chat below 👇
And make sure to follow for more clean, structured BTC updates like this 🔥📊
Pay close attention to LMACD in the weekly!Once we cross LMACD in the weekly it would be dangerous to stay in. Make sure to take some profits once we are getting close to October and before LMACD crosses to the downside

Last 133 days of the bull market!This idea gives more details about the pint in the cycle we are at right now. When measuring the duration between halving and tops we usually see the best in ~500 days after the halving. Following my previous idea about topping in October you can find the same pattern translating in 546 days after last halving. If this proves right , we are about 133 days before top. At this point we should see fireworks till October. In blue is price action in those 133 in 2017 and in yellow 2021, according to the btc nature of diminishing returns we should see peaks bellow those years.Cheers
Bitcoin Prediction - WARNING - Short Set-up Looming? We are spectating something serious on Bitcoin looming right now! Confirmations explained in the video!

BTC/USDTThe only re-entry I would consider as great in terms of risk reward is the region of 99-100k if market allows to visit. Orders are placed accordingly. In the meantime holding all positions since 77k re-entry.
BTCUSD Analysis – Bearish Elliott Wave Structure UnfoldingAfter BTC recently made a high around 111,959, we observed a clear impulsive bearish move followed by minor pullbacks.
The current market price stands at 103,396, and based on the structure, it appears that BTC is unfolding a bearish Elliott Wave pattern. If this holds, we could be in the midst of Wave 3, which typically shows strong momentum and continuation.
Key downside levels to watch:
99,620
97,670 – This level also aligns with a bullish breaker on the 4H chart, making it a potential area of interest for buyers.
Strategy:
My current approach is to sell on pullback, targeting the formation of lower highs and aiming for a break below the recent lower lows.
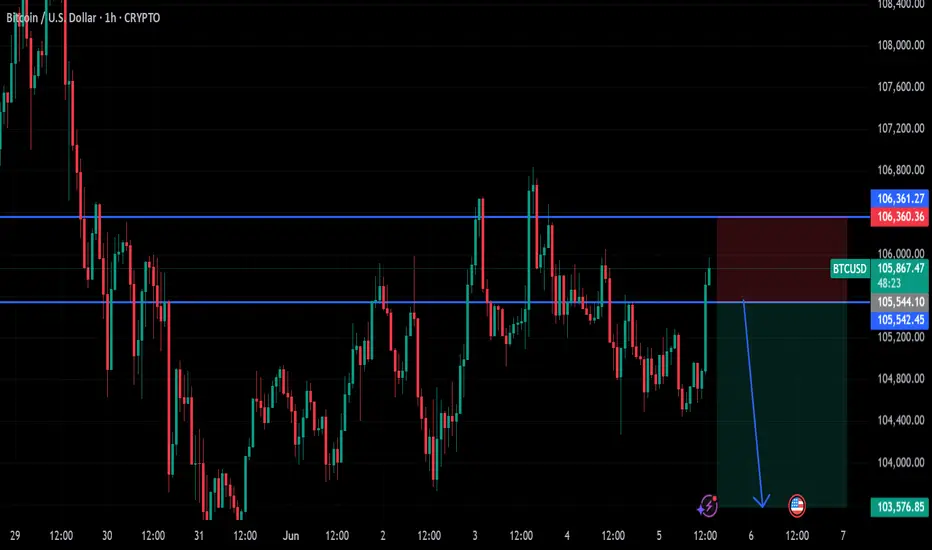
btc on selling#BTCUSD price have recorrect above 105600 showing bullish range, now we need price to fall to cover the projection.
Sell Below 105545, take profit 103555, Stop loss 106360.
Possible closure on current H1 above 106360 will break the next zone 106900-107200.
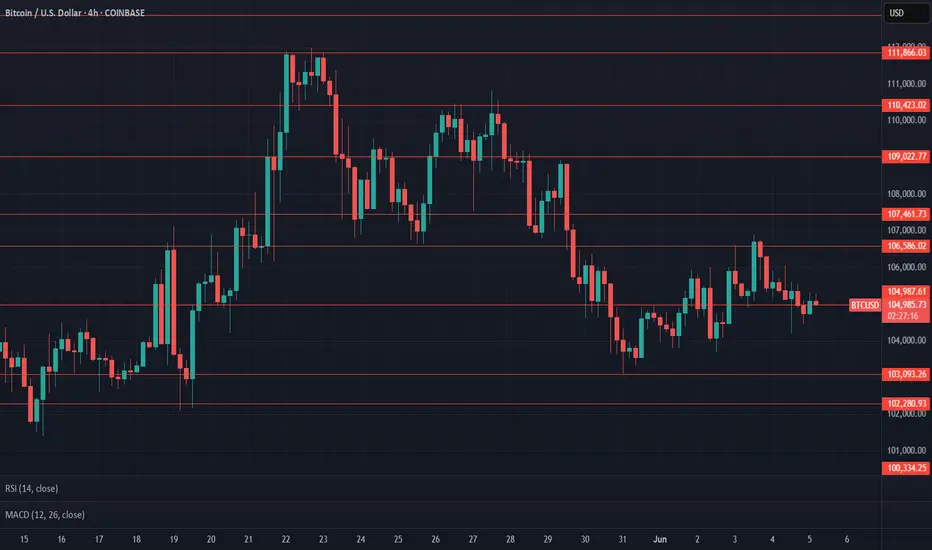
$BTC UpdateCRYPTOCAP:BTC #BTC $104,987 support in effect, previous weekly closed with bearish engulfing, 4h closed with bullish engulfing - current 4H trying to follow thru. $107,461 support needed to push for $110,423 resistance, and then the new ATH. $103,093 current support, $99,361 key support from here. Watch given S/R
BTC-----Sell around 105200, target 104500 areaTechnical analysis of BTC contract on June 4:
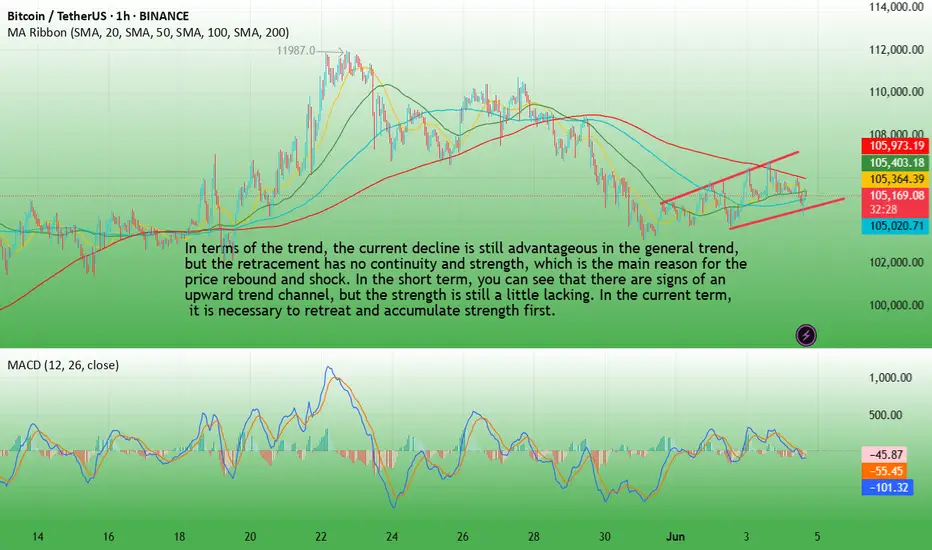
Today, the large-cycle daily level closed with a small negative line yesterday, the K-line pattern was a single negative with continuous positive, the price was consolidating at a high level, and the attached indicator was dead cross running. The general trend of falling is still advantageous, and attention should be paid to the strength and continuation of the falling trend; the short-cycle hourly chart retreated under pressure yesterday morning, and the US market supported the rebound and broke the high point of the previous day, but the time was wrong, so the continuation was not seen in the early morning. It was under pressure again in the morning. The current price is at a low level, and the attached indicator is dead cross running. The four-hour chart is obviously suppressed, so there is probably still a need to continue the decline during the day.
BTC short-term contract trading strategy:
Sell at the current price of 105200, stop loss at 106000, and target the 104500 area;