BTC- Following the TrendLine since YEARS, ExactlyYear on Year , each cycle BTC is adhering to this trend line, and also hit the 2 FIB EXACTLY for now - rejected there. It must cross this to test higher levels, but that may need a few weeks more of sideways moves. Keep a watch cause another rejection at this trend line will probably indicate we are not going higher.
Btcusdanalysis

BULL FLAG - Aug 1st Price prediction $121,300 In the interim, the bull flag pattern can be delineated as follows based on the uploaded chart: The flagpole is represented by the upward surge from approximately $113,332 (near the green label at the chart’s lower left) to around $121,351 (inferred from the upper candlestick highs and the red label near 121,351.18). The flag portion consists of a downward-sloping channel, with the upper trendline connecting the recent highs at roughly $120,500 to $118,000, and the lower trendline linking the pullback lows from about $118,500 to $116,700. A breakout above the upper trendline ($118,500–$119,000) would project an upward extension equivalent to the flagpole’s length (approximately $8,000), targeting $126,000–$128,000 in the near term, assuming confirmation through increased volume and sustained support above $116,700.
Regarding the daily price forecast from July 28, 2025 (Monday), through August 1, 2025 (Friday), the projections are derived from the bull flag continuation pattern, cross-referenced with aggregated analyses from recent market data, technical indicators (such as RSI and MACD showing neutral-to-bullish momentum), on-chain metrics (indicating accumulation at $115,000–$117,000), and a distribution of expert predictions. These include short-term consolidation with a potential dip for liquidity clearance, followed by a breakout, aligning with historical post-halving cycles and institutional inflows. Note that cryptocurrency prices are inherently volatile and influenced by factors such as Federal Open Market Committee outcomes, ETF flows, and macroeconomic events; these forecasts are speculative and not financial advice.
• July 28, 2025 (Monday): Anticipated consolidation within the flag channel amid low weekend volume. Expected range: $116,800–$118,500. Key targets: Support at $116,700 (lower flag boundary, potential entry for accumulation); resistance at $118,500 (upper flag line, breakout watch level). Average closing prediction: $117,800, reflecting neutral sentiment with minor downside risk if global markets weaken.   
• July 29, 2025 (Tuesday): Possible test of lower support amid early-week volatility, potentially sweeping liquidity before rebounding. Expected range: $116,000–$119,000. Key targets: Downside at $116,000 (critical on-chain accumulation zone); upside at $119,000 (initial breakout threshold). Average closing prediction: $117,500, with a 40% probability of a brief dip followed by stabilization.   
• July 30, 2025 (Wednesday): Breakout attempt likely if support holds, driven by mid-week momentum and potential dovish policy signals. Expected range: $117,500–$120,500. Key targets: Support at $117,000 (mid-channel level); resistance at $120,000 (psychological barrier and prior high). Average closing prediction: $118,900, assuming bullish confirmation above $118,500.   
• July 31, 2025 (Thursday): Extension of upward movement post-breakout, with volume potentially increasing. Expected range: $118,500–$122,000. Key targets: Support at $118,000 (retest of breakout level); resistance at $121,000 (flagpole projection start). Average closing prediction: $120,200, supported by technical alignment and ETF inflow trends.   
• August 1, 2025 (Friday): Momentum continuation toward weekly close, with risk of profit-taking. Expected range: $119,500–$123,500. Key targets: Support at $119,000 (new floor post-breakout); resistance at $123,000 (extended target based on pattern measurement). Average closing prediction: $121,800, aligning with broader bullish forecasts for early August.   

Navigating BTC Tremors on the Path to a Million Dollar New Bitcoin Paradigm: Navigating Short-Term Tremors on the Deliberate Path to a Million-Dollar Valuation
The Bitcoin market is currently a paradox, a theater of conflicting signals where short-term jitters coexist with audacious, long-term prophecies. On one hand, the price experiences sharp, gut-wrenching drops, with a recent dip to $118,000 attributed to institutional selling, sending waves of anxiety through the retail sector. On the other, the world’s most formidable financial institutions are issuing forecasts that seem to border on the fantastical, with one Wall Street banking giant boldly predicting a $200,000 Bitcoin by the end of December. This schizophrenic market sentiment is the new normal for an asset in the midst of a profound transformation. Bitcoin is no longer the fringe digital curiosity of a decade ago; it is a maturing global asset class being integrated into the very heart of the traditional financial system. This integration brings with it immense capital, but also new complexities and a different rhythm of growth. The story of Bitcoin today is one of navigating immediate volatility, fueled by market maker games and institutional repositioning, while keeping an eye on a future where corporate adoption, macroeconomic shifts, and a new, more deliberate growth pattern could methodically pave the way to a once-unthinkable $1,000,000 valuation.
The current landscape is a confluence of powerful, often opposing, forces. While institutional capital is the primary engine of this bull cycle, it is also a source of calculated selling pressure. At the same time, a steady drumbeat of corporate adoption continues, with companies like the UK-based The Smarter Web Company quietly adding hundreds of Bitcoin to their balance sheets. This is happening against a backdrop of favorable macroeconomic tailwinds, including what some are calling the "biggest trade deal ever" sealed by the United States, an event that subtly reinforces Bitcoin's role as a neutral, global store of value. And just when the narrative seems set, a new player like the mysterious "WeWake" enters the stage with a "big launch" that stuns investors, hinting at a new frontier of consumer-level adoption that could dwarf previous catalysts. This intricate dance between short-term technicals and long-term fundamentals defines Bitcoin's current journey—a journey that is less about the parabolic explosions of the past and more about a calculated, powerful ascent.
The Immediate Battleground: Volatility, Support, and the $123,000 Squeeze
To understand Bitcoin's path to six figures and beyond, one must first dissect the trench warfare happening at current price levels. The recent plunge to $118,000 served as a stark reminder that the road up is paved with volatility. While alarming, this dip was not seen as a catastrophic failure by seasoned analysts, but rather as a textbook example of institutional mechanics at play. Unlike retail investors who may hold with unwavering conviction, institutional desks are constantly managing risk, rebalancing portfolios, and taking profits to meet quarterly targets. The selling that triggered the drop was likely not a sign of lost faith, but a strategic repositioning, shaking out over-leveraged positions and creating liquidity for larger players to re-enter at more favorable prices.
This is precisely where the concept of the "ideal long zone" comes into play. For bullish traders and institutions, these orchestrated dips are not a crisis but an opportunity. An "ideal long zone" is a price range where multiple technical support indicators converge, creating a high-probability area for a price reversal. This zone might be defined by a combination of a key moving average (like the 50-day or 200-day), a significant Fibonacci retracement level drawn from a previous major low to a high, and a historical price range where the asset has previously found strong buying support. The fact that bulls were able to gain traction in this zone following the $118,000 dip indicates that this calculated selling was met with equally calculated buying. The market is currently engaged in a reversal campaign with an initial, modest target of reclaiming the $121,000 level, a crucial psychological pivot point.
However, a far more explosive scenario is brewing just beneath the surface: the potential for a massive short squeeze. Market makers, the large entities that provide liquidity to exchanges, are reportedly setting a "trap" for traders betting against Bitcoin. A short squeeze is a powerful market phenomenon that occurs when a heavily shorted asset begins to rise in price. The initial price increase forces short sellers to buy back the asset to close their positions and cut their losses. This wave of forced buying creates a feedback loop, driving the price even higher and forcing more short sellers to capitulate. It's a cascade of liquidations that can lead to rapid, vertical price movements.
Analysts believe that market makers are intentionally allowing short positions to build up around the current range, creating a pool of rocket fuel. The target for igniting this fuel appears to be a decisive break above $123,000. If Bitcoin can push past this level, it could trigger a chain reaction of short liquidations, propelling the price upwards with violent speed. This is not organic buying pressure but a technical event driven by market structure.
Looking at the week ahead, two primary scenarios emerge from this tense setup. The bullish scenario involves Bitcoin successfully bouncing from the current support zone, holding its ground, and making a concerted push towards $123,000. A break of this level would likely trigger the short squeeze, leading to a rapid retest of recent highs and potentially pushing into the $125,000-$130,000 range. The bearish scenario, conversely, would see Bitcoin fail to hold this "ideal long zone." A break below the recent lows around $118,000 would invalidate the immediate bullish thesis, suggesting that the institutional selling pressure is more significant than anticipated. This could lead to a deeper correction, potentially testing support levels closer to $100,000-$110,000. The outcome of this short-term battle is critical, as it sets the stage for the remainder of the year and will determine whether the more ambitious price targets remain in play. Adding to the tension, the market is heading into August, a month that analysts have flagged as being filled with potential volatility catalysts, from central bank policy announcements to major options expiry dates, ensuring that the current state of high alert will persist.
The Wall Street Endorsement: The Race to Six Figures by Year-End
While traders battle over short-term levels, Wall Street has its eyes fixed on a much grander prize. The narrative of this bull run has been fundamentally defined by the legitimization of Bitcoin as an institutional asset, and the price targets now emanating from the heart of traditional finance reflect this new reality. In a stunning vote of confidence, a major, unnamed banking giant has put forth a research note predicting that Bitcoin could reach an astonishing $200,000 by December of this year.
This is not a casual prediction from a rogue analyst; it represents a calculated forecast from an institution with immense resources and influence. Such a bold call from a pillar of Wall Street signifies a deep conviction in the asset's trajectory, likely based on proprietary models of capital inflows from ETFs, corporate treasuries, and high-net-worth individuals. It serves as a powerful signal to the rest of the financial world, effectively giving institutional clients the green light to allocate significant capital to Bitcoin. This prediction, along with a growing consensus that Bitcoin is expected to exceed $150,000 by the end of the year, creates a powerful psychological anchor. When institutions of this caliber set such high targets, they can become self-fulfilling, as asset managers and funds feel compelled to gain exposure, lest they miss out on the anticipated rally.
These bullish forecasts are not based on sentiment alone; they are supported by increasingly sophisticated on-chain analysis. One of the most-watched metrics in this cycle is the MVRV (Market Value to Realized Value) ratio. In simple terms, the MVRV ratio compares Bitcoin's current market price to the average price at which all coins in circulation were last moved. When the ratio is high, it suggests the market is overheated and holders are in significant profit, increasing the likelihood of selling. When it's low, it suggests the asset is undervalued.
Analysts have taken this a step further by creating MVRV Pricing Bands. These bands represent standard deviation levels above and below the "realized price," creating a data-driven framework for identifying potential market tops and bottoms. Currently, these pricing bands are hinting at a cycle peak valuation of around $130,000. This provides a more conservative, data-grounded target that aligns with the lower end of the Wall Street predictions. However, this on-chain model comes with a critical caveat: it is only valid if Bitcoin's price holds its current macro support level. This elegantly connects the long-term on-chain outlook with the immediate price battle discussed earlier. A failure to hold the line in the short term could invalidate the assumptions underpinning these models, forcing a recalibration of year-end targets. The path to $130,000, $150,000, or even $200,000 is contingent on winning the present fight.
The New Adoption Paradigm: Corporate Strategy, Macro Shifts, and the "WeWake" Wildcard
The fuel for Wall Street's bullish fire is coming from tangible, real-world adoption. The trend of corporations adding Bitcoin to their balance sheets, pioneered by MicroStrategy, is quietly but powerfully continuing. A recent example is The Smarter Web Company, a UK-based firm that recently announced the addition of 225 BTC to its holdings. While not on the scale of a multi-billion dollar purchase, this move is incredibly significant. It demonstrates that the corporate treasury thesis is expanding beyond a few high-profile early adopters and is becoming a global phenomenon, embraced by small and medium-sized enterprises who view Bitcoin as a superior long-term store of value and a hedge against currency debasement. Each of these purchases, while small individually, collectively contributes to a persistent supply shock, as more coins are moved from the open market into corporate treasuries for long-term holding.
This steady corporate accumulation is occurring against a highly favorable macroeconomic backdrop. News that the United States has successfully sealed what some insiders are calling the "biggest trade deal ever" is being interpreted as a significant long-term tailwind for Bitcoin. Large-scale international trade agreements often involve complex currency fluctuations and settlements. In a world of increasing geopolitical friction and competitive currency devaluations, Bitcoin's properties as a neutral, apolitical, and globally accessible settlement asset become increasingly attractive. Such trade deals can increase global liquidity and put pressure on national currencies, subtly reinforcing the value proposition of a decentralized, non-sovereign store of value.
Just as the market was beginning to digest this new landscape of institutional flows and macro support, a wildcard has entered the fray. A company named "WeWake" has reportedly stunned investors with a "big launch," creating a new, unexpected catalyst. While details remain scarce, the market chatter suggests WeWake is not another financial firm or institutional player, but a major consumer-facing technology company. The speculation centers on a groundbreaking integration of Bitcoin's Lightning Network for micropayments within a massively popular application or service.
If true, this would represent a paradigm shift in adoption. To date, the primary use case driving this cycle has been Bitcoin as "digital gold"—a store of value for institutions and corporations. The WeWake launch hints at the reawakening of Bitcoin's other primary narrative: a peer-to-peer electronic cash system. A successful, large-scale consumer integration would prove that Bitcoin can function not only as a reserve asset but also as a transactional currency for everyday use, opening up an entirely new dimension of demand. The shock and excitement from this launch stem from its potential to onboard millions of new users to the network, not as investors, but as active participants in a new digital economy. This move from passive investment to active utility could be the key to unlocking the next major phase of exponential growth.
The Long Road to a Million: A Mature Asset's "Pump and Consolidate" Journey
With year-end targets of $200,000 now part of the mainstream conversation, the once-fringe prediction of a $1,000,000 Bitcoin is being re-evaluated with newfound seriousness. However, a key analyst has offered a crucial insight that reframes this journey: "The days of parabolic Bitcoin bull runs are over." This statement may sound bearish, but it is, in fact, a sign of Bitcoin's profound maturation as an asset class. The wild, untamed, 100x rallies of the early cycles, driven by retail mania and a lack of liquidity, are being replaced by a more structured and powerful, albeit less explosive, pattern of growth.
The new path to $1,000,000, according to this expert view, will be a "slow and steady" process defined by a "pump and consolidate" pattern. This model envisions a market that behaves less like a volatile penny stock and more like a blue-chip technology giant. The "pumps" will be powerful, rapid upward movements, but they will be driven by specific, fundamental catalysts—the approval of a new wave of ETFs, a landmark corporate adoption by a Fortune 100 company, a major nation-state adding Bitcoin to its reserves, or a successful consumer integration like the one hinted at by WeWake.
Following each of these catalyst-driven pumps, the market will enter a prolonged "consolidate" phase. Instead of a dramatic crash, Bitcoin will establish a new, higher plateau of price discovery. During these consolidation periods, which could last for months, the market will build liquidity, institutional players will accumulate and distribute positions, and the new price level will be normalized and accepted as a baseline. This creates a far more stable foundation for the next leg up. This methodical, stair-step ascent is the hallmark of a mature market with deep, two-sided liquidity provided by institutional players who both buy and sell, preventing the extreme parabolic blow-off tops and subsequent 80-90% crashes of the past.
This "pump and consolidate" model makes the journey to $1,000,000 seem not only more plausible but almost inevitable, assuming the underlying drivers of adoption continue. It is a path built on structural strength rather than pure speculation. Each consolidation phase absorbs selling pressure and builds a stronger floor, making the entire structure more resilient to shocks.
In conclusion, Bitcoin stands at a fascinating and pivotal juncture. It is weathering the short-term storms of institutional profit-taking and the intricate games of market makers, fighting to establish a firm footing above the critical $120,000 level. At the same time, its long-term trajectory is being underwritten by the full faith and credit of Wall Street, with audacious year-end targets of $150,000 to $200,000 now serving as the institutional base case. This optimism is fueled by a relentless wave of corporate adoption and favorable macroeconomic winds, and has been supercharged by surprising new catalysts that hint at a future of mass consumer utility.
The ultimate destination may be the long-fabled million-dollar mark, but the journey will look different this time. The wild, parabolic arcs of youth are giving way to the measured, powerful, and deliberate steps of a mature global asset. The "pump and consolidate" rhythm is the new heartbeat of a market driven by institutional capital and fundamental adoption. While the path will undoubtedly be fraught with volatility, corrections, and periods of agonizing consolidation, the underlying narrative has never been stronger. Bitcoin is navigating the tremors of the present as it builds the foundations for a truly monumental future.
While we see markets fall, lets remember - FED on 30th
When you look on 1 hour or 4 hour charts, our hearts miss a beat...
"Bitcoin is Crashing"
But as you can see on a weekly chart, it really is nothing more than a little hiccup...not even that !
We can drop to 110K before you need t really watch
This cycle has seen so many similar instances.
But we do need to be alert to make sure this fall does on continue for what ever reason
But when we remember that on Wednesday, the FED gives us the rate decision for the USa, it all becomes clear, because this happens almost everytime before a rate decision is announced.
The chart above is the daily smapshot of a weekly chart I have been posting since 2021, about Rate Announcements by the FED.
You can see the red candles before each occasion, the Red vertical lines being approx the day the FED announced the decision. ( Approx as it is a weekly chart normaly and I do not "Zoomin" to get the day count perfectly as it becomes lost when I came back out to a week chart)
But you get the idea
do not panic
This is the weekly chart of that FED RATE effects in Bitcoin PA....over all..NO EFFECT
The effect has always been on the companies that can provide bitcoin
So, Keep your Cool. anf HOLD BITCOIN

BITCOIN Current Update !!!we are heading towards support region around 116.8k-115k from where we can expect a reversal.
If price breaks down 115k level then a bat harmonic pattern is also forming which indicates it's PRZ at 113-112k region...
Remember 121k is key level which needs to be broken in order to remain bullish !!!
BTC new meassuresokay impulse is pretty much clear
buy level 117.250 Targtting 121.100 / 122.200 / 122.800
Sell level 122.200 targetting 113.500
Re buy level 113.500 targetting 127.500 / 133.000
GG
BTC Roadmap Ahead: Ideal Entry, TP Zones & What to AvoidAs long as Bitcoin stays above the ~$98,200 zone on the daily timeframe, I believe the bullish trend remains intact.
No need to panic — what we need now is rational decision-making, not emotional reactions.
Since price has reached a key area around $118K–$120K, I’ve already taken partial profits at this level.
If no major fundamental changes occur and conditions remain stable, I see the maximum target for this leg somewhere between $134K and $140K, where I plan to secure additional profits.
Right now, my main objective is to increase my Bitcoin holdings.
The first buy zone I’m watching is around $110K, clearly marked with a red circle on the chart.
When price reaches this zone, I won’t enter immediately — I’ll wait for consolidation and confirmation, as a deeper correction is still possible.
There’s no need to rush — patience is power.
📌 All I’m trying to do is accumulate as much Bitcoin and sats as I can — because I know one day, I’ll be proud of it.
🔁 This analysis will be updated whenever necessary.
Disclaimer: This is not financial advice. Just my personal opinion.

btc on selling#BTCUSD on multiple price rejection at 119k,now we await final touch before a fall below 116487-110k.
Sell at 119436, target 116487-110k, stop loss 120372.
Bullish range isn't strong

BITCOIN PREDICTION: HUGE BREAKOUT SOON!! (watch this level) Yello Paradisers! I'm sharing with you multi-timeframe analysis on Bitcoin, levels to watch out for, confirmations we are waiting for, and everything needed for successful professional trading that is being profitable in the long run.
I'm sharing with you zig-zag from the Elliot Wave pattern formation. I'm also sharing a possible impulse we are going through, a head and shoulders pattern and its target, and the next major resistance and support levels.
I'm sharing with you a contracting triangle setup and how to trade it, along with an ending diagonal setup and how to trade it. Watch out for confirmations and how the price is developing based on what I have been talking about in this video, then trade it as a professional trader should.
Make sure that you have a great risk management, trading strategy, and tactic for entering the trades. I have explained some tactics that I'm watching for in this video, but make sure that all these tactics are well within your larger trading strategy and that you're approaching the market professionally. Don't try to get rich quick.
Make sure that you are focusing on long-term profitability and survival. This is the only way you can make it in crypto trading!

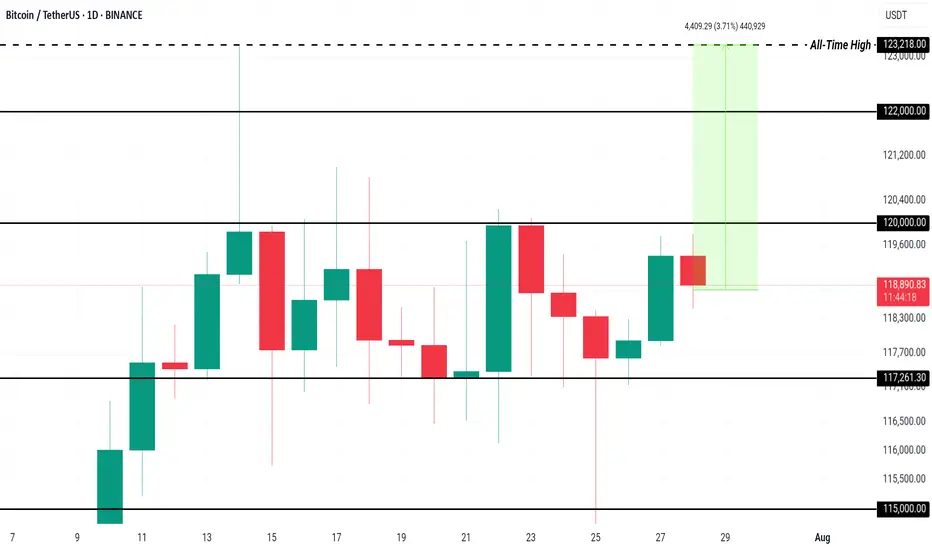
Here’s Why Bitcoin Price Could Rewrite History in AugustBINANCE:BTCUSDT price is currently hovering at $118,938, within a consolidation range between $117,261 and $120,000 . While this range has held steady, the possibility of breaking through $120,000 is high if investor sentiment remains strong.
The current sell-side risk ratio for BINANCE:BTCUSDT is at 0.24, well below the neutral threshold of 0.4 and closer to the low-value realization threshold of 0.1. This suggests that the market is experiencing consolidation, with investor behavior indicating a pause in large sell-offs.
Historically, August has been a bearish month for BINANCE:BTCUSDT , with the median monthly return sitting at -8.3%. However, given the current accumulation trend and the low sell-side risk, Bitcoin may defy its historical trend this year. If Bitcoin can secure $120,000 as support, it would likely push past $122,000 and move toward the ATH .
However, there remains a risk that the market could turn bearish if investors shift their stance due to unforeseen market factors. In this case, BINANCE:BTCUSDT could lose support at $117,261 and slide to $115,000, reversing the bullish thesis.
PI / Usdt OKX:PIUSDT
### **📊 Chart Overview – PIUSDT (1H):** -----Scam Coin remember -----
* **Current Price:** \$0.4484
* **Recent Move:** Sharp spike toward **\$0.48**, followed by an immediate rejection and retracement.
* **Volume Spike:** Notable surge in volume during the recent breakout, indicating possible **whale activity or manipulation**.
---
### **🔍 Technical Breakdown:**
1. **Fakeout Alert:**
* Price spiked above **\$0.4617** and got rejected hard.
* Classic **bull trap** pattern with a return below resistance, signaling caution.
2. **Support Zone:**
* Immediate support near **\$0.4470**, currently being tested.
* If this level fails, potential pullback to **\$0.4400 – \$0.4350 zone**.
3. **Resistance to Watch:**
* **\$0.4617** is now strong resistance.
* Bulls need to reclaim this level for continuation toward **\$0.48+**.
---
### **📌 Summary:**
PIUSDT showed **short-term bullish momentum** but faced **strong rejection at key resistance**. A breakdown of \$0.4470 may confirm further downside. Stay cautious of **fakeout spikes**.
---
⚠️ **Disclaimer:**
*This analysis is for educational purposes only and does not constitute financial advice. Always do your own research before making investment decisions.*

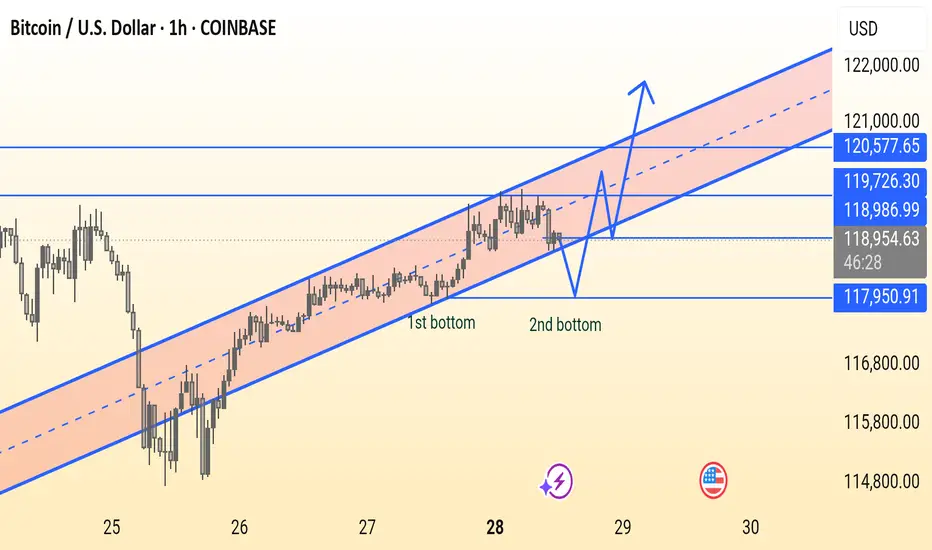
BTC/USD Double Bottom Forming in Uptrend ChannelThis BTC/USD 1-hour chart shows Bitcoin trading in an ascending channel, forming a potential double bottom near support around $118,950. A breakout above $118,986 could lead to a bullish move toward $120,577. Key support lies at $117,950 — holding this level is crucial for bullish continuation.
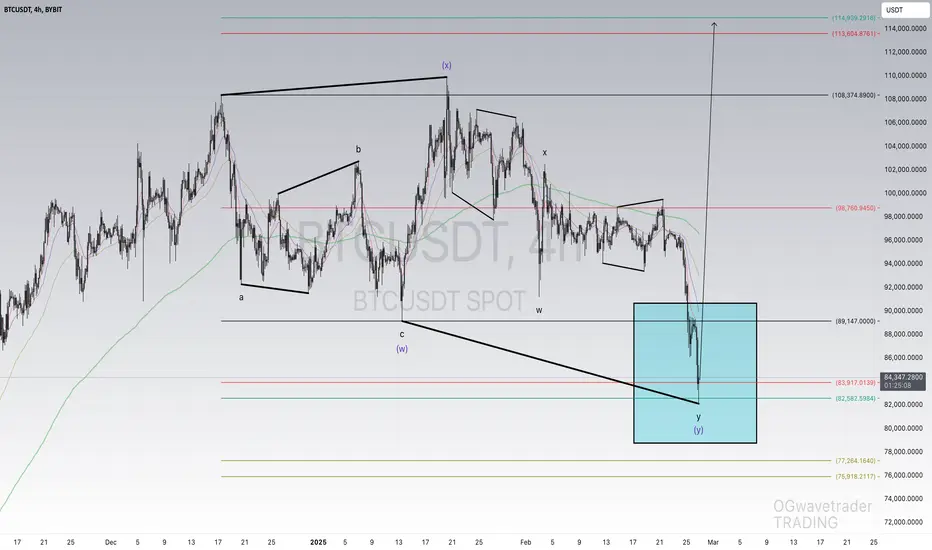
BTCUSDT NEXT Impulse !Hi fellow traders, BTCUSD will be ready to make a move higher from the blue box after it completes the expanding flat pattern in a WXY formation. Target will be 113604.87 USD. Good luck and trade safe!
BTC-----Buy around 119000, target 120000-1205000 areaTechnical analysis of BTC contract on July 28:
Today, the daily level of the large cycle closed with a small positive line yesterday, the K-line pattern continued to rise, the price was above the moving average, and the attached indicator was dead cross. The general trend of rising is still very obvious, but from the trend law, it is not a very strong trend at present. The trend of oscillating upward and range is highly likely. In this case, we must find a good rhythm for trading, keep short-term, and don’t be greedy, otherwise it is easy to have profit-taking problems; the short-term cycle hourly chart yesterday’s US market rose and then fell under pressure to correct the low position near the 118700 area. The current K-line pattern is continuous, and the price is at a high level. The attached indicator is golden cross and shrinking. In general, the trend is still strong and the retracement is relatively small. If we look at the continuation of the rise today, it is still the old rule. The retracement cannot be large and cannot break the intraday low.
Today’s BTC short-term contract trading strategy:
Trade in the 119000 area when retreating, stop loss in the 118500 area, target 120000 and break to the 120500 area;

BTC on 4H
"Hello, focusing on BTC on the 4-hour chart, the price is currently in a bullish momentum on higher time frames. However, it is showing signals indicating a potential completion of its pullback to the $110,000 zone. In my opinion, the $122,000 zone could be a good area to consider a sell position, with confirmation on the 15-minute chart. I plan to wait for this zone and then decide on initiating a sell position. If you have any updates or alternative perspectives on this analysis, please feel free to share."
If you need further clarification or have more details to discuss, please let me know!

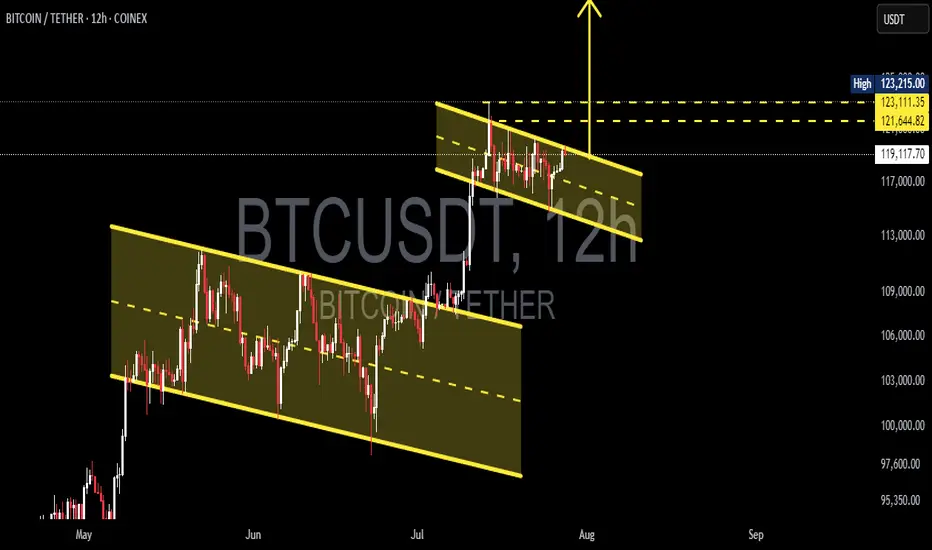
Double Bullish Flag on Bitcoin — Next Rally to $135K?📊 BTCUSDT (12H) In-Depth Analysis: Major Momentum Brewing
Bitcoin (BTC) is currently exhibiting a very promising technical structure — a Double Bullish Flag, a rare yet powerful continuation formation that often precedes strong upside momentum.
This dual-pattern structure reflects market strength and smart accumulation, with bulls maintaining control while allowing for healthy pauses before potential expansion to higher levels.
---
🔍 Technical Breakdown: Double Bullish Flag Structure
🔸 1. Primary Bullish Flag:
Formed after a sharp rally from around $95,000 to $113,000 (flagpole).
Price then consolidated within a clear descending channel, forming a classic Bullish Flag pattern.
Breakout from this pattern occurred in early July, confirming bullish continuation.
🔸 2. Secondary Bullish Flag (Mini Flag):
After the breakout from the main flag, BTC formed a second smaller flag pattern — a narrow descending channel from ~$123K to ~$119K.
This is known as bullish flag stacking — a pattern of "flag on top of flag", signaling trend strength and smart consolidation.
This mini-flag now acts as a launchpad for the next potential breakout.
---
🚀 Bullish Scenario: Preparing for a Breakout
If BTC breaks above the upper resistance of the mini flag (~$123,200), it will signal a fresh bullish continuation.
🎯 Potential Upside Targets:
Conservative target: $126,000 – $128,000
Full measured move target (from flagpole): $132,000 – $135,000
✅ Confirmation criteria:
Strong candle close above $123.2K
Accompanied by rising volume and upward RSI momentum (but not overbought)
---
🧨 Bearish Scenario: Breakdown and Retest
If BTC fails to break above the flag and instead drops below the flag support (~$119,400), we may see a short-term correction.
🔻 Key Support Levels:
$117,000 – minor horizontal support
$113,000 – $115,000 – strong demand zone and previous breakout area
⚠️ As long as price holds above $113K, the broader bullish trend remains intact. A pullback to this zone could offer a prime retest-buying opportunity.
---
📌 Key Price Levels to Watch:
Level Role
$123,200 Mini-flag resistance (breakout trigger)
$121,600 Mid-range resistance
$119,400 Flag support
$117,000 Horizontal retest zone
$113,000 Major support (trend invalidation if lost)
$132K – $135K Projected breakout target
---
💡 Conclusion: BTC in Critical Zone Before Potential Expansion
This Double Bullish Flag formation is one of the most technically constructive setups BTC has shown in weeks. It reflects a strong, patient market — with bulls preparing for another leg higher.
If the breakout from the second flag confirms, Bitcoin could rally toward $135,000, backed by momentum, volume, and clean structure. However, a breakdown would only signal a short-term cooldown unless support at $113K is lost.
🧭 Stay focused on breakout confirmation, volume spikes, and market sentiment. This could be the calm before a bullish storm.
#BTCUSDT #BitcoinBreakout #BullishFlag #TechnicalAnalysis #DoubleBullFlag #BTCMomentum #BitcoinRally #CryptoOutlook #BitcoinTo135K
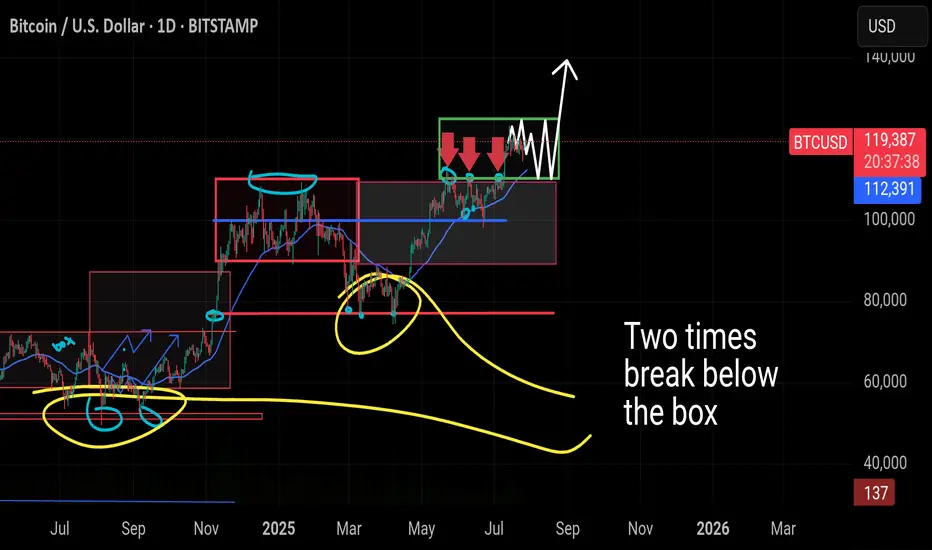
#Bitcoin – What’s Really Happening? Daily Structure + Macro#Bitcoin – What’s Really Happening?
Daily Structure + Macro Setup = Big Move Loading
🔸 1D Chart: CRYPTOCAP:BTC Range-Bound Between $125K–$110K
Bitcoin is currently trading inside a tight sideways range, marked by resistance near $125,000 and support around $110,000. This is now the third time we've seen price consolidate in this green zone.
🔸 In the previous two attempts, BTC briefly dipped below support before quickly reclaiming the level — classic fakeouts, not real breakdowns. The current price behavior mirrors that same structure.
🔸 What If CRYPTOCAP:BTC Drops Again?
A dip below $110K or even toward $100K should not trigger panic. Historically, these wicks below the range are liquidity grabs — not signs of weakness. As long as the 200 MA holds and price doesn’t sustain under $100K, the macro trend remains bullish.
🔸 Key Zones:
– Immediate support: $112,398
– Major support: $100K psychological level
– Structure invalidation: Sustained loss below $100K (not expected)
🔸 Macro Outlook: Still Bullish
While BTC chops sideways, the broader environment is heating up:
🔸 Trump-EU Mega Trade Deal
Markets just got a major catalyst — a massive U.S.–EU agreement that includes:
– $750B in U.S. energy exports
– $600B in EU investment
– $150B in energy purchases from U.S.
This clears out tariff fears and opens the door for stocks and crypto to run. Risk appetite is returning fast.
🔸 Whale Activity Panic = Noise
Galaxy Digital wallet movement spooked the market temporarily, pushing BTC to $114,500. But zoom out:
– ETF inflows still dominate daily sell volume
– BlackRock continues absorbing supply
– Long-term whales haven’t sold — they’re holding
This was not a breakdown. It was a shakeout. Accumulation is still happening.
🔸 The Real Fuel: M2 Money Supply
Here’s where things really align for the bulls:
– In 2020, a 25% rise in M2 → BTC 800% rally
– In 2025 so far: +2.3% increase, and we’re still in “tightening”
– Largest M2 spike: +0.63% in June
Given BTC typically lags M2 by 60–90 days, the June print is setting up for a 15–17.5% upside over the coming weeks. That puts us on a clear path toward $130,000+
🔸 Bitcoin is sideways, not weak. Range-bound price action is accumulation, not distribution. Macro signals are aligning, M2 is expanding, and whale panic was short-lived.
We’re not just holding a range — we’re coiling for the breakout.
You’re early. Stay ready.
#bitcoin
Bitcoin Weekly Seal at the Threshold 122K - No Gaps, No Retreat.⊣
⟁ BTC/USD - BINANCE - (CHART: 1W) - (Jul 27, 2025).
◇ Analysis Price: $119.374,00.
⊣
⨀ I. Temporal Axis - Strategic Interval - (1W):
▦ EMA9 - ($112.771,21):
∴ The weekly close remains above the EMA9, preserving short-term bullish structure;
∴ The EMA9 continues rising at a consistent slope, reflecting sustained upward momentum;
∴ A retracement to this level would represent the first defensive support on a tactical pullback.
✴️ Conclusion: EMA9 acts as a dynamic short-range support and trend continuation marker.
⊢
▦ EMA21 - ($104.883,22):
∴ Price remains notably above the EMA21, confirming structural strength in medium-term trend;
∴ The EMA21 was previously retested during consolidation in Q2 2025;
∴ A weekly close below it would indicate a structural loss of momentum.
✴️ Conclusion: EMA21 confirms medium-term bullish bias as long as preserved.
⊢
▦ WMA50 - ($98.605,81):
∴ WMA50 serves as a major cyclical support and remains untouched since early 2024;
∴ The gap between price and WMA50 indicates strong extension, yet risk of mean reversion rises;
∴ This level aligns with a prior demand zone around ($95K–$100K).
✴️ Conclusion: WMA50 is a latent demand zone - strategic if market reverts from exhaustion.
⊢
▦ WMA100 - ($84.570,72):
∴ This weighted average aligns with the 0.382 Fibonacci level;
∴ A long-term correction toward this band would reflect the depth of macro pullbacks in previous cycles;
∴ Currently distant from price action, but structurally significant if macro volatility increases.
✴️ Conclusion: WMA100 anchors mid-cycle recalibrations and aligns with retracement symmetry.
⊢
▦ WMA200 - ($63.181,79):
∴ The 200-week WMA remains far below price and untouched since early 2023;
∴ This is the ultimate structural support in secular bull cycles;
∴ If revisited, it signals macro-level capitulation or black swan scenario.
✴️ Conclusion: WMA200 holds the foundational line of long-term structural integrity.
⊢
▦ Fibonacci Retracement - (Range from 0 = $27.143,79 to 1 = $122.056,95):
∴ 0.000 = $27.143,79 - Genesis base from Apr 2025 cycle;
∴ 0.236 = $49.543,30 - Psychological line of control in late 2023;
∴ 0.382 = $63.400,62 - Aligned with long-term moving averages;
∴ 0.500 = $74.600,37 - Symmetry pivot of current macro-leg;
∴ 0.618 = $85.800,12 - Golden pocket lower bound;
∴ 0.786 = $101.745,53 - Golden pocket upper edge and structural resistance pre-breakout;
∴ 1.000 = $122.056,95 - Current cycle high (resistance zone);
∴ 1.618 = $180.713,28 - Projected extension target for parabolic continuation.
✴️ Conclusion: Key retracement zones for tactical reactions lie at (0.786 - $101.7K) and (0.618 - $85.8K); upside breakout target confirmed at (1.618 - $180K).
⊢
▦ Volume + EMA21 - (Last: 2.38K BTC):
∴ Volume is stable and slightly rising compared to prior weekly sessions;
∴ No high-volume sell candles indicate panic or exit;
∴ EMA21 on volume shows baseline liquidity remains active.
✴️ Conclusion: Healthy volume confirms orderly continuation rather than climax or exhaustion.
⊢
⨀ II. Momentum & Pressure Indicators:
▦ RSI (21) + EMA9 - (66.71 / 64.34):
∴ RSI approaches the 70-level but remains below overbought territory;
∴ EMA of RSI confirms rising internal strength;
∴ No divergence is observed - internal price energy remains aligned with upward momentum.
✴️ Conclusion: RSI signals strong but not overheated momentum - bulls still in control.
⊢
▦ MACD (9, 21) - (MACD: 7,887.99 | Signal: 6,362.06 | Histogram: +1,525.93):
∴ MACD histogram remains green, showing continuation of bullish trend;
∴ The spread between MACD and Signal is positive and expanding again;
∴ No bearish crossover threat imminent at current slope.
✴️ Conclusion: MACD structure reinforces bullish pressure - trend still intact.
⊢
▦ OBV + EMA9 - (OBV: 220.38M):
∴ OBV remains in an uptrend, supporting price action;
∴ EMA overlay shows no divergence or flattening;
∴ Volume accumulation remains healthy, confirming underlying conviction.
✴️ Conclusion: OBV supports continuation - no signs of distribution.
⊢
▦ Stochastic RSI (3,3,21,9) - (%K: 93.68 / %D: 90.72):
∴ Both %K and %D lines are in the overbought zone (>90);
∴ Crossovers are still bullish but nearing potential exhaustion zone;
∴ Caution warranted for short-term momentum correction.
✴️ Conclusion: Overbought levels reached - watch for tactical slowing, though no reversal confirmed.
⊢
🜎 Strategic Insight - Technical Oracle:
∴ The weekly chart exhibits a structurally intact bull trend, confirmed by the alignment and spacing of EMA's and WMA's across all horizons (short, mid, long);
∴ Fibonacci retracement levels delineate critical reaction zones, with (0.786 - $101.745,53) and (0.618 - $85.800,12) serving as dominant retrace supports in the event of a tactical correction;
∴ The presence of a projected (1.618 extension at $180.713,28) offers a sacred path forward should price breach and sustain above the current high of $122K.
∴ Momentum oscillators (RSI and MACD) continue their upward thrust without divergence, but the Stochastic RSI warns of temporal exhaustion - a typical hallmark before consolidation or rotation;
∴ Volume structure is stable and non-climactic, suggesting continuation rather than blow-off;
∴ No sign of distribution via OBV - accumulation remains intact.
✴️ Conclusion: The market remains within the upper chamber of the Fibonacci spiral. Tactical cooling is possible due to overextension in the momentum field, but no structural damage is observed. A controlled retrace into the golden pocket would be both acceptable and ritualistically symmetrical. The path to $180K remains open, but guarded.
⊣
⟁ BTC/USD - CME Futures BTC1! - (CHART: 1D) - (Jul 27, 2025):
◇ Current Price: $120.785.
◇ Chart Link:
⊣
▦ CME Futures GAP - Observation & Ritual Closure:
∴ The current chart shows a clustered consolidation near $120K–$121K with no immediate upper gap visible;
∴ The last prominent CME Gap was filled during the late June run-up and early July vertical move;
∴ No new gap formed during the weekend-to-weekday open for the last 3 sessions - continuity is intact.
✴️ Conclusion: There is no unfilled CME Gap between the current price and previous sessions. All recent discontinuities appear ritually sealed. Attention now turns to potential downside gaps from rapid bullish impulse moves around ($104K–$108K), which could remain structurally unfilled - unless tactically challenged during correction.
⊢
🜎 Strategic Insight - CME Oracle:
∴ The lack of open CME Gaps suggests a clean technical field - no magnet effect pulling price backward in the short term;
∴ The compression near $121K may precede either an explosive breakout toward the Fibonacci extension ($122K / $130K+), or serve as a false plateau before a tactical flush;
∴ Absence of gaps also removes "gap fill" traders from immediate relevance, allowing price to move freely based on liquidity and macro flows.
✴️ Conclusion: The CME chart confirms no active gravitational pull downward - the battlefield is neutral and favorably clean for bullish continuation, pending macro and liquidity alignment.
⊢
∫ III. On-Chain Intelligence - (Source: CryptoQuant):
▦ Exchange Inflow Total + 9EMA - (All Exchanges):
∴ Exchange inflows remain significantly suppressed, with no spikes above 75K BTC since Q4 2023, despite the price nearing $120K;
∴ The 9EMA of inflows is stable and near local lows, showing no abnormal movement toward exchanges;
∴ Historically, spikes in inflow coincide with distribution, fear, or profit-taking, none of which are currently present on a structural level.
✴️ Conclusion: The on-chain exchange inflow behavior confirms low distribution pressure at current highs. The lack of elevated Bitcoin deposits into exchanges indicates conviction among holders and the absence of a mass selloff attempt, even near critical Fibonacci resistance.
⊢
🜎 Strategic Insight – On-Chain Oracle:
∴ While price consolidates near its cyclical high, exchange inflows remain muted, echoing behavior observed during earlier phases of strong market conviction (e.g., late 2020);
∴ This suggests the market is not preparing for heavy liquidation;
∴ The silence of inflows reinforces the tactical hypothesis that current price action is organic and not panic-driven, preserving the ritual path toward ($122K/$180K).
⊢
⧉ IV. Contextvs Macro-Geopoliticvs - Interflux Economicvs:
▦ US-EU Trade Accord: 1(5% Unified Tariff Across All Sectors):
∴ The United States and the European Union have reached a comprehensive trade agreement, averting escalation: a 15% unified tariff will apply across most EU exports to the US, down from a threatened 30%;
∴ Exceptionally high 50% tariffs remain on steel and aluminum, while some industries such as automotive, semiconductors, and pharmaceuticals will be capped at 15%;
∴ Zero-tariff exemptions have been granted to strategic sectors, including aerospace, select chemicals, semiconductor equipment, agricultural products, and critical raw materials;
∴ In return, the EU has committed to invest $600 billion in US infrastructure and tech, and to purchase $750 billion worth of US energy and defense products over three years.
✴️ Conclusion: The trade pact imposes moderate cost adjustments for key industries but restores transatlantic stability. Although friction remains in sensitive sectors, the agreement prevents global trade disorder and enhances strategic economic visibility.
⊢
🜎 Strategic Insight - Macro Oracle:
∴ The accord mitigates systemic trade risk and clears geopolitical uncertainty, which would otherwise impair market confidence in risk-on assets;
∴ Predictable tariffs (15%/50%) reduce abrupt inflationary shocks, enhancing macroeconomic forecasting and central bank policy latitude;
∴ Massive EU commitments in energy and defense inject transatlantic liquidity and strengthen demand for US dollar-based assets;
∴ While European manufacturers face pressure, the global system benefits from lower volatility and restored economic symmetry;
∴ This opens room for speculative and structural capital to flow more confidently into high-volatility instruments, including crypto assets.
✴️ Conclusion: The macro backdrop reinforces the sacred bullish path - a re-alignment of order in the West, combined with non-disruptive trade stabilization, lays the groundwork for continuation of liquidity-driven risk flows. Bitcoin stands to benefit as a speculative vessel in a structurally stable yet monetarily dynamic environment.
⊢
𓂀 Stoic-Structural Interpretation:
▦ Structurally Bullish - Tactically Watchful:
∴ Price remains above all critical EMA's and WMA's on the 1W chart;
∴ Fibonacci structure is intact, with the $122K high acting as ritual resistance and the (0.786 / 0.618 zone ($101K / $85K) as sacred fallback;
∴ Momentum indicators (MACD, RSI) sustain positive bias with no divergences;
∴ CME Futures show no unfilled gaps - the field is clean, allowing strategic extension.
✴️ Conclusion: The macrostructure supports continuation higher into the sacred extension zone ($130K–$180K), with short-term vigilance warranted due to overbought Stoch RSI and reduced volume velocity.
⊢
▦ Tactical Range Caution:
∴ Upper Limit: $122.056 - Cycle high and Fibonacci 1.0;
∴ Mid Guard: $112.770 - EMA9;
∴ Structural Support: ($101,745 - 0.786) Fib retrace;
∴ Golden Anchor: ($85.800 - 0.618) Fib retrace.
✴️ Conclusion: As long as price remains above $101K, the bullish code remains sealed. Breach of $85K would unlock deeper structural reassessment.
⊢
◩ Codicillus Silentii - Strategic Note:
∴ The week closes at the threshold of the Fibonacci (1.0 mark - $122.056), beneath a ceiling forged by time and belief;
∴ All technical layers are aligned, yet the silence in the inflow, the clean CME field, and macro equilibrium whisper a rarer truth - no storm is seen, but no wind is promised;
∴ This is the zone of the Watcher - where action becomes hesitation, and hesitation becomes discipline.
✴️ Strategic Note & Final Seal: Do not confuse absence of danger with presence of opportunity. A vertical structure with no threat below can still falter from within. This is a time not to act, but to remain unshaken.
⊢
⧉
· Cryptorvm Dominvs · MAGISTER ARCANVM · Vox Primordialis ·
⚜️ ⌬ - Silence precedes the next force. Structure is sacred - ⌬ ⚜️
⧉
⊢

Boom / Usdt GATEIO:BOOMUSDT
BOOM coin — understandable, let’s see what happens next! 🔥👀
Momentum is building, so keep it on your radar. 🚀
⚠️ Disclaimer: Not financial advice. Watch and trade responsibly.

BTC mid term uptdateI will be carefull at 122.000 secure positions and taking profits as one more fall is very possiblo to 113.500 before new all time highs
Levels Highlighted
GG


AI Generated Bitcoin Prediction: No ATH This Week! 📉 AI Generated Bitcoin Prediction: No ATH This Week! 🚫📈
Euphorisme is what traps people... watch out.
📌 Overview
In this 1H Heikin Ashi chart for BTC/USD, a clear AI-generated prediction outlines a volatile week ahead, but with no signs of a new all-time high (ATH). While price action recently broke above key resistance levels around $119,300–$119,570, the projected trajectory is more cautious than bullish.
The blue line overlay sketches a speculative wave structure — an AI-based forecast — suggesting multiple failed attempts to break above $122,165, a level that coincides with previous rejection zones.
🔍 Key Technical Levels
Level Significance
$122,165 Major rejection level
$120,916.94 Resistance + liquidity zone
$119,568.92 Immediate rejection area
$118,313.11 EMA & SMA cluster support
$118,185.55 Short-term support
$117,893.78–$118,037.81 Bull trap range
⚠️ Why You Should Be Cautious
The AI-predicted price action shows a pattern of rising highs followed by sharp reversals.
Multiple red inverted triangles suggest lower high formations, a sign of weakening bullish momentum.
Current levels around $119,300 are still within a macro supply zone, with price likely to consolidate or retrace.
🧠 Psychological Trap: Euphoric Longing
Markets often punish emotional entries — and euphoric breakouts like we saw at $119,500 tend to trigger FOMO longs. This is where smart money exits, not enters.
“If it feels like you're late to the move, you probably are.”
🔄 Mid-Term Scenario
If the AI prediction holds:
Expect volatility with fake breakouts.
Watch for distribution near $122K.
A potential drop toward $118K–$117.8K may offer a better re-entry.
📆 Macro Context
The week is filled with economic events (marked below the chart), and the AI model seems to expect choppy reactions, not a clear breakout. These red calendar icons often correlate with increased volume and traps.
🧩 Strategy Suggestion
Avoid chasing pumps into resistance zones.
Wait for confirmation or deviation from the projected path.
Consider setting alerts near $122K and $118K to monitor key reactions.
🧠 Final Thought:
ATH is a process, not an event. If the AI is right, we’re not there yet.
“Let the herd long the top, and let you short the trap.” – Smart Money
💬 Share your thoughts below. Do you agree with the AI's prediction?
🔔 Follow for more predictive insights & logic-backed analysis.
#Bitcoin #BTCUSD #CryptoTrading #NoATH #SmartMoney #TradingPsychology #EuphoricTrap #HeikinAshi #BTCAnalysis

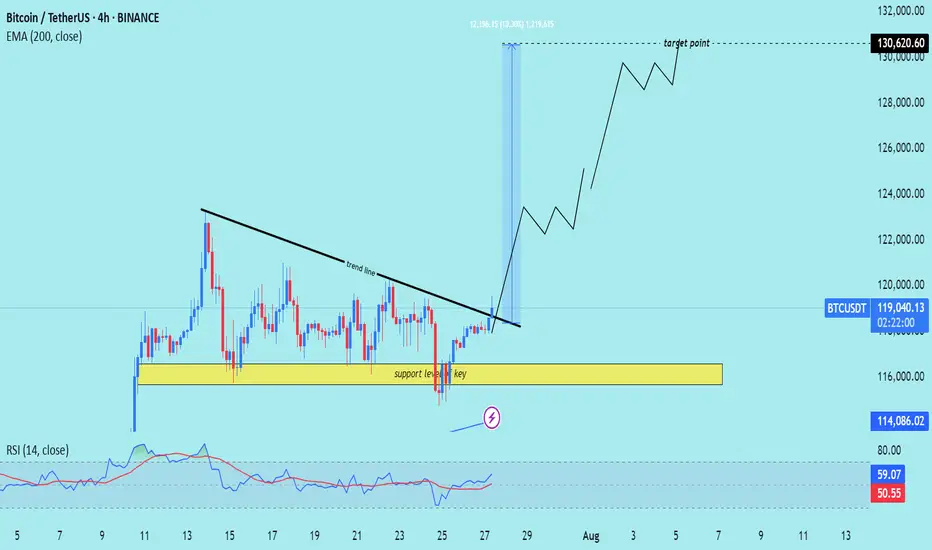
BTC/USD) bullish trend analysis Read The captionSMC Trading point update
Technical analysis of Bitcoin (BTC/USDT) on the 4-hour timeframe, indicating a potential rally toward the $130,620.60 target zone. Here's the detailed breakdown:
---
Technical Analysis – BTC/USDT (4H)
1. Key Support Level Holding
The yellow zone highlights a strong support zone around $116,000, which has been tested multiple times without breaking.
Marked as “key support level,” it has acted as the foundation for a bullish reversal.
2. Trendline Breakout
A descending trendline was broken decisively with strong bullish candles, signaling a trend reversal.
The breakout was followed by increased momentum and volume, supporting the move higher.
3. Target Projection
The chart shows a projected move up to $130,620.60, labeled as the target point.
This target aligns with a measured move or prior resistance, suggesting a potential swing high objective.
4. 200 EMA Support
Price is well above the 200 EMA (at $114,088.52), confirming the uptrend and acting as dynamic support.
5. RSI Confirmation
RSI is at 60.62, reflecting bullish strength with more room before reaching overbought levels.
Momentum supports the continuation of the uptrend.
Mr SMC Trading point
---
Summary
Bias: Strong Bullish
Current Price: $119,291.13
Support Zone: $116,000 (key area)
Trendline: Broken with bullish confirmation
EMA 200: Acting as solid dynamic support ($114,088.52)
Target Zone: $130,620.60
RSI: 60.62 – bullish with upside potential
---
Please support boost 🚀 this analysis)