Bitcoin's Rocky Quarter: Tariffs, Whales, and Volatility Loom
Bitcoin's first quarter of 2025 has concluded with a whimper, marking its worst Q1 performance since the tumultuous bear market of 2018.1 While gold has surged to record highs, fueled by geopolitical tensions and US trade tariffs, Bitcoin has struggled to maintain momentum, leaving traders bracing for potential further volatility. This week’s preview reveals a confluence of factors that could significantly impact Bitcoin's price trajectory.
A Disappointing First Quarter
The initial months of 2025 were anticipated to be a period of growth for Bitcoin, particularly with the anticipation surrounding the halving event. However, the cryptocurrency failed to deliver on these expectations. Instead, it experienced a period of stagnation and even decline, contrasting sharply with the robust performance of traditional safe-haven assets like gold.
Several factors contributed to this underwhelming performance. The escalating trade tensions, particularly the US tariffs, have injected uncertainty into global markets, diverting capital towards established safe-haven assets.
Tariffs and Trade Tensions: A Persistent Headwind
The US imposition of trade tariffs has emerged as a significant headwind for Bitcoin. These tariffs, designed to protect domestic industries, have disrupted global trade flows and created a climate of economic uncertainty.2 Investors, wary of potential market disruptions, have sought refuge in traditional safe-haven assets like gold, which has historically outperformed during periods of economic instability.
The impact of these tariffs extends beyond immediate market reactions. They signal a potential shift towards protectionist policies, which could have long-term implications for global trade and investment flows. Bitcoin, often touted as a decentralized and borderless asset, is particularly vulnerable to disruptions in global trade and capital flows.
Whale Activity and Market Manipulation
Adding to the complexity of the market is the activity of large Bitcoin holders, often referred to as "whales."3 These entities, possessing significant amounts of Bitcoin, can exert considerable influence on market prices through large buy or sell orders. Recent observations suggest increased whale activity, potentially contributing to the volatility and price fluctuations.
Concerns about market manipulation have also resurfaced. The decentralized nature of Bitcoin, while a core strength, also presents challenges in terms of regulation and oversight. This lack of centralized control can create opportunities for manipulation, leading to price swings that are not necessarily reflective of fundamental market dynamics.
Bitcoin Bears Tighten Grip: Where’s the Next Support?
The recent price action indicates that Bitcoin bears are tightening their grip. The failure to sustain upward momentum has emboldened sellers, leading to a downward trend. Traders are now closely monitoring key support levels, anticipating potential further declines.
Identifying these support levels is crucial for understanding the potential trajectory of Bitcoin's price. Technical analysis, using tools like Fibonacci retracement levels and moving averages, can help traders identify potential areas of support where buying pressure may emerge. However, the volatile nature of Bitcoin makes it challenging to predict these levels with certainty.
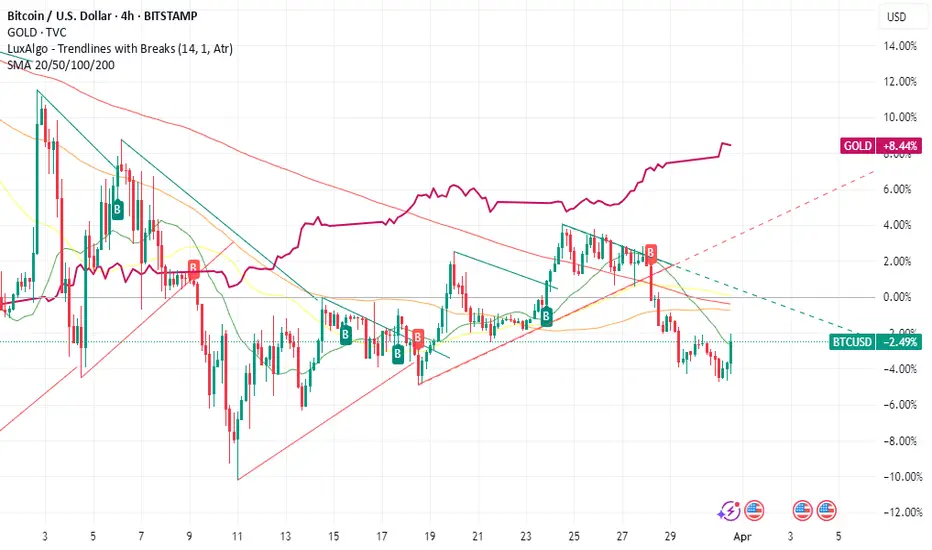
Gold vs. Bitcoin: A Comparative Analysis
The stark contrast between gold's recent performance and Bitcoin's struggles has reignited the debate about their respective roles as safe-haven assets. Gold, with its long history and established reputation, has benefited from the current climate of uncertainty.
However, Bitcoin proponents argue that its decentralized nature and limited supply make it a superior store of value in the long term. The comparison between the two assets highlights the evolving nature of safe-haven assets and the growing acceptance of digital currencies. The quote "Gold has taken 26 years to 10X. Bitcoin has taken 4 years to 10X" shows the potential for rapid growth, but also its volatility.
Looking Ahead: Volatility and Uncertainty
The coming week promises to be a period of significant volatility for Bitcoin. Traders should brace for potential price swings, driven by a combination of factors, including:
• Continued Trade Tensions: The ongoing trade disputes and potential for further tariffs are likely to continue to impact market sentiment.
• Whale Activity: Large buy or sell orders from whales could trigger significant price fluctuations.
• Regulatory Developments: Any regulatory announcements or policy changes could have a substantial impact on Bitcoin's price.
• Macroeconomic Factors: Inflation data, interest rate decisions, and other macroeconomic indicators will continue to influence investor behavior.
•
In conclusion, Bitcoin's disappointing first quarter has set the stage for a period of heightened volatility. The confluence of trade tensions, whale activity, and market manipulation creates a challenging environment for traders. While the long-term potential of Bitcoin remains a subject of debate, the immediate future is marked by uncertainty and the need for caution.
Btcusdanalysis
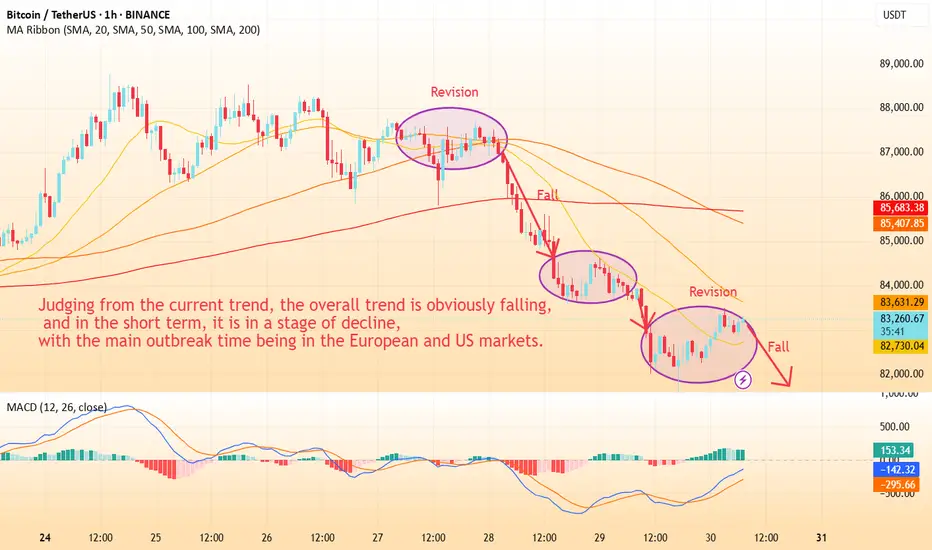
Grasp the trend and analyze the full range of BTC longsTechnical analysis: Based on in-depth technical analysis, the current BTCUSD decline has slowed down, and there are signs of building double bottom support. The 50-day moving average and the 200-day moving average form a golden cross, the MACD indicator continues to strengthen and the bar chart continues to expand. As BTCUSD stops falling, market sentiment is gradually warming up, institutional funds continue to flow in, fundamental support is solid, and the upward momentum may gradually strengthen. It is the right time to go long.
BTCUSD operation strategy: Go long in the 82500-81500 area. Target 83000-84000
Trading discipline: 1. Don't blindly follow the trend: Don't be swayed by market sentiment and other people's opinions, operate according to your own operation plan, market information is complicated, and blindly following the trend is easy to fall into the dilemma of chasing ups and downs.
2. During the transaction, we will continue to pay attention to news and technical changes, inform us in time if there are changes, strictly implement trading strategies and trading disciplines, move forward steadily in the volatile market, and achieve stable asset appreciation.

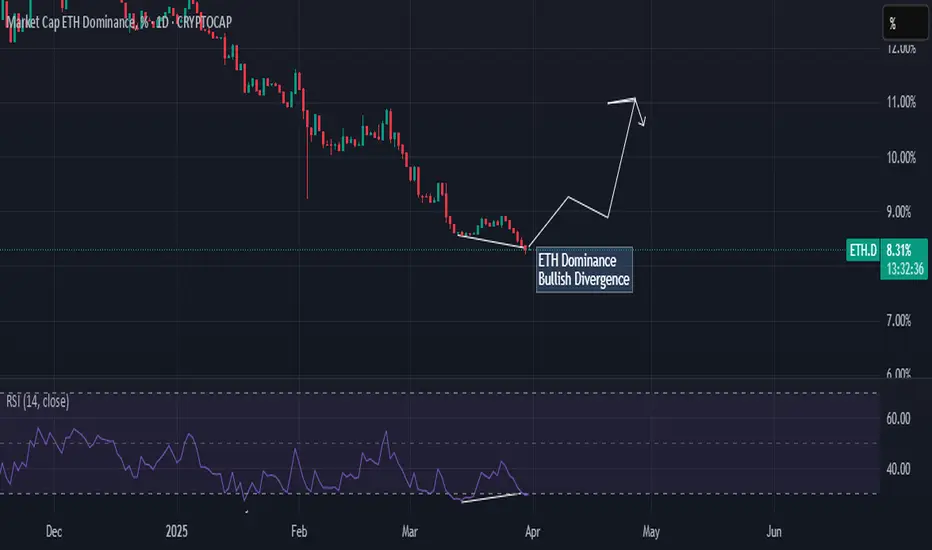
ETH.DOMINANCE Bullish divergenceIn ETH.DOMINANCE chart show clear bullish divergence on daily timeframe which means ETHUSD and ALTCOINS in bullish momentum in coming days. Stay focus on bullish side and ready for uptrend.
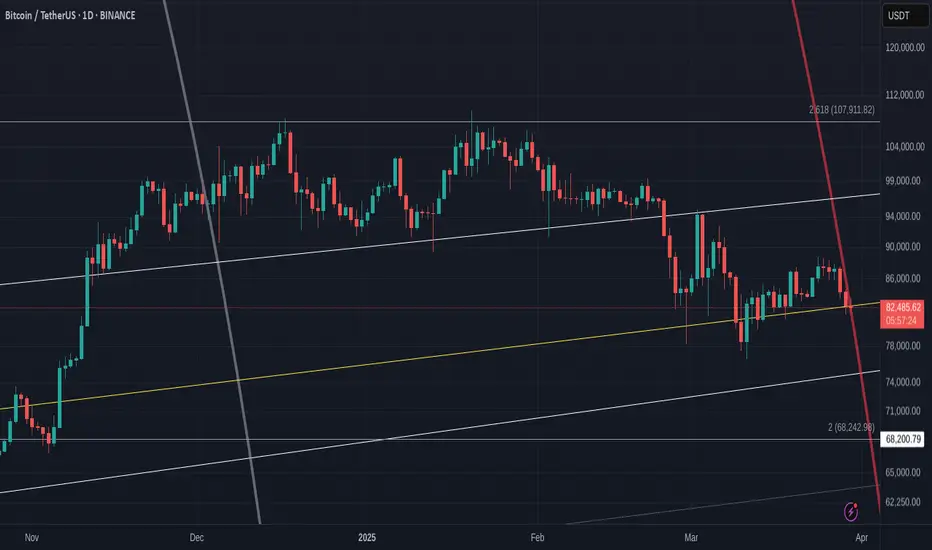
Bitcoin hit that 236 Fib circle I warned you about- and now ?As we come to the end of the week, we see the potential for further drop as PA slides along that 236 Fib circle. ( Red)
It NEVER ceases to amaze me how PA reacts to Fib circles and yet, as if by magic, there is some Macro News at exactly the same time
On this occasion, It seems the US inflation figures on Friday caused this Drop in price.
This Chart is the daily verion of the Weekly chart i often post about weekly candle closes.
I trust this chart
The chance for a drop to arounf 75K is very real and if that fails, down to the 2 Fib extension arounf 68K, though I think that is unlikely
We do need to watch on which side of thois Fib circle PA sits tomorrow. - Idealy, it breaks through tonight and next week candle sits on the "Support" side on the circle.
If it remains as resistance, A Steep drop is highly likely.
In my opinion.
Daily MACD is turned down, heading towards it ssignal line. If that crosses, the Daily becomes very BEARISH
We have to wait and see what happens and be ready to react.
I do have SPOT buy orders around 78 K
If we Drop Lower, I will dig up some funds and buy more lol
WE WAIT FOR WEEKKY CLOSE
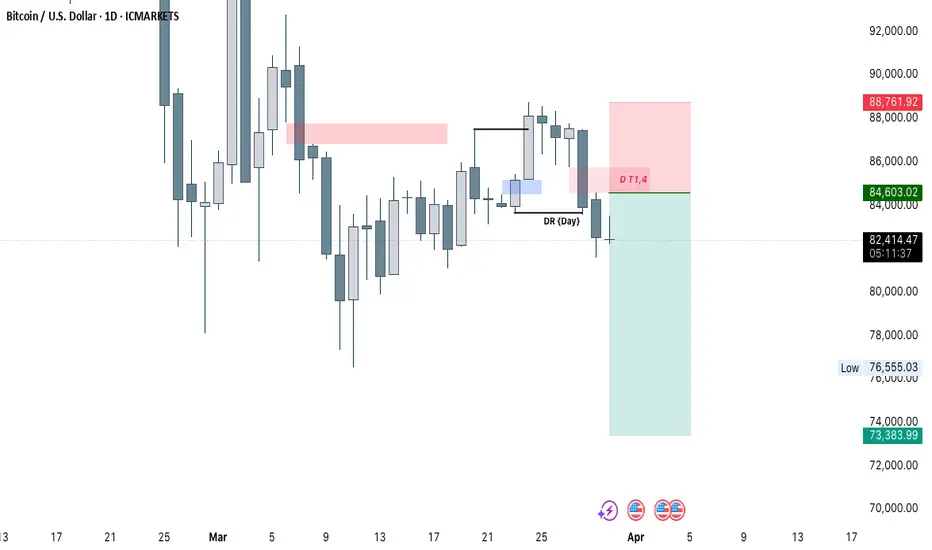
Bearish Daily Setup - BTC/USD
### **📉 Bearish Daily Setup - BTC/USD**
**Bias**: Bearish
**Context**: Daily DR (Dealing Range) is broken, and price is rejecting premium level.
---
### 🧠 **Narrative:**
Price traded into a daily FVG (Fair Value Gap) near **premium zone**, then formed a lower high. The daily **DR (Dealing Range)** was broken to the downside, showing bearish intent. We also see rejection from a marked supply area (pink zone), confirming seller presence.
---
### 📌 **Entry:**
Sell entry around **84,600** (near retest of daily FVG & imbalance zone)
---
### 🎯 **Targets:**
- **TP1**: 76,555 (Recent low / liquidity pool)
- **TP2**: 74,000 (Clean imbalance area)
- **TP3**: 73,383 (Final liquidity draw)
---
### 🛑 **Stop Loss:**
Above recent high / supply zone
**SL**: 88,762
---
### 🔢 **RRR**: Approx. **1:4** (Excellent reward-to-risk)
---
### 🧩 **Extra Confluences:**
- Daily FVG (imbalance) filled and rejected
- Supply zone respected
- DR broken
- Momentum shifted bearish
Bitcoin (BTC/USD) Breakdown – Rising Wedge Signals Further Drop!1. Chart Overview
This 4-hour BTC/USD chart from BITSTAMP presents a well-defined Rising Wedge pattern, which is a bearish reversal structure typically signaling an upcoming price decline. After a strong upward movement, Bitcoin formed a wedge pattern with higher highs and higher lows converging. This indicates weakening bullish momentum, leading to a confirmed breakdown.
2. Key Technical Elements & Market Structure
A. Rising Wedge Formation (Bearish Pattern)
A rising wedge is a bearish reversal pattern that appears after an uptrend, showing gradually weakening buying pressure.
The chart shows that price action was following an upward sloping support and resistance trendline.
The higher highs and higher lows formed within the wedge indicate a loss of bullish momentum.
Eventually, the price broke below the lower trendline, confirming a bearish breakdown.
B. Breakdown Confirmation
A decisive bearish candle broke below the wedge's lower trendline, confirming the downward move.
After breaking down, the price attempted a small retest of the wedge’s support, which has now turned into resistance.
This successful rejection from the previous support adds to the bearish confirmation.
C. Support & Resistance Levels
Resistance Level ($88,547):
This zone acted as a strong supply area, where previous bullish moves were rejected.
If BTC/USD attempts to recover, this area may provide selling opportunities.
Support Level ($79,193):
This is the next downside target, aligned with previous price consolidation zones.
A break below this support could trigger further selling pressure.
3. Trading Setup & Strategy
A. Short Trade Setup
Entry Point: After BTC/USD confirmed the breakdown of the rising wedge.
Stop Loss: Placed slightly above the $88,547 resistance level to limit risk.
Target Price: A decline towards $79,193, which aligns with the previous major support zone.
B. Bearish Market Sentiment
BTC/USD is currently trading below the wedge, reinforcing bearish bias.
A successful retest of the broken wedge support would validate further downside continuation.
If price remains below the $85,000 level, sellers are likely to maintain control.
4. Market Outlook & Next Price Action
Bearish Scenario
If BTC fails to reclaim the wedge breakdown level, further downside is expected.
A breakdown below $80,000 psychological level could increase selling momentum toward $75,000-$77,000 levels.
Volume analysis suggests that selling pressure is increasing.
Bullish Scenario (Invalidation)
If BTC/USD reclaims the $88,547 resistance and closes above it, the bearish bias could weaken.
Bulls need to break above the rising wedge resistance trendline for a reversal.
5. Conclusion & Trading Plan
The Rising Wedge pattern breakdown confirms a bearish outlook for BTC/USD.
The risk-reward ratio for a short trade is favorable, targeting a move down to $79,193.
Traders should watch for volume confirmation and trend continuation signals before entering.
Key Takeaways
✅ Bearish Bias confirmed after the Rising Wedge breakdown.
✅ Short Position setup with entry, stop loss, and target defined.
✅ Resistance at $88,547 - Failure to break above it strengthens the bearish case.
✅ Target at $79,193 - A strong support area where buyers may step in.
6. Tags for TradingView Post
#BTC #Bitcoin #Crypto #TradingSetup #TechnicalAnalysis #CryptoTrading #BearishPattern #RisingWedge #Breakdown #ShortTrade #PriceAction #SupportResistance #MarketAnalysis
Would you like any further refinements or additional insights? 🚀

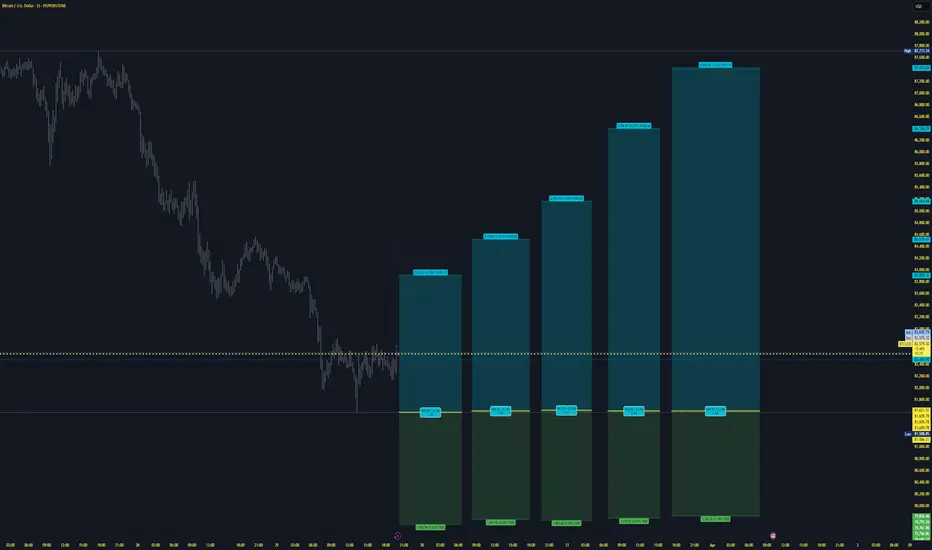
Bitcoin Breakout Confirmed, Aiming for $160K
Chart Analysis:
Bitcoin has just confirmed a major breakout above a key resistance zone, signaling a strong bullish continuation. Let’s dive into the details:
1.Ascending Triangle Breakout:
BTCUSD had been consolidating within an ascending triangle pattern since late 2024, with the upper resistance around $80,000 and a rising support trendline (highlighted in yellow).
The breakout above $80,000 on strong volume confirms the bullish pattern, which is typically a precursor to significant upward moves.
2. Accumulation Zone:
Before the breakout, Bitcoin spent several months in an accumulation zone between $53,837 and $80,000. This phase allowed buyers to build positions, setting the foundation for the current rally.
3.Price Targets:
The measured move of the ascending triangle (height of the pattern) projects a target around $160,000. The height of the triangle is approximately $26,163 (from the base at $53,837 to the resistance at $80,000). Adding this to the breakout point ($80,000 + $26,163) gives a target of ~$106,163. However, considering Bitcoin’s historical tendency to overshoot during bull runs and the psychological significance of $160,000 (as noted on the chart), this level seems like a realistic target.
4. Support Levels:
The previous resistance at $80,000 now acts as strong support. If BTC pulls back, this level should hold to maintain the bullish structure.
Additional support lies around $70,000, aligning with the lower boundary of the recent consolidation range.
5. Momentum Indicators:
While the chart doesn’t display specific indicators like RSI or MACD, the sharp upward move suggests strong momentum. Traders should monitor for overbought conditions on RSI (above 70) as BTC approaches higher levels, which could indicate a potential pullback.
Trade Idea:
Entry: Current price around $84,599.61 (post-breakout confirmation).
Stop Loss: Below $78,000 (to account for minor pullbacks while staying above the breakout zone).
Take Profit: $160,000 (primary target based on the pattern projection and psychological level).
Risk/Reward Ratio: Approximately 1:12, making this a high-probability setup.
Key Levels to Watch:
Resistance: $100,000 (psychological), $120,000, $160,000 (target).
Support: $80,000 (new support), $70,000 (secondary support).
Market Context:
Bitcoin’s breakout aligns with a broader crypto market uptrend, potentially fueled by positive fundamentals such as institutional adoption, favorable regulatory developments, or macroeconomic factors like inflation concerns driving demand for BTC as a store of value. Ethereum’s recent breakout (as seen in similar charts) also supports the bullish sentiment across the crypto market.
Conclusion:
BTCUSD has broken out of a multi-month consolidation pattern, confirming a bullish trend with a target of $160,000. The $80,000 level should now act as strong support, and any pullbacks to this zone could offer additional buying opportunities. Stay cautious of overbought conditions as BTC approaches higher resistance levels. Let’s see how far this rally can go!

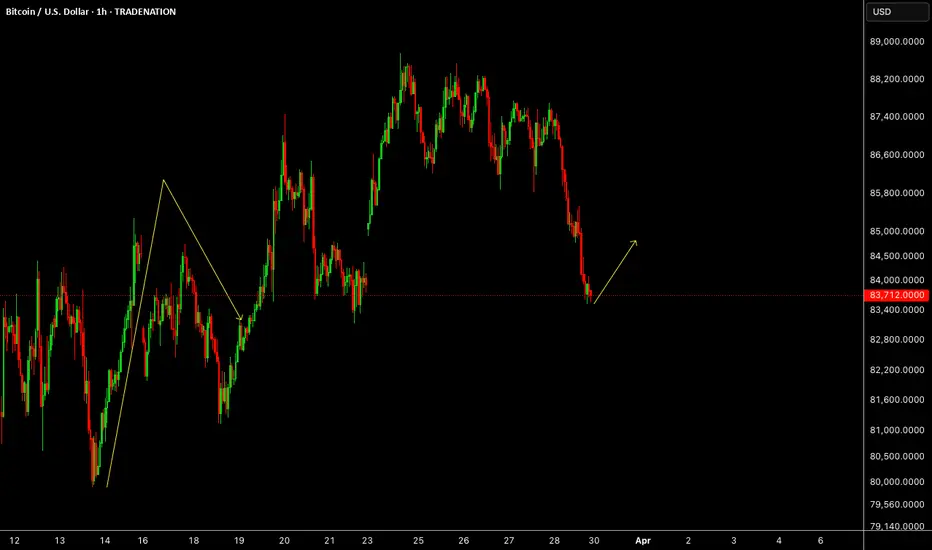
BTCWe are expecting BTC short term move towards 84K above for scalping.
Disclosure: We are part of Trade Nation's Influencer program and receive a monthly fee for using their TradingView charts in our analysis.
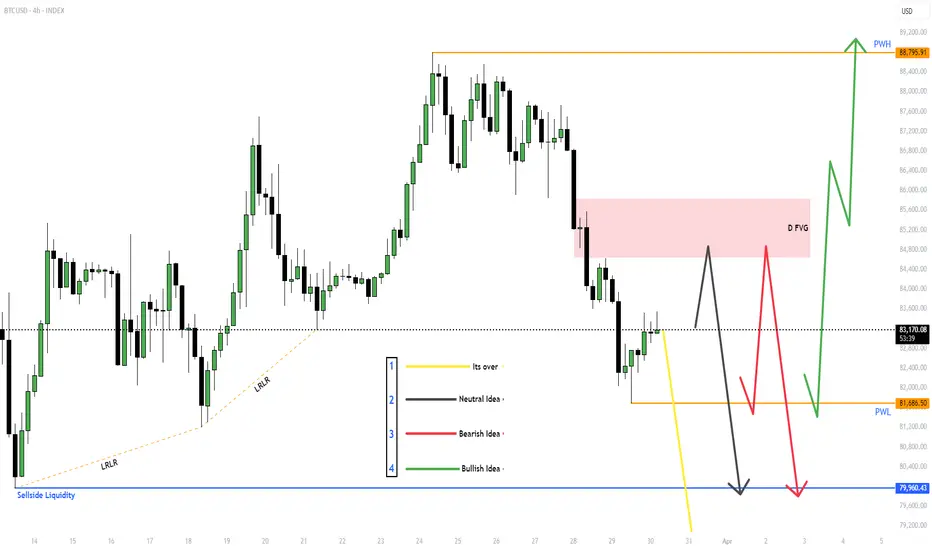
$BTC for Next week (31st March - 4th April)Given out all the ideas, Will react to the market based on which idea presents itself.
If Yellow line - Its better to stay out of the markets.
With the other wait for MSS (Market Structure Shift) and then take the trade and target the other side of the liquidity.
BITSTAMP:BTCUSD , BINANCE:BTCUSDT.P BINANCE:BTCUSDT
Overall I'm neutral on CRYPTOCAP:BTC but SEED_ALEXDRAYM_SHORTINTEREST2:NQ and NYSE:ES look bearish to me, and CRYPTOCAP:BTC could follow.
BTC/USDTwhat's the ultimate bear market signal?
it's the 50-week ema.
if CRYPTOCAP:BTC is above or reclaims the 50w ema it's bull mode. stay long
if CRYPTOCAP:BTC breaks below and can't reclaim it bear market vibes exit and wait.
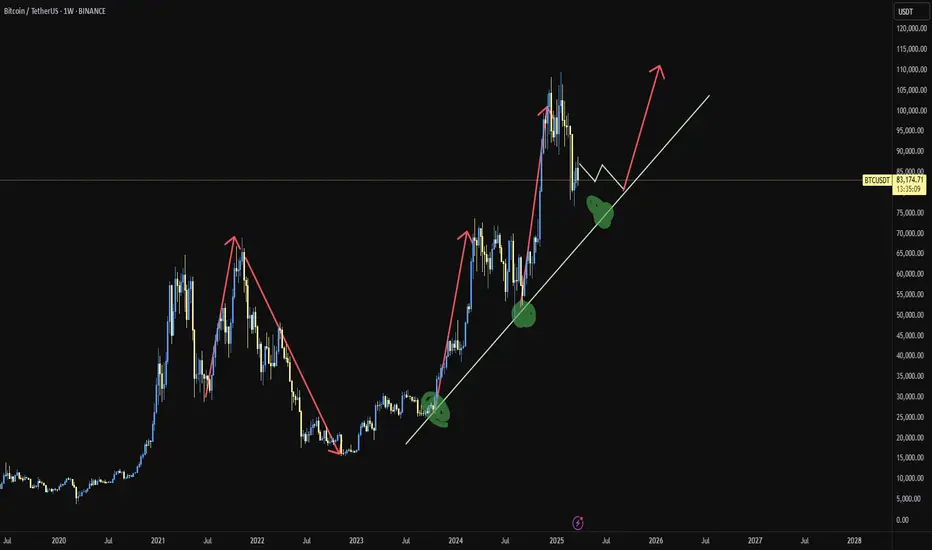
Bear cycle begins if this happens. Not the time of buy the dipI have been thinking this Bitcoin cycle has already peaked.
I am using a weekly chart here because I can fit in three BTC cycles on the screen, but it is more clear if you look at it in the Daily chart.
I am analysing the chart by using VWAP - Volume weighted moving average.
When you place VWAP (orange line) at the peak of each cycle you can see the pattern as below:
1) The price goes down steadily from the suspected peak price but eventually breaks above the descending trendline. (please check it in daily chart).
2) The price moves and closes above the descending trendine but the upside move is limited and price gets trapped and consolidate in the sideway for a few months (blue rectangular box).
3) VWAP acts as resistance line and eventually resumes the downside move.
4) By then, all momentum indicators are deep in the bear zone, and the bear cycle begins.
When I look at weekly and daily chart, I can see the same scenario is unfolding now.
I don't think the price will go straight down from here. There are good small swing trade opportunities in lower time frame for the next few months. However, if the price struggles to move above VWAP, the end of cycle scenario becomes more and more convincing.
It is just my humble opinion based on one style of analysis.
Final note:
Bitcoin price action has been very similar to NASDAQ100 and US500, and these charts are looking very dire. If US indices go down in the the next few months, Bitcoin will go with them.

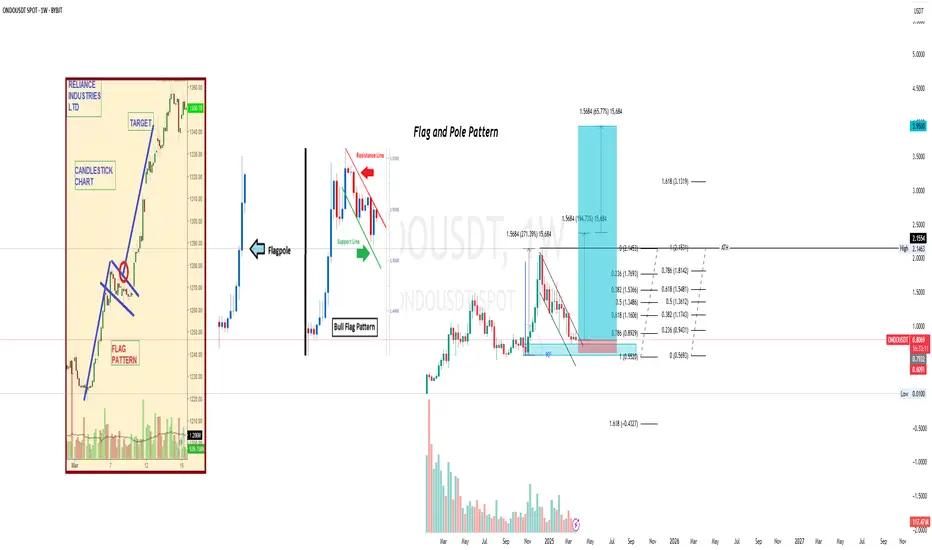
ONDO Flag and Pole Pattern 1 Week TimeframeWell, the Flag and Pole pattern is seen at a 1-week timeframe. Pirce may shift itself upwards.
Expecting a 3-month hold period.
BTC-----More around 83300, target 82000 areaTechnical analysis of BTC contract on March 30: Today, the large-cycle daily level closed with a small negative line yesterday, the K-line pattern continued to be negative, the price was below the moving average, the attached indicator golden cross was running with shrinking volume, and the fast and slow lines showed signs of sticking dead cross. From this point of view, the general trend of decline is still very obvious, and what we need to pay attention to in trading is to find a good entry point, keep short-term, and do a good job of risk control. Leave the rest to me! The short-term hourly chart continued the trend of shock correction after the decline in the European session yesterday. The current K-line pattern is continuous positive, and the attached indicator is running with a golden cross. Then it is likely to be corrected first within the term. The resistance position of the MA30 moving average is near the 83,300 area.
Today's BTC short-term contract trading strategy: sell at the 83,300 area, stop loss at the 83,800 area, and target the 82,000 area;
Bitcoin Short short ermThis is just a trade idea! And an idea is an idea and exists as an idea,as nobody can predict the markets. No body!
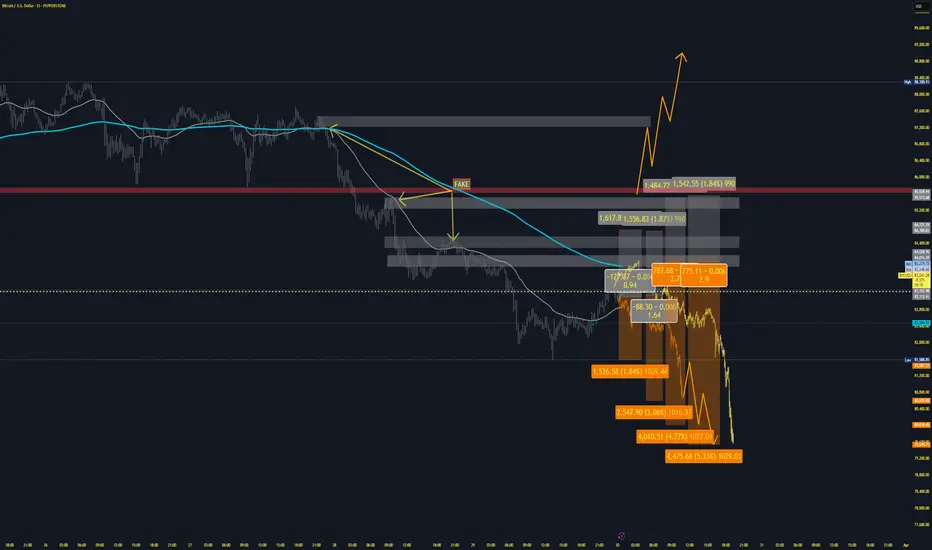
Some media say:Trump Pushes Advisers To Intensify Tariffs Ahead Of April 2.If it will be true ,
Then I prepare for this scenario(SEE THE CHART) above!.
Someoone commented below my last idea,he wants price action and I should draw lines and paint the charts for him . I wonder,that he doesent know that there is always price action! We just need to look at the charts. Above is also a chart. Lol.
But drawing lines, projection ghost lines is Not trading! It is drawing and painting.
Whatever: Fundamentals align with long term trend sentiment: Bearish. Sure surprises will always be present.Thats speculation! Therefor:Put always stops. And dont follow blindly any trade idea. Also my trade idea is just an idea. But you should take responssibility to take your own decision. Because you trade with your own money.
EMAS: 15 min. 200MA, 3min. 200MA
Stop above val of yesterday
Resisatnce:POC of yesterday red line. Breakthrough above the red line is bullish setup, and leading to val of yesterday
If rejected, falls back.If holds above the price will climb.I dont think that it happens, because the trend continutation pattern I use(There are billions of trend continuation patterns!!!!!!!! Also billions of ways to define a trend!!!!!)
is currently bearish!....
Ofcourse on any other TF you will have billions of reasons to do the opposite of trade idea,you you are welcomed.
Have a good trading day.
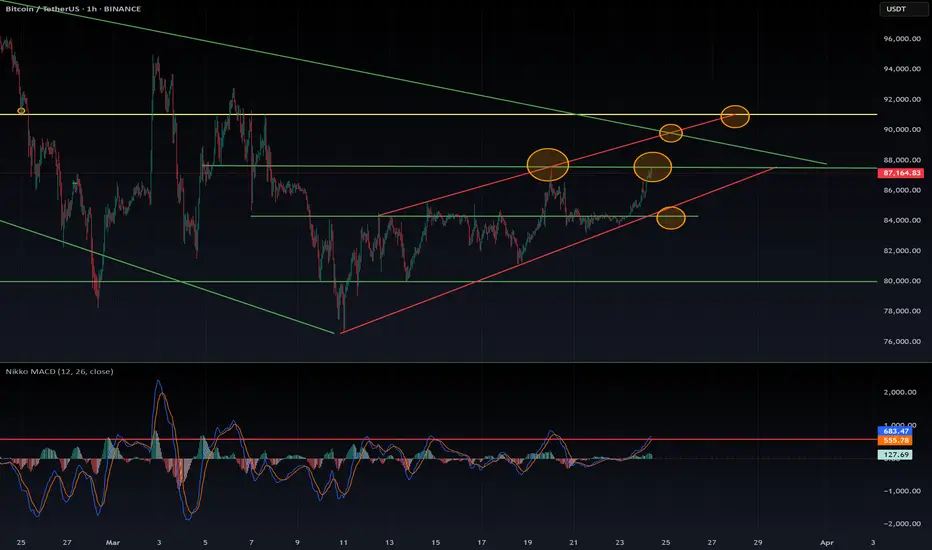
$BTC 1H Chart Analysis, what is next?📊 CRYPTOCAP:BTC 1H Chart Analysis
Things are not as simple as some analysts claim — the situation remains delicate.
🔑 Key Resistance Levels:
Double Resistance in Play:
- Descending Bearish Channel on the weekly timeframe.
- Previous Resistance from the March 20th pump.
🏗️ Current Market Structure:
Horizontal Consolidation Pattern:
- Top Resistance: $87.5K — potential rejection point.
- Bottom Support: $34.3K — previously a resistance, now acting as support.
📉 Possible Scenarios:
Bearish Scenario:
- Rejection at $87.5K could lead to support at: $34.3K (Green horizontal support).
- $33.5K (Red ascending pattern bottom).
Bullish Invalidation: Break and hold above $91K would invalidate the bearish downtrend.
If successful, we likely avoid retesting $80K.
📅 Conclusion:
Until CRYPTOCAP:BTC breaks $91K, we remain in a bearish downtrend, despite the short-term daily uptrend.
The weekly timeframe suggests we could still reverse and go lower if $90K holds as resistance.
#Bitcoin #Crypto #MarketAnalysis #BTC #Trading #CryptoNews
DYOR
Bitcoin Part2: Bullish Trade longBad economy,global inflation,recessive U.S. economy,hypes,uncertainly, the white house policy.
All these facts matter:They put the markets under massive pressure
Where is the chance: To plan different scenarios and models that have benn working in such similar scenarios. 202 is a good example, as the markets suddenly experienced big pressure.
Last not least, the FED transistory inflation, that wasnt real inflation, now indeed is becoming a dangerouse reality: We will have higher inflation, and global risks increasing.This will impact global liquidity inflow into markets.
Additionally we are noticing an outflow of the US stock markest, and increasing inflow of capital in foreign countries stock markets.
This are not good news for Bitcoin nor for crypto at all.
The chane in my opinion is just to think reverse.like 2020
Sell when positive news from the Whitehouse andpositive tone from FED.
Buy when White house talking and announcing threadful tariffs and if FED talks negatively.
Why?Because we have indieed real thread of inflation, and FED is the more competent team, who really now does everything to tame the inflation.Therefor i beleive them more.
Also short term contarian trade is just planned for max 24-48 hours. not longer
As the volatility rises.
Helding positions for more periode of time means increasing the risk.Upwards and downwards.