Bitcoin - Post-Breakout Compression at the Gate of Fibo - 0.786.⊣
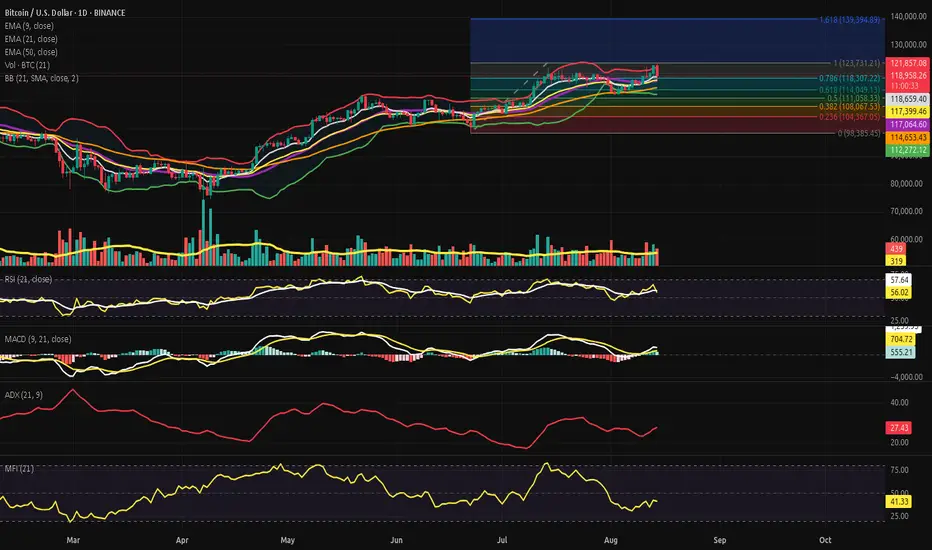
⟁ BTC/USD - BINANCE - (CHART: 1D) - (Aug 14, 2025).
◇ Analysis Price: $118,876.69.
⊣
⨀ I. Temporal Axis - Strategic Interval - (1D):
▦ EMA9 - $118,643.08:
∴ Price has pulled back toward the EMA9 after peaking at the recent (ATH of $123,731.21);
∴ Current positioning above EMA21 and EMA50 keeps the short-term trend intact despite the intraday retracement;
∴ EMA9 slope remains positive, signaling residual bullish momentum.
✴️ Conclusion: Short-term dynamic support intact; breach would increase pressure toward EMA21.
⊢
▦ EMA21 - $117,392.05:
∴ Serves as the first significant swing-support layer in the daily structure;
∴ Distance between EMA9 and EMA21 is narrowing due to today’s sell-off;
∴ Sustained closes below EMA21 would threaten the current daily uptrend.
✴️ Conclusion: Structural pivot for sustaining the bullish daily cycle.
⊢
▦ EMA50 - $114,650.23:
∴ Represents medium-term equilibrium and major market memory zone;
∴ Considerable gap between price and EMA50 indicates an extended run from equilibrium;
∴ A deeper retracement could naturally gravitate toward this zone for rebalancing.
✴️ Conclusion: Last defensive bastion before mid-term trend deterioration.
⊢
▦ BB (21, 2) - Upper: 121,847.18 / Basis: 117,060.71 / Lower: 112,274.25:
∴ Price reached the upper band during the ATH spike, triggering volatility expansion;
∴ Retraction from the upper band indicates profit-taking pressure;
∴ Basis line aligns closely with EMA21, reinforcing its importance as structural midline support.
✴️ Conclusion: Current movement reflects band rejection; volatility contraction likely if basis holds.
⊢
▦ Volume (21) - Current: 397 / MA: 317:
∴ Above-average daily volume during ATH session confirms real participation;
∴ Today’s sell-side volume surge shows immediate counterforce;
∴ Sustained high volume in both directions could precede a range formation.
✴️ Conclusion: Market is in active price discovery with heightened participation.
⊢
▦ RSI (21, 9) - RSI: 55.87 / Signal: 57.61:
∴ RSI cooled off from near overbought levels (above 70) toward midline;
∴ Positive divergence versus recent price pullback not yet visible;
∴ Momentum has weakened but remains in bullish territory above 50.
✴️ Conclusion: Momentum is consolidating; failure to hold 50 will shift control to sellers.
⊢
▦ MACD (9, 21, 9) - MACD: 548.09 / Signal: 702.94 / Histogram: 1,251.03:
∴ MACD histogram contracting, indicating fading bullish impulse;
∴ Cross-over risk emerging if current trajectory persists;
∴ Still in positive zone, showing bulls have residual control.
✴️ Conclusion: Bullish momentum waning; MACD line needs resurgence to avoid daily cross-down.
⊢
▦ ADX (21, 9) - 27.43:
∴ ADX below 30 suggests trend strength is moderate;
∴ Rising slope in recent days indicates a possible re-acceleration attempt;
∴ Low-to-mid readings show this ATH push lacked extreme trend force.
✴️ Conclusion: Trend strength improving but not yet at dominant breakout levels.
⊢
▦ MFI (21) - 41.60:
∴ MFI pulled back sharply from high 70s toward neutral zone;
∴ Indicates capital outflow matching the retracement in price;
∴ Still above oversold threshold, leaving room for either renewed inflow or deeper drawdown.
✴️ Conclusion: Liquidity pressure present; directional bias still undecided.
⊢
▦ Fibonacci Retracement - (from $98,385.45 to $123,731.21):
∴ 0.0: 98,385.45 – cycle origin;
∴ 0.236: 104,367.05 – minor support;
∴ 0.382: 108,067.33 – intermediate support;
∴ 0.500: 111,068.53 – psychological & technical balance;
∴ 0.618: 114,049.13 – golden retracement zone;
∴ 0.786: 118,307.22 – rejection point in current candle;
∴ 1.000: 123,731.21 – ATH resistance;
∴ 1.618: 139,394.89 – next major extension target.
✴️ Conclusion: Price reaction at 0.786 signals a possible retracement cascade unless recovered.
⊢
🜎 Strategic Insight - Technical Oracle:
∴ The daily chart reveals a market in the aftermath of a sharp thrust to ATH, now facing immediate rejection at the Bollinger upper band and (Fibo - 0.786);
∴ EMA structure remains bullish but compression between EMA9 and EMA21 signals a vulnerability window;
∴ Momentum (RSI, MACD) is losing altitude, while trend force (ADX) is only moderately engaged; ∴ Liquidity flow (MFI) shows sellers matching buyer aggression post-ATH;
∴ The golden retracement at 0.618 aligns with EMA50 as a potential deeper support target if selling accelerates. Bulls must reclaim (Fibo - 0.786) quickly to preserve the breakout narrative.
⊢
𓂀 Stoic-Structural Interpretation:
∴ The chart speaks in tempered cadence - the market reached upward into new territory, only to feel the weight of its own ascent pressing back;
∴ Structure remains poised, with EMA lines still aligned to the north, yet their narrowing gap whispers of momentum’s fatigue;
∴ Momentum and liquidity indicators agree in their caution: the thrust was bold, but the grip on this altitude is not yet certain;
∴ (Fibo - 0.786) stands as the immediate gatekeeper - a threshold where either conviction renews or gravity takes its due;
∴ Trend force is not absent, but it is not yet the roar of inevitability; the ADX reads not triumph, but preparation;
∴ Inflows and volume affirm the battle is active, not concluded - the field is contested, not surrendered.
⚖️ The Stoic mind sees in this neither triumph nor defeat, but the natural stillness between impulse and outcome - a moment to fortify structure, for in patience the stronger hand prevails.
⊢
✦ Structure holds, yet breathes caution.
▦ This is a post-breakout compression - the market testing its new heights while equilibrium forces gather for the next decisive move.
⊢
· Cryptorvm Dominvs · MAGISTER ARCANVM · Vox Primordialis ·
· Dominivm Cardo Gyratio Omnivm · Silence precedes the next force. Structure is sacred ·
⊢