Bitcoin Structure in Stillness, Power in Silence, Just Control?⊣
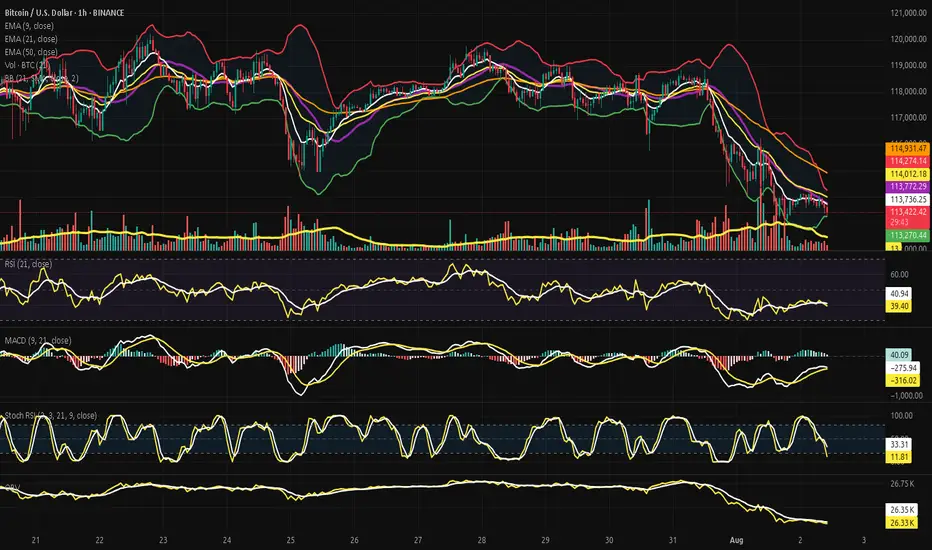
⟁ BTC/USD - BINANCE - (CHART: H1) - (Aug 02, 2025).
◇ Analysis Price: $113,869.77.
⊣
⨀ I. Temporal Axis - Strategic Interval - (1H):
▦ EMA9 - ($113,889.32):
∴ The price is trading just below the EMA9, which acts as immediate reactive resistance;
∴ The short-term slope remains negative, with no breakout signal;
∴ Buyers are unable to push the price above this threshold, indicating technical weakness.
✴️ Conclusion: Momentum remains capped; the EMA9 has not been reclaimed.
⊢
▦ EMA21 - ($113,896.52):
∴ The EMA21 stands as a tactical compression line in this range;
∴ The close proximity of EMA9 and EMA21 forms a technical knot - indecision zone;
∴ Past rejections in this region reinforce it as a powerful barrier.
✴️ Conclusion: Mid-range resistance holds; continuation is blocked unless breached with volume.
⊢
▦ EMA50 - ($114,128.22):
∴ EMA50 defines the current macro resistance on the 1H chart;
∴ The price has yet to test this level directly after the last drop;
∴ For structural recovery, this line must be broken cleanly with follow-through.
✴️ Conclusion: Primary obstacle on the path to reversal - decisive zone.
⊢
▦ BB (21 + EMA9) - Status: Compression:
∴ Bands are tightening around the price, signaling low volatility;
∴ Price action is contained within the central channel;
∴ Indicates upcoming volatility spike - direction still unknown.
✴️ Conclusion: Volatility compression is active; no directional bias confirmed.
⊢
▦ Volume + EMA21 - (3.84 BTC):
∴ Trading volume remains below the EMA21 period average;
∴ No surge of bullish commitment visible;
∴ Momentum lacks conviction without participation.
✴️ Conclusion: Absence of volume undermines the strength of any move.
⊢
▦ RSI (21, 9) - (42.37):
∴ RSI hovers in the lower neutral band - weak momentum;
∴ Slight upward curve suggests a modest rebound;
∴ No divergence or strength signal confirmed.
✴️ Conclusion: Minor relief rally underway - structurally weak.
⊢
▦ MACD (9, 21, 9) - (MACD: -238.89 / Signal: -340.58):
∴ Bullish crossover confirmed, histogram positive;
∴ Both lines remain in bearish territory - (below zero);
∴ Trend momentum is building but not strong enough to reverse.
✴️ Conclusion: Technical rebound in play - not a structural shift.
⊢
▦ Stoch RSI (3, 3, 21, 9) - (%K: 58.90 / %D: 52.70):
∴ Positive crossover established and advancing in neutral-upper zone;
∴ No overbought signal;
∴ Possibility of further upside if confirmed with price action.
✴️ Conclusion: Oscillator supports continuation - contingent on volume.
⊢
▦ OBV (21, BB2) - (26.35K):
∴ OBV remains flat, indicating market indecision;
∴ No divergence with price movement;
∴ No fresh buying pressure detected.
✴️ Conclusion: Neutral volume behavior - flow not favoring bulls.
⊢
🜎 Strategic Insight - Technical Oracle:
∴ The 1H chart of (BTC/USD) reveals a battlefield sealed in compression and anticipation.
The price is locked beneath converging exponential resistances (EMA9, EMA21, EMA50), forming a triple entrenchment zone. None have been broken - each rejection reinforces the stronghold;
∴ The Bollinger Bands constrict like a ritual binding. Volatility is silent - too silent - awaiting the spark. Yet no participant steps forward with force; volume remains suppressed, showing that neither side has declared war;
∴ Momentum oscillators (RSI, Stoch RSI) hint at an upward drift, but these are echoes, not proclamations;
∴ The MACD crossover is not a trumpet - it is a murmur in the underworld, below the zero line, concealed from the living trend;
∴ The OBV confirms it: no one is entering the field with conviction. This is not a battlefield - it is a waiting room;
✴️ And yet, amidst this silence, the Code speaks:
∴ If the zone between ($114.1K and $114.6K) is breached with volume and confirmation, this will mark the first true structural challenge to the prevailing descent. If it fails - the repique folds into another trap, devoured by gravity.
⊢
∫ II. On-Chain Intelligence - (Source: CryptoQuant):
▦ Exchange Inflow Total + EMA9 - (All Exchanges) - (6.2K BTC):
∴ The total Bitcoin flowing into centralized exchanges remains subdued, with no signs of aggressive sell-side pressure;
∴ The EMA9 confirms a flat, low-intensity behavior, distinct from capitulation spikes;
∴ The absence of major inflows during price compression implies a strategic wait state.
✴️ Conclusion: No incoming threat detected - institutions are not preparing to sell.
⊢
▦ Exchange Netflow Total + EMA9 - (All Exchanges) - (-644.5 BTC):
∴ Netflow remains negative, indicating Bitcoin is being withdrawn from exchanges rather than deposited;
∴ A negative netflow during a price downtrend reflects silent accumulation behavior or rotation into cold storage;
∴ The EMA9 shows a consistent drainage pattern, not episodic outflow.
✴️ Conclusion: This confirms defensive posture by large holders - supporting the technical compression.
⊢
▦ Spent Output Profit Ratio - (SOPR) + EMA9 - (1.003):
∴ The SOPR hovers just above 1.0, suggesting coins moved on-chain are being sold at or near cost basis;
∴ No signs of aggressive profit-taking or panic selling - rather, equilibrium behavior;
∴ The 9-period EMA confirms stability in this zone.
✴️ Conclusion: Market psychology is suspended - no one is winning or losing.
⊢
🜎 Strategic Insight - On-Chain Oracle:
∴ All on-chain signals reflect preparation without declaration;
∴ No pressure enters, and no blood leaves;
∴ The field is not empty - it is coiled;
∴ Withdrawals - (Netflow) - suggest protective accumulation;
∴ Low Inflow signals no new panic supply;
∴ SOPR near 1.0 says: (We're all waiting - and none are ahead);
∴ The technical compression in price is not betrayed by the chain;
∴ The silence is consistent;
∴ But silence is not peace - it is a veil.
✴️ Conclusion: If volume does not breach $114.6K - all remains a ghost echo beneath resistance.
If broken - the coil unwinds.
⊢
⧉ III. Contextvs Macro-Geopoliticvs - Interflux Economicvs - (Aug 02, 2025):
⟁ All movements of the market's breath are influenced not only by price, nor volume, but by the tides beyond the chart. Here begins the reading of the outer realm:
▦ EVENTVM I - (Wall Street Silent Accumulation) - (U.Today + Coindesk):
∴ Institutional actors are actively acquiring BTC and ETH through stealth operations - not OTC spikes, but ETF inflows and treasury balance shifts;
∴ Tom Lee (Bitmine/Fundstrat) confirms: Wall Street is not waiting for clarity, it is accumulating in silence;
∴ SEC’s Project Crypto and “in-kind” ETF mechanisms further reduce friction for institutional entry.
✴️ Conclusion: Price stagnation conceals power transfer - retail hesitates while funds consolidate control.
⊢
▦ EVENTVM II - (SEC’s “Project Crypto” Activation):
∴ Regulatory framing under “Project Crypto” unfolds in phases: transparency, compliance infrastructure, and institutional bridges;
∴ Despite its regulatory mask, the program facilitates liquidity channels into crypto markets;
∴ Legalized ETF's now serve as strategic vacuum points for Bitcoin supply.
✴️ Conclusion: What appears as regulation is in fact an alignment mechanism - structure over rebellion.
⊢
▦ EVENTVM III - (July ETF Flows (US) - $12.8B Inflow):
∴ U.S.-based crypto ETF's report record-breaking $12.8 billion inflows in July alone;
∴ Largest flows tracked in BlackRock, Fidelity, and VanEck vehicles - no signs of reversal;
∴ These flows occurred during price weakness, not during breakout - a signature of accumulation.
✴️ Conclusion: The public hesitates while custodians act - the veil of weakness conceals a new floor.
⊢
🜎 Strategic Interpretation - Macro Context:
∴ The charts compress. The flows retract;
∴ But the outer forces converge - Wall Street is no longer watching. It is acquiring;
∴ Through structure, silence, regulation, and engineering of access;
∴ This is no longer the market of peer-to-peer rebellion;
∴ This is the codification of power into institutional hands;
✴️ Conclusion: Price may appear static - but ownership is shifting.
⊢
𓂀 Stoic-Structural Interpretation:
∴ The chart does not lie. The data does not beg. The market does not care. Bitcoin remains trapped beneath resistance - not by force, but by inaction, by lack of intention, by silent contest;
∴ On-chain signals whisper: no one is selling in panic, no one is buying in euphoria;
∴ The macro realm reveals: the hands of power are moving beneath regulation, using silence as shield;
∴ Thus we see a paradox - the technical shell compresses, the on-chain bloodstream circulates without fever, the macro structure redefines.
⚖️ The Stoic mind recognizes this not as chaos, but as necessary stillness.
∴ The Arcane practitioner does not chase a move - he maps the pressure points and waits;
∴ He acts only when the veil thins;
∴ To act prematurely is to violate the structure;
∴ To wait blindly is to betray the will;
∴ The Stoic Arcane path demands this: know the boundary, seal the insight, then act - once - with clarity;
∴ At ($114.6K) the veil may part. If it does not - the silence continues.
⊢
✦ Structure Bearish.
▦ This is a bearish containment, not a breakdown.
∴ The market is not collapsing - it is being held below by absence of volume, of intention, of structural reversal;
∴ The EMA's are stacked above like iron gates;
∴ The price has failed to break $114.6K - the veil remains intact;
∴ On-chain data confirms neutrality, not optimism;
∴ Macro signals suggest accumulation by institutions - but not defense for the public.
⊢
🜎 Therefore:
∴ Technically Bearish - (structure not yet reversed);
∴ Tactically Neutral to Bearish - (fragile repique);
∴ Strategically in Transition Phase - (institutions buying beneath silence).
✴️ Conclusion: Until ($114.6K) is broken with conviction, the structure remains bearishly biased - wrapped in stillness.
⊢
⧉
· Cryptorvm Dominvs · MAGISTER ARCANVM · Vox Primordialis ·
⚜️ ⌬ - Silence precedes the next force. Structure is sacred - ⌬ ⚜️
⧉
⊢
Btcusdbinance
Bitcoin Monthly - Structure Intact, Tension Rising?⊣
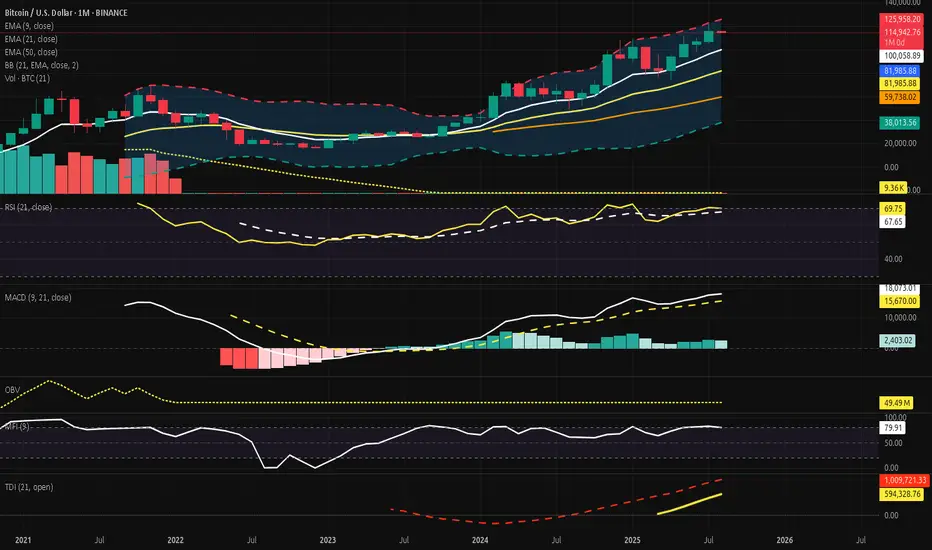
⟁ BTC/USD - BINANCE - (CHART: 1M) - (Aug 01, 2025).
◇ Analysis Price: $114,994.73.
⊣
⨀ I. Temporal Axis - Strategic Interval - (1M):
▦ EMA9 - ($100,069.29):
∴ Price holds 14.93% above this dynamic threshold, indicating momentum continuation but also positioning within an overheated range;
∴ The EMA9 structure is firmly ascending, representing the spine of the short-term bullish wave;
∴ July’s candle remains fully above the EMA without testing it - no wick beneath the line-marking dominance of buyers without internal correction.
✴️ Conclusion: The EMA9 governs the tempo of the current trend and stands untouched. Elevated, but structurally intact.
⊢
▦ EMA21 - ($81,990.60):
∴ A core support vector in the macrostructure, now 28.73% below price, suggesting strong bullish detachment from equilibrium;
∴ The line maintains a smooth, upward slope, echoing the recovery arc since late 2022’s structural low;
∴ Its alignment with the Bollinger Basis and Realized Cap forms a triad of reinforced technical stability.
✴️ Conclusion: EMA21 anchors the mid-term uptrend and guards the sanctum of continuation. No breach, no threat.
⊢
▦ EMA50 - ($47,983.10):
∴ Deep beneath price, resting at 58.27% below the current level - a relic of past cycles, yet still relevant as ancestral support;
∴ The EMA50 has curved upward subtly, signaling the final stage of long-term bear cycle recovery;
∴ Price has not interacted with this zone since late 2023, preserving its status as last-resort structural bedrock.
✴️ Conclusion: EMA50 serves as the sacred foundation of the macro trend - distant, but silently upholding the higher order.
⊢
▦ BB (21, 2) - ($81,990.60, $124,871.91, $39,109.29):
∴ The Basis of the bands aligns precisely with the EMA21, confirming equilibrium at ($81,990.60) - the mid-guardian of the macro cycle;
∴ The Upper Band is currently intersecting the candle body at ($124,871.91), marking an imminent volatility ceiling that may trigger either breakout or rejection;
∴ The Lower Band rests at ($39,109.29), far beneath the trend structure, now serving as a shadow chamber rather than an active field of probability.
✴️ Conclusion: The BB channels have opened widely, signaling expansion. With price nearing the upper rim, the phase is volatile but directional. The core remains intact through the EMA21 basis.
⊢
▦ Volume + EMA21 - (37.62B, 29.71B):
∴ Monthly volume for July reached $37.62 Billion, standing above the EMA21 of volume at $29.71 Billion, indicating an active expansion phase in market participation;
∴ This is the third consecutive monthly close above the EMA21, forming a sequence of rising activity that mirrors the price climb - suggesting healthy conviction behind the movement;
∴ The volume body also aligns with bullish momentum confirmation, as it occurs within an ascending slope of the EMA21, avoiding false divergence or exhaustion patterns.
✴️ Conclusion: Volume expansion supports the current trend. The flow is consistent, not speculative.
⊢
▦ RSI (21, 9) - (69.79, 64.71):
∴ The RSI main line stands at (69.79), nearing the classical overbought threshold but not breaching it, reflecting a strong yet controlled uptrend;
∴ The signal line (9-period smoothing) trails at (64.71), confirming positive pressure without showing divergence - both curves remain aligned and ascending;
∴ There is no crossover, no rejection, and no curvature breakdown - suggesting momentum still leans bullish, but the zone is tightening.
✴️ Conclusion: RSI reveals active strength under equilibrium control. Nearing the gates of exhaustion, but no conflict yet.
⊢
▦ MACD (9, 21, 9) - (4,172.31 / 3,423.95 / +748.36):
∴ The MACD Line remains well above the Signal Line, holding a spread of (+748.36), confirming an active momentum cycle;
∴ Both lines are above the zero axis, reinforcing a long-standing bullish wave with consistent inertia since late 2023;
∴ The Histogram is positive, though it shrinks slightly from previous months, suggesting a potential slowing of force - not a reversal, but a breath.
✴️ Conclusion: The MACD still flows in favor of the bulls. The pulse continues, yet shows first signs of contraction. Momentum remains, but vigilance awakens.
⊢
▦ OBV (21, BB2) - (10.27M / 9.82M / 11.19M / 8.45M):
∴ The OBV line rests at (10.27M), positioned above the Basis (EMA21 at 9.82M), indicating a net accumulation bias over the mid-term;
∴ It remains within the upper half of the Bollinger channel, but beneath the upper band, currently at (11.19M), suggesting accumulation without climax;
∴ The bands are widening, signaling expanding participation and heightened flow volatility - yet without destabilization.
✴️ Conclusion: OBV confirms active, steady inflow. Accumulation sustains the structure. Flow is present, but not yet euphoric.
⊢
▦ MFI (EMA9) - (79.90 / 74.63):
∴ The MFI registers at (79.90), resting near the upper saturation zone, traditionally viewed as overbought - but no rejection candle has occurred;
∴ The 9-period EMA smoothing line at (74.63) trails cleanly beneath, reinforcing directional alignment without divergence;
∴ This spread between the MFI and its smoothing curve affirms a persistent inflow dominance, though now nearing exhaustion thresholds.
✴️ Conclusion: The MFI reveals an environment of strong capital influx. Though high, it is not yet reversal-bound. Compression may precede contraction.
⊢
▦ TDI + EMA21 - (69.79 / 64.71 / / 62.00):
∴ The RSI Line (TDI core) sits at (69.79), nearing the volatility band’s upper arc, denoting strong upward rhythm but with limited expansion room;
∴ The Signal Line at 64.71 lags slightly, confirming the trend with no divergence or curvature weakness;
∴ The Volatility Bands (±10 around Signal) contain price action cleanly - upper band at (74.60), lower at (58.83) - showing moderate but controlled pressure;
∴ The EMA21 overlay at (62.00) forms the base layer, maintaining upward inclination and reinforcing long-term trend security.
✴️ Conclusion: The TDI remains bullish, harmonized, and stable. Momentum leads, volatility permits. No rejection yet, but expansion space is finite.
⊢
🜎 Strategic Insight - Technical Oracle:
𓂀 The monthly structure reveals a state of controlled elevation within a structurally sound uptrend, yet with rising compression near upper bounds. The convergence of indicators outlines a field that is both fortified and tense;
∴ EMA9, EMA21, and EMA50 remain fully aligned and ascending - the Exponential Trinity forms a resilient foundation, untouched by regression;
∴ Bollinger Bands (21) have widened, and price now hovers near the Upper Band, suggesting that the volatility channel is at maximal stretch; further price advance may trigger short-term exhaust or rejection;
∴ Volume + EMA21 confirms that market participation has expanded meaningfully across three consecutive months - a sign of conviction rather than speculation;
∴ RSI (21, 9) and MFI (EMA9) hover in elevated zones, signaling latent overextension, yet without immediate signs of breakdown - still ruled by strength, not fear;
∴ MACD (9, 21, 9) retains bullish momentum, though its histogram begins to contract slightly, marking a potential early shift in impulse rhythm;
∴ OBV confirms accumulation without climax, and the TDI shows synchrony, yet the volatility band ceiling is near - a gateway, or a wall.
✴️ Synthesis Technical: The structure is strong, but stretched, all trend anchors remain intact, and no macro-reversal signal is present. However, the cluster of elevated oscillators and narrowed volatility envelopes warns:
∴ The next impulse will define the phase - either breakout beyond resistance ($125K+) or pullback to base zones near EMA21 (~$82K).
⊢
∫ II. On-Chain Intelligence - (Source: CryptoQuant):
▦ Realized Cap - UTXO Age Bands - ($437.6B):
∴ Capital density remains clustered in the 3m / 12m range, signifying strong mid-term holders anchoring price memory beneath $90K;
∴ The realized cap has risen steadily, confirming new capital commitment and reinforcing the EMA50 region as the “Arcane Bedrock”;
∴ No abrupt aging shift - holders have not fled, nor distributed heavily.
✴️ Conclusion: The realized cost base is lifting upward; Structure is strong beneath price.
⊢
▦ Whale to Exchange Transactions (Binance) - (Rising):
∴ Transfer spikes occurred in mid and late July, echoing pressure near technical ceilings;
∴ Whale flow to exchanges signals potential supply reloads, though no persistent distribution trend is confirmed;
∴ Activity suggests readiness, not execution - threat held in silence.
✴️ Conclusion: Whales signal tension, not aggression; Movement is tactical.
⊢
▦ MVRV Ratio + EMA9 - (2.257 / 2.039):
∴ The MVRV ratio holds above 2.0, implying price trades at over twice the realized cost basis - historically a zone of caution;
∴ No divergence from the EMA9; both slope upward - valuation expansion continues, but no climax;
∴ Price remains above the line of equilibrium, but not in parabolic distortion.
✴️ Conclusion: MVRV confirms overvaluation, but not detachment; Risk is elevated, but contained.
⊢
▦ Exchange Net Position Change (BTC) - (–35,871 BTC):
∴ Net outflows persist, with 35,871 BTC withdrawn in the last monthly cycle;
∴ This behavior aligns with strategic cold storage accumulation, reducing circulating pressure;
∴ On-chain confirms technical's: price rises on supply contraction, not mere speculation.
✴️ Conclusion: Bitcoin leaves the field; Supply retracts as price ascends; Structure reinforced.
⊢
🜎 Strategic Insight - On-Chain Oracle:
𓂀 The on-chain field reveals a fortified structure of conviction beneath the surface of price. Flow, cost basis, and behavior of dominant agents all signal a phase of controlled strength, though shadowed by rising valuation pressure;
∴ The Realized Cap ascends in harmony with price - an uncommon convergence. It suggests that new capital is not merely speculating, but embedding itself into the very structure of the network. The UTXO Age Bands reveal no panic rotation - holders remain;
∴ Whale Transactions to Exchanges rise in key moments, particularly around technical compression points. They do not yet dominate the flow, but stand ready - guardians or destroyers, in silence;
∴ The MVRV Ratio, though elevated, does not deviate violently. It warns, but does not collapse. It reflects a price above cost, but not a mania;
∴ The Net Exchange Position continues its descent. Bitcoin leaves the field; Supply contracts; This is not exit liquidity; This is strategic withdrawal.
✴️ Synthesis Technical: The network breathes in accumulation, not inflation; The participants anchoring this cycle are deliberate; On-chain structures confirm that value is migrating into dormancy, not into exits. The risk is not in structure collapse, but in overvaluation compression - a tightening halo around price.
⊢
⧉ III. Contextvs Macro-Geopoliticvs - Interflux Economicvs - (Jul 31, 2025 - Post-FOMC Strategic Decoding):
▦ FOMC Decision - (July 31, 2025):
∴ The Federal Reserve held its benchmark interest rate steady at (5.50%), marking the fourth consecutive pause - a clear stance of vigilant hold;
∴ The tone was neutral-hawkish, acknowledging progress on inflation while leaving the door open for future hikes if data demands;
∴ No mention of cuts. The Fed maintains narrative control - a message to both markets and sovereigns: we're not done yet.
▦ Jerome Powell’s Address:
∴ Powell reiterated the “data-dependent” framework, but expressed concern over sticky inflation in services and housing;
∴ He praised the resilience of the labor market, signaling no urgency to ease policy;
∴ His delivery was measured, ambiguous by design, injecting uncertainty - fuel for volatility, not clarity.
▦ Market Response - (Traditional Finance):
∴ The DXY (Dollar Index) swung sharply, but closed neutral, reflecting indecision over the Fed’s path;
∴ The S&P500 and Nasdaq attempted intraday rallies but reversed lower - a reaction to Powell not being “dovish enough”;
∴ Gold and Silver caught bids - hedges moved in, not out.
▦ Bitcoin (BTC/USD) Response:
∴ Bitcoin spiked on initial Fed release, tagging the upper Bollinger Band (1M) before retreating slightly - not a rejection, but a breath;
∴ No capital flight occurred. The response was measured and strategic, not speculative;
∴ On H4, Bitcoin touched the EMA200, reinforcing it as a post-FOMC decision point.
✴️ Macro Synthesis: The Fed sheathed the blade but did not lower the shield; Powell’s message: discipline remains. Markets flinched but did not panic; Bitcoin stood firm. This was not a moment of collapse - this was a moment of calibration.
⊢
⌘ Codicillus Silentii - Strategic Note:
𓂀 Let this note be written in the margin of all oracles, beneath the seals and above the motion: This is a cycle governed not by noise, but by intent restrained; The silence between macro movements, the calm in on-chain flows, and the geometry of structure all speak one truth:
The system is waiting;
There is no breakdown;
There is no climax;
There is only a tightening coil - one that neither confirms euphoria nor accepts rejection.
∴ Bitcoin holds above its sacred averages;
∴ The on-chain breath is slow, but pure;
∴ The macro field is firm, yet not soft.
⟁ The next force will not be a whisper - it will be a break or a roar.
✴️ Let no position be based in hope;
✴️ Let no assumption ignore volatility’s patience;
✴️ Let silence guide the strategy, not emotion.
⊢
𓂀 Stoic-Structural Interpretation:
∴ In the mirror of the arcane chart and the silence of on-chain flow, the Stoic lens reveals not merely price action - but the nature of motion itself;
∴ All movement is governed by tension and release, control and surrender. This cycle is no different;
∴ The trend holds, but does not rise arrogantly. It is disciplined;
∴ Capital flows, but not chaotically - it retreats where needed and commits only in strength;
∴ The macro world tempts chaos, but Bitcoin walks with its own gravity - unmoved unless chosen;
∴ Indicators show power without delusion, and pressure without collapse.
This is not a time for euphoria;
This is not a time for panic;
This is a time to observe structure, act with clarity, and remain unshaken.
✴️ The Stoic sees the signal beneath the storm:
Structure is intact;
Trend is valid;
Valuation is tense;
Strategy must remain cold.
⟁ Therefore, the Stoic does not chase candles; He waits for break of structure, or confirmation of continuation; No action is better than misguided motion.
⊢
✦ Structure: Bullish - (Controlled Phase).
∴ All key exponential moving averages - EMA9, EMA21, and EMA50 - remain aligned and ascending, with no curvature breakdown or crossover threat;
∴ Momentum indicators (MACD, RSI, TDI) are positive and synchronized, with no bearish divergence or rejection confirmed;
∴ Price holds above the EMA9 and remains well above the Bollinger Basis, signaling ongoing trend dominance;
∴ Volume exceeds its 21-month moving average, reflecting conviction, not hollow motion.
⟁ However:
∴ The structure is technically stretched - several oscillators approach saturation thresholds, signaling compression, not collapse;
∴ This is a bullish structure, but under strategic tension, not euphoria.
✴️ Final Judgment: Bullish Structure, currently in a compressed expansion state, preparing for either breakout continuation or technical correction - but showing no signs of structural reversal.
⊢
⧉
· Cryptorvm Dominvs · MAGISTER ARCANVM · Vox Primordialis ·
⚜️ ⌬ - Silence precedes the next force. Structure is sacred - ⌬ ⚜️
⧉
⊢
Bitcoin - Structural Ascendancy under Silent Momentum.⊣
⟁ BTC/USD - BINANCE - (CHART: 1D) - (Jul 29, 2025).
◇ Analysis Price: $118,996.40.
⊣
⨀ I. Temporal Axis - Strategic Interval - (1D):
▦ EMA9 - (Exponential Moving Average 9) - ($118,352.22):
∴ This short-term exponential blade reflects immediate price sensitivity, showing reactive balance across recent closes;
∴ Price currently floats above this threshold, indicating micro-support for the bulls - a soft floor in the fog of uncertainty;
∴ The EMA9 line curves gently upward, though not sharply - signaling lingering momentum, but without fury.
✴️ Conclusion: EMA9 acts as a dynamic support amid deceleration; a watchful line between calm consolidation and renewed ascent.
⊢
▦ EMA21 - (Exponential Moving Average 21) - ($116,729.10):
∴ This mid-range trend beacon provides clearer directional context - its upward slope holds the spell of continuity;
∴ Price rests safely above this median force, confirming bullish alignment;
∴ However, the arc begins to curve with less conviction, a signal that the current push is softening.
✴️ Conclusion: EMA21 maintains bullish structure but foretells potential slowing; if momentum dims further, this level may serve as magnet for retracement.
⊢
▦ EMA50 - (Exponential Moving Average 50) - ($112,511.79):
∴ The long-arm average projects the memory of the trend - the deep root under the recent canopy;
∴ Price is far above this line, a sign of strong prior conviction from bulls;
∴ Its firm inclination remains intact, yet price distance signals risk of gravitational return should upper momentum fracture.
✴️ Conclusion: EMA50 preserves bullish foundation, but may become a zone of rebalancing if the rally loses vitality.
⊢
▦ BB (21) - (Bollinger Bands + SMA21) - ($117,764.35):
∴ The Bands, ever sensitive to volatility’s breath, expand wide - a sign of elevated tension and price exploration;
∴ Price nears the upper band ($121,401.48), a common altar for speculative saturation and potential rejections;
∴ The median band (SMA) acts as equilibrium, now beneath the price - suggesting deviation from balance.
✴️ Conclusion: BB21 signals a volatile climax zone; price at the upper band often faces a verdict - continuation by force, or descent by default.
⊢
▦ Volume + MA21 - (Last - 148 vs Average - 363):
∴ Volume flows now with diminished voice - the current bar echoes only 148 units against a historical pulse of 363;
∴ Such silence beneath a rising price may betray a hollow rally - or a pause before engagement;
∴ Absence of participation often precedes reversal or sudden liquidity spikes.
✴️ Conclusion: Subdued volume undermines the bullish signal - lack of validation breeds caution in forward projection.
⊢
▦ RSI - (Relative Strength Index 21) - (61.41):
∴ RSI remains in neutral-high territory, not overbought, but clearly tilted toward bullish control;
∴ Momentum persists but shows signs of plateau - recent movement flattens after steady ascent;
∴ Without new strength, RSI may drift toward the median.
✴️ Conclusion: RSI shows bullish favor, but the fire beneath the trend cools; next candles will determine if it's pause or fade.
⊢
▦ MACD - (9, 21) - (Histogram: –455.70):
∴ MACD line at 2,078.82 vs Signal line at 1,623.12 suggests bullish dominance in structure;
∴ Yet the negative histogram tells a story of fading acceleration - as if the charge slows though direction holds;
∴ This divergence signals decay beneath strength, an omen of indecision.
✴️ Conclusion: MACD is structurally bullish, but its weakening impulse demands attention - the momentum candle dims.
⊢
▦ StochRSI - (3, 3, 21, 9) - (%K: 20.46 / %D: 23.93):
∴ The indicator rests near the lower bounds (sub-25) - a territory of emotional exhaustion and tactical reversion;
∴ A cross upward from these levels often ignites short-term rally pulses;
∴ No confirmed crossover yet - but proximity speaks of potential awakening.
✴️ Conclusion: StochRSI breathes in the lowlands, poised to reverse if kinetic force is summoned.
⊢
▦ OBV - (On Balance Volume) - (102.17M):
∴ The OBV remains elevated, suggesting previous bullish runs were volume-supported, not hollow;
∴ However, flatness in recent OBV progression warns that fresh volume is not accompanying the current price hold;
∴ It whispers of consolidation, or worse - divergence.
✴️ Conclusion: OBV confirms the history of strength, but offers no new blood to feed the advance.
⊢
🜎 Strategic Insight - Technical Oracle:
∴ The battlefield holds its shape - the banners of bullish trend still wave, upheld by structural support from EMA's and historical OBV flow. But the wind... it stills.
∴ Volume fades, momentum indicators lose their incline, and oscillators rest on edges. This is a moment of price levitation - elevated without lift. The form remains, but the force hesitates.
∴ The Arcane Pattern whispers:
Should volume return and MACD reignite, $121K may be pierced with clarity;
If silence deepens, however, the bands will contract, and price may descend toward EMA21 or even test EMA50.
∴ The Vortex of Pause has formed. From here, either ignition... or gravity.
⊢
𓂀 Stoic-Structural Interpretation:
▦ Structurally Bullish - Strategically Cautious:
∴ Price remains securely above all major (EMA's 9/21/50) on the daily chart, preserving directional integrity;
∴ Bollinger Bands expanded near upper thresholds, signaling climax zone - yet not rupture;
∴ Momentum indicators (MACD, RSI) maintain bullish structure, but histogram weakness and RSI flattening warn of interior softening;
∴ Stoch RSI in low-band suggests reversal potential, but has yet to trigger.
✴️ Conclusion: Market structure supports continuation, but momentum exhaustion and low volume raise caution flags. Bulls hold the field - but must call the wind.
⊢
▦ Tactical Range Outlook:
∴ Upper Limit: $122,054 - Fibonacci 1.0 and previous cycle top;
∴ Short-Term Support: $118,352 - EMA9 + 0.618 Fib confluence;
∴ Median Guard: $116,729 - EMA21 + 0.382 Fib;
∴ Sacred Support: $112,511 - EMA50 base + structural floor;
∴ Final Bastion: $103,971 - 0.236 Fib retrace (macro turn pivot).
✴️ Conclusion: Bullish path remains sealed while price resides above EMA50 and above $103K. Breach of that zone could awaken deeper volatility structures.
⊢
◩ Codicillus Silentii - Strategic Note:
∴ Price stands at the edge of Fibonacci climax, just below the mythic $122K - a known threshold of reaction;
∴ Volume whispers, not commands - the force of momentum now rests on belief, not confirmation;
∴ The convergence of structure without influx invites caution. This is the realm not of action, but of observation.
✴️ Final Seal: Beware the illusion of calm. A structure may stand in silence, but silence precedes collapse as often as continuation. The Sacred Frame is intact - but shall remain sacred only through vigilance.
⊢
⧉
· Cryptorvm Dominvs · MAGISTER ARCANVM · Vox Primordialis ·
⚜️ ⌬ - Silence precedes the next force. Structure is sacred - ⌬ ⚜️
⧉
⊢

Bitcoin Weekly Seal at the Threshold 122K - No Gaps, No Retreat.⊣
⟁ BTC/USD - BINANCE - (CHART: 1W) - (Jul 27, 2025).
◇ Analysis Price: $119.374,00.
⊣
⨀ I. Temporal Axis - Strategic Interval - (1W):
▦ EMA9 - ($112.771,21):
∴ The weekly close remains above the EMA9, preserving short-term bullish structure;
∴ The EMA9 continues rising at a consistent slope, reflecting sustained upward momentum;
∴ A retracement to this level would represent the first defensive support on a tactical pullback.
✴️ Conclusion: EMA9 acts as a dynamic short-range support and trend continuation marker.
⊢
▦ EMA21 - ($104.883,22):
∴ Price remains notably above the EMA21, confirming structural strength in medium-term trend;
∴ The EMA21 was previously retested during consolidation in Q2 2025;
∴ A weekly close below it would indicate a structural loss of momentum.
✴️ Conclusion: EMA21 confirms medium-term bullish bias as long as preserved.
⊢
▦ WMA50 - ($98.605,81):
∴ WMA50 serves as a major cyclical support and remains untouched since early 2024;
∴ The gap between price and WMA50 indicates strong extension, yet risk of mean reversion rises;
∴ This level aligns with a prior demand zone around ($95K–$100K).
✴️ Conclusion: WMA50 is a latent demand zone - strategic if market reverts from exhaustion.
⊢
▦ WMA100 - ($84.570,72):
∴ This weighted average aligns with the 0.382 Fibonacci level;
∴ A long-term correction toward this band would reflect the depth of macro pullbacks in previous cycles;
∴ Currently distant from price action, but structurally significant if macro volatility increases.
✴️ Conclusion: WMA100 anchors mid-cycle recalibrations and aligns with retracement symmetry.
⊢
▦ WMA200 - ($63.181,79):
∴ The 200-week WMA remains far below price and untouched since early 2023;
∴ This is the ultimate structural support in secular bull cycles;
∴ If revisited, it signals macro-level capitulation or black swan scenario.
✴️ Conclusion: WMA200 holds the foundational line of long-term structural integrity.
⊢
▦ Fibonacci Retracement - (Range from 0 = $27.143,79 to 1 = $122.056,95):
∴ 0.000 = $27.143,79 - Genesis base from Apr 2025 cycle;
∴ 0.236 = $49.543,30 - Psychological line of control in late 2023;
∴ 0.382 = $63.400,62 - Aligned with long-term moving averages;
∴ 0.500 = $74.600,37 - Symmetry pivot of current macro-leg;
∴ 0.618 = $85.800,12 - Golden pocket lower bound;
∴ 0.786 = $101.745,53 - Golden pocket upper edge and structural resistance pre-breakout;
∴ 1.000 = $122.056,95 - Current cycle high (resistance zone);
∴ 1.618 = $180.713,28 - Projected extension target for parabolic continuation.
✴️ Conclusion: Key retracement zones for tactical reactions lie at (0.786 - $101.7K) and (0.618 - $85.8K); upside breakout target confirmed at (1.618 - $180K).
⊢
▦ Volume + EMA21 - (Last: 2.38K BTC):
∴ Volume is stable and slightly rising compared to prior weekly sessions;
∴ No high-volume sell candles indicate panic or exit;
∴ EMA21 on volume shows baseline liquidity remains active.
✴️ Conclusion: Healthy volume confirms orderly continuation rather than climax or exhaustion.
⊢
⨀ II. Momentum & Pressure Indicators:
▦ RSI (21) + EMA9 - (66.71 / 64.34):
∴ RSI approaches the 70-level but remains below overbought territory;
∴ EMA of RSI confirms rising internal strength;
∴ No divergence is observed - internal price energy remains aligned with upward momentum.
✴️ Conclusion: RSI signals strong but not overheated momentum - bulls still in control.
⊢
▦ MACD (9, 21) - (MACD: 7,887.99 | Signal: 6,362.06 | Histogram: +1,525.93):
∴ MACD histogram remains green, showing continuation of bullish trend;
∴ The spread between MACD and Signal is positive and expanding again;
∴ No bearish crossover threat imminent at current slope.
✴️ Conclusion: MACD structure reinforces bullish pressure - trend still intact.
⊢
▦ OBV + EMA9 - (OBV: 220.38M):
∴ OBV remains in an uptrend, supporting price action;
∴ EMA overlay shows no divergence or flattening;
∴ Volume accumulation remains healthy, confirming underlying conviction.
✴️ Conclusion: OBV supports continuation - no signs of distribution.
⊢
▦ Stochastic RSI (3,3,21,9) - (%K: 93.68 / %D: 90.72):
∴ Both %K and %D lines are in the overbought zone (>90);
∴ Crossovers are still bullish but nearing potential exhaustion zone;
∴ Caution warranted for short-term momentum correction.
✴️ Conclusion: Overbought levels reached - watch for tactical slowing, though no reversal confirmed.
⊢
🜎 Strategic Insight - Technical Oracle:
∴ The weekly chart exhibits a structurally intact bull trend, confirmed by the alignment and spacing of EMA's and WMA's across all horizons (short, mid, long);
∴ Fibonacci retracement levels delineate critical reaction zones, with (0.786 - $101.745,53) and (0.618 - $85.800,12) serving as dominant retrace supports in the event of a tactical correction;
∴ The presence of a projected (1.618 extension at $180.713,28) offers a sacred path forward should price breach and sustain above the current high of $122K.
∴ Momentum oscillators (RSI and MACD) continue their upward thrust without divergence, but the Stochastic RSI warns of temporal exhaustion - a typical hallmark before consolidation or rotation;
∴ Volume structure is stable and non-climactic, suggesting continuation rather than blow-off;
∴ No sign of distribution via OBV - accumulation remains intact.
✴️ Conclusion: The market remains within the upper chamber of the Fibonacci spiral. Tactical cooling is possible due to overextension in the momentum field, but no structural damage is observed. A controlled retrace into the golden pocket would be both acceptable and ritualistically symmetrical. The path to $180K remains open, but guarded.
⊣
⟁ BTC/USD - CME Futures BTC1! - (CHART: 1D) - (Jul 27, 2025):
◇ Current Price: $120.785.
◇ Chart Link:
⊣
▦ CME Futures GAP - Observation & Ritual Closure:
∴ The current chart shows a clustered consolidation near $120K–$121K with no immediate upper gap visible;
∴ The last prominent CME Gap was filled during the late June run-up and early July vertical move;
∴ No new gap formed during the weekend-to-weekday open for the last 3 sessions - continuity is intact.
✴️ Conclusion: There is no unfilled CME Gap between the current price and previous sessions. All recent discontinuities appear ritually sealed. Attention now turns to potential downside gaps from rapid bullish impulse moves around ($104K–$108K), which could remain structurally unfilled - unless tactically challenged during correction.
⊢
🜎 Strategic Insight - CME Oracle:
∴ The lack of open CME Gaps suggests a clean technical field - no magnet effect pulling price backward in the short term;
∴ The compression near $121K may precede either an explosive breakout toward the Fibonacci extension ($122K / $130K+), or serve as a false plateau before a tactical flush;
∴ Absence of gaps also removes "gap fill" traders from immediate relevance, allowing price to move freely based on liquidity and macro flows.
✴️ Conclusion: The CME chart confirms no active gravitational pull downward - the battlefield is neutral and favorably clean for bullish continuation, pending macro and liquidity alignment.
⊢
∫ III. On-Chain Intelligence - (Source: CryptoQuant):
▦ Exchange Inflow Total + 9EMA - (All Exchanges):
∴ Exchange inflows remain significantly suppressed, with no spikes above 75K BTC since Q4 2023, despite the price nearing $120K;
∴ The 9EMA of inflows is stable and near local lows, showing no abnormal movement toward exchanges;
∴ Historically, spikes in inflow coincide with distribution, fear, or profit-taking, none of which are currently present on a structural level.
✴️ Conclusion: The on-chain exchange inflow behavior confirms low distribution pressure at current highs. The lack of elevated Bitcoin deposits into exchanges indicates conviction among holders and the absence of a mass selloff attempt, even near critical Fibonacci resistance.
⊢
🜎 Strategic Insight – On-Chain Oracle:
∴ While price consolidates near its cyclical high, exchange inflows remain muted, echoing behavior observed during earlier phases of strong market conviction (e.g., late 2020);
∴ This suggests the market is not preparing for heavy liquidation;
∴ The silence of inflows reinforces the tactical hypothesis that current price action is organic and not panic-driven, preserving the ritual path toward ($122K/$180K).
⊢
⧉ IV. Contextvs Macro-Geopoliticvs - Interflux Economicvs:
▦ US-EU Trade Accord: 1(5% Unified Tariff Across All Sectors):
∴ The United States and the European Union have reached a comprehensive trade agreement, averting escalation: a 15% unified tariff will apply across most EU exports to the US, down from a threatened 30%;
∴ Exceptionally high 50% tariffs remain on steel and aluminum, while some industries such as automotive, semiconductors, and pharmaceuticals will be capped at 15%;
∴ Zero-tariff exemptions have been granted to strategic sectors, including aerospace, select chemicals, semiconductor equipment, agricultural products, and critical raw materials;
∴ In return, the EU has committed to invest $600 billion in US infrastructure and tech, and to purchase $750 billion worth of US energy and defense products over three years.
✴️ Conclusion: The trade pact imposes moderate cost adjustments for key industries but restores transatlantic stability. Although friction remains in sensitive sectors, the agreement prevents global trade disorder and enhances strategic economic visibility.
⊢
🜎 Strategic Insight - Macro Oracle:
∴ The accord mitigates systemic trade risk and clears geopolitical uncertainty, which would otherwise impair market confidence in risk-on assets;
∴ Predictable tariffs (15%/50%) reduce abrupt inflationary shocks, enhancing macroeconomic forecasting and central bank policy latitude;
∴ Massive EU commitments in energy and defense inject transatlantic liquidity and strengthen demand for US dollar-based assets;
∴ While European manufacturers face pressure, the global system benefits from lower volatility and restored economic symmetry;
∴ This opens room for speculative and structural capital to flow more confidently into high-volatility instruments, including crypto assets.
✴️ Conclusion: The macro backdrop reinforces the sacred bullish path - a re-alignment of order in the West, combined with non-disruptive trade stabilization, lays the groundwork for continuation of liquidity-driven risk flows. Bitcoin stands to benefit as a speculative vessel in a structurally stable yet monetarily dynamic environment.
⊢
𓂀 Stoic-Structural Interpretation:
▦ Structurally Bullish - Tactically Watchful:
∴ Price remains above all critical EMA's and WMA's on the 1W chart;
∴ Fibonacci structure is intact, with the $122K high acting as ritual resistance and the (0.786 / 0.618 zone ($101K / $85K) as sacred fallback;
∴ Momentum indicators (MACD, RSI) sustain positive bias with no divergences;
∴ CME Futures show no unfilled gaps - the field is clean, allowing strategic extension.
✴️ Conclusion: The macrostructure supports continuation higher into the sacred extension zone ($130K–$180K), with short-term vigilance warranted due to overbought Stoch RSI and reduced volume velocity.
⊢
▦ Tactical Range Caution:
∴ Upper Limit: $122.056 - Cycle high and Fibonacci 1.0;
∴ Mid Guard: $112.770 - EMA9;
∴ Structural Support: ($101,745 - 0.786) Fib retrace;
∴ Golden Anchor: ($85.800 - 0.618) Fib retrace.
✴️ Conclusion: As long as price remains above $101K, the bullish code remains sealed. Breach of $85K would unlock deeper structural reassessment.
⊢
◩ Codicillus Silentii - Strategic Note:
∴ The week closes at the threshold of the Fibonacci (1.0 mark - $122.056), beneath a ceiling forged by time and belief;
∴ All technical layers are aligned, yet the silence in the inflow, the clean CME field, and macro equilibrium whisper a rarer truth - no storm is seen, but no wind is promised;
∴ This is the zone of the Watcher - where action becomes hesitation, and hesitation becomes discipline.
✴️ Strategic Note & Final Seal: Do not confuse absence of danger with presence of opportunity. A vertical structure with no threat below can still falter from within. This is a time not to act, but to remain unshaken.
⊢
⧉
· Cryptorvm Dominvs · MAGISTER ARCANVM · Vox Primordialis ·
⚜️ ⌬ - Silence precedes the next force. Structure is sacred - ⌬ ⚜️
⧉
⊢

Bitcoin - Strategic Coil Within the Arcane Band.⊢
⟁ BTC/USD - BINANCE - (CHART: 4H) - (July 27, 2025).
◇ Analysis Price: $118.309,59.
⊣
⨀ I. Temporal Axis - Strategic Interval - (4H):
▦ TEMA9 - ($118.338,48):
∴ Price is currently below TEMA9, indicating near-term resistance;
∴ Curve is upward-sloping but flattening, suggesting fading acceleration;
∴ Acts as reactive signal line; minor rejection occurred on contact.
✴️ Conclusion: Momentum fading as price struggles to hold above dynamic resistance.
⊢
▦ HMA21 - ($118.324,83):
∴ Smooth curvature maintaining upward bias;
∴ Close proximity to TEMA9 shows compressed volatility regime;
∴ Price interacting with HMA without definitive breakout.
✴️ Conclusion: Tactical direction remains constructive, but confirmation is lacking.
⊢
▦ EMA50 - ($117.794,89):
∴ Strong medium-term support; price remains above it with clear respect;
∴ Acts as lower bound of the current compression channel;
∴ No bearish cross detected with TEMA or HMA.
✴️ Conclusion: Mid-term bullish support structure intact.
⊢
▦ EMA200 - ($113.979,81):
∴ Structure well below active price; rising and stable;
∴ Indicates long-term bullish posture is unbroken;
∴ No signs of major breakdown or transition to bear structure.
✴️ Conclusion: Structural uptrend remains unthreatened.
⊢
▦ SuperTrend Arcanvm - (ATR 10, 1.5 - $117.640,25):
∴ Price trades above the SuperTrend line, indicating continuation zone;
∴ Support zone lifted slightly, confirming minor trend maintenance;
∴ No signal reversal or close below since last shift.
✴️ Conclusion: Tactical upward bias protected by volatility-based support.
⊢
⨀ II. Momentum & Pressure Indicators:
▦ Stochastic RSI (3,3,21,9) - (%K: 88.23 / %D: 88.27):
∴ Deep into overbought zone; potential reversal region;
∴ Minor negative crossover forming (%K < %D);
∴ Pattern shows repeated false breaks from high zone.
✴️ Conclusion: Overextended with local fatigue building.
⊢
▦ MACD (9,21,9)- (Line: 164.40 / Signal: 106.94 / Histogram: +57.47):
∴ Bullish crossover confirmed and holding; histogram positive;
∴ Increasing MACD separation suggests underlying momentum;
∴ No divergence yet; consistent short-term upside energy.
✴️ Conclusion: Momentum favors bulls but remains immature.
⊢
▦ MFI (14) - (68.20):
∴ Trending toward overbought zone without breach;
∴ Steady increase reflects sustained volume-backed inflows;
∴ Not yet extreme; still has energy potential to fuel move.
✴️ Conclusion: Volume pressure supports bullish case with room left.
⊢
▦ Accumulation/Distribution + HMA21 - (74.89M):
∴ Line remains stable above short-term base; no outflow signals;
∴ Slight incline observed, confirming ongoing accumulation;
∴ No divergence with price; consistent flow.
✴️ Conclusion: Capital positioning remains supportive of continuation.
⊢
🜎 Strategic Insight - Technical Oracle:
∴ The current 4H structure on BTC/USD exhibits a compressed upward bias where dynamic resistance (TEMA + HMA) is being tested persistently but without explosive breakout;
∴ Momentum indicators (MACD, MFI) confirm early-stage bullish pressure, while structural supports (EMA50, SuperTrend) remain intact and responsive;
∴ However, Stoch RSI is saturated, suggesting that any continuation would likely require a cooling cycle or shallow retracement before sustainable thrust;
∴ This configuration aligns with a “Pre-Break Range Staging” - a technical limbo where buyers are present but cautious, and sellers are absorbed without significant follow-through.
✴️ Strategic Focus: Watch for confirmation above ($118.600) with volume expansion and MACD histogram follow-through, or a soft retest toward ($117.640/117.800) as reloading zone.
∴ Logic sealed. Tactical silence until resolution.
⊢
𓂀 Stoic-Structural Interpretation:
▦ Structurally Bullish - (Tactically Fragile Continuation):
∴ The long-term structure (EMA 200 rising, unbroken) confirms a preserved bullish frame;
∴ Mid-term support (EMA 50 + SuperTrend) is active and functioning as a technical base;
∴ However, price struggles to sustain above dynamic resistance (TEMA/HMA), and Stoch RSI signals short-term exhaustion.
✴️ Conclusion: The structure is upward, but the current tactical zone is sensitive. Any bullish continuation demands confirmation and discipline - no chasing.
⊢
▦ Tactical Range Caution:
∴ Support Zone - (Defensive): $117,640 / $117,800;
∴ Resistance Ceiling - (Breakout Trigger): $118,600;
∴ Tactical Neutral Band: $118,000 / $118,300.
✴️ Conclusion: No trade zone expands if compression persists. Breakout or breakdown must be decisive and accompanied by volume/momentum synchrony.
⊢
◩ Codicillus Silentii - Strategic Note:
∴ In moments of compressed structure near resistance, the market does not reveal itself through price - but through how it refuses to move. Silence becomes signal;
∴ What is observed here is not a lack of momentum - but deliberate withholding of directional intent;
∴ The system is balanced between emergent buy pressure (MACD, MFI, Accum/Dist) and short-term saturation (Stoch RSI), forming a strategic standoff:
No major actors are retreating, but none are charging forward either.
The candle bodies shrink while oscillators extend - a classic sign of non-confirmed bullish bias.
Emotional traders will chase; initiated ones will wait for the candle that breaks the silence, not the one that whispers hope.
✴️ Final Seal: The stoic operator does not react to pressure - he reacts to structure.
Tactical inaction is a move; Watching is positioning; Discipline is participation.
⊢
⧉
· Cryptorvm Dominvs · MAGISTER ARCANVM · Vox Primordialis ·
⚜️ ⌬ - Silence precedes the next force. Structure is sacred - ⌬ ⚜️
⧉
⊢

Bitcoin Beneath the Arc of Silence - Structural Faith, Tactical?⊢
⟁ BTC/USD - BINANCE - (CHART: 1D) - (July 26, 2025).
◇ Analysis Price: $117,421.02.
⊣
⨀ I. Temporal Axis - Strategic Interval - (1D):
▦ EMA9 - ($117,842.79):
∴ The EMA9)is currently positioned at $117,842.79, slightly above the price ($117,421.02), acting as immediate dynamic resistance;
∴ Price has closed below EMA9 for multiple sessions, indicating a fading short-term momentum arc;
∴ The slope of the EMA9 is flattening, signaling an inflection zone rather than active thrust.
✴️ Conclusion: The short-term control line has been lost tactically; a sign of momentum exhaustion but not structural breakdown.
⊢
▦ EMA21 - ($116,001.77):
∴ EMA21 stands at $116,001.77, serving as an intermediate-range support below current price;
∴ The slope remains positive, providing a second-layer bullish structure after the loss of EMA9;
∴ Price has not tested EMA21 since early July - proximity implies possible gravitational pull.
✴️ Conclusion: EMA21 is the next defense line in a suspended structure, acting as the center of tactical compression.
⊢
▦ EMA50 - ($111,691.19):
∴ EMA50 sits at $111,691.19, aligned closely with the (0.236 Fibonacci) and historical cluster zone;
∴ Price has remained well above this level for over 30 sessions;
∴ The slope is clearly positive, marking macro structural support.
✴️ Conclusion: EMA50 represents the last reliable arc before macro invalidation. Its integrity maintains the long-term bullish thesis.
⊢
▦ Fibonacci Retracement:
∴ Retracement is correctly anchored: 1.0 = $122,054.86 (ATH) / 0.0 = $98,385.45 - (June 22 low);
∴ Price currently oscillates within the 0.618–0.5 zone ($113k–$110k), the classical golden pocket;
∴ The golden pocket aligns closely with EMA21 and the Bollinger mean, forming a triple confluence zone.
✴️ Conclusion: Price is inside the Fibonacci heart of reaccumulation - ideal for breakout setups or breakdown invalidation.
⊢
▦ Bollinger Bands (21, 2.0):
∴ The upper band is at $123,377.19, while the middle band rests at $116,314.72;
∴ Price is between the middle and upper bands, consolidating after rejection from the upper line;
∴ The bands are narrowing, indicating a volatility contraction cycle.
✴️ Conclusion: Bollinger geometry confirms volatility suppression, aligning with RSI and MACD flattening - a signal of impending release.
⊢
▦ RSI (21) + EMA9:
∴ RSI is at (59.99), slightly under its EMA9 - (62.59), showing momentum erosion without collapse;
∴ The RSI has declined from the high 70s in late June, signaling tactical cooling;
∴ Remaining above 50 preserves structural bullish bias.
✴️ Conclusion: RSI is in tactical descent, but not structurally bearish - neutral-to-bullish compression.
⊢
▦ MACD (9,21):
∴ MACD line is below signal line, currently at (1,841.01) vs (2,419.86), confirming a bearish cross;
∴ Histogram prints red for several sessions, with fading amplitude;
∴ Despite the crossover, MACD remains in positive territory, indicating soft correction, not trend reversal.
✴️ Conclusion: MACD confirms a tactical retracement, aligned with RSI weakness, yet within bullish context.
⊢
▦ Stochastic RSI (3, 3, 21, 9):
∴ Current value is 0.00, denoting extreme oversold conditions;
∴ Multiple sessions have closed at this level without relief;
∴ Historically, flatlines at 0.00 often precede upward jolts.
✴️ Conclusion: Stoch RSI indicates exhaustion of momentum - potential for rebound or failed bounce.
⊢
▦ Volume + EMA21:
∴ Volume on current sessions is below the 21-period EMA, confirming absence of strong sell-side dominance;
∴ No abnormal spikes or climaxes are visible - neither panic nor breakout yet;
∴ Volume profile aligns with Bollinger contraction.
✴️ Conclusion: Quiet volume supports the thesis of controlled tactical consolidation, not distribution.
⊢
▦ OBV + EMA9:
∴ OBV stands at 102.17M, flatlined with EMA9;
∴ No divergence detected relative to price;
∴ Momentum of accumulation remains static but not deteriorating.
✴️ Conclusion: OBV is in neutral stance, neither confirming breakout nor selloff - favors tactical patience.
⊢
🜎 Strategic Insight - Technical Oracle:
∴ Bitcoin is suspended in a compressed volatility range beneath its local high, resting upon layered support zones defined by EMA21, Bollinger median, and the Fibonacci golden pocket (0.618–0.5);
∴ Momentum indicators (RSI, MACD, Stoch RSI) are all in tactical decline, yet no structure has been broken - price still floats above all macro EMA's (21, 50) with OBV unshaken;
∴ The short-term weakness is absorbed within a higher-order structural integrity, suggesting latent potential awaiting a fundamental catalyst.
✴️ Conclusion: The oracle observes a coiled market, technically restrained but not structurally broken - an archetype of Strategic Suspension Beneath the Arc of Silence.
⊢
∫ II. On-Chain Intelligence - (Source: CryptoQuant):
▦ Exchange Netflow Total + 9EMA - (All Exchanges):
∴ The current netflow is (-864.6 BTC), remaining firmly below its EMA9 baseline;
∴ The 9-day moving average of netflows is flat-to-negative, signaling persistent withdrawal pressure from exchanges;
∴ Sustained negative netflows in conjunction with a stable price floor indicate non-speculative cold storage behavior.
✴️ Conclusion: Netflow structure is bearish for exchanges, but bullish for long-term price, as BTC flows into private custody.
⊢
▦ Miner to Exchange Flow + 9EMA - (All Miners):
∴ Current flow from miners hovers near 1.2K BTC/day, well below the EMA9 which trends above 3K;
∴ The flow has not pierced its EMA9 in recent weeks, despite BTC testing local highs - a strong non-distribution signal;
∴ The divergence between low miner outflows and high price resilience confirms supply-side discipline.
✴️ Conclusion: Miner flows remain suppressed beneath EMA9 - a structurally bullish posture amid local consolidation.
⊢
▦ Funding Rate + 9EMA - (All Exchanges):
∴ The funding rate is (+0.012), sitting above its EMA9, indicating a minor long bias across derivatives markets;
∴ There is no spike or deviation suggesting leveraged imbalance - the slope of the EMA9 remains shallow;
∴ Funding above EMA9, with RSI and MACD fading, implies a passively bullish positioning without euphoria.
✴️ Conclusion: Funding is technically constructive, aligned with healthy sentiment - not overheated, nor bearish.
⊢
▦ Spent Output Profit Ratio - (SOPR) + 9EMA - (Adjusted):
∴ The SOPR stands at 1.016, maintaining a position above its 9-day EMA;
∴ No dip below 1.0 has occurred in recent sessions, showing that BTC is being transacted in profit;
∴ EMA(9) acts as a median around 1.0 - a psychological pivot between profit realization and capitulation.
✴️ Conclusion: SOPR above EMA9 confirms a healthy trend, with profits being realized in harmony - not desperation.
⊢
🜎 Strategic Insight - On-Chain Oracle:
∴ All four on-chain pillars - Exchange Netflow, Miner Flow, Funding, SOPR - operate in favor of structural continuation, with none indicating exhaustion or distribution;
∴ The alignment of each indicator above or below EMA9 in the appropriate direction (accumulation vs euphoria) forms a cohesive bullish framework;
∴ The lack of pressure from miners, and the smooth funding environment, give room for technical consolidation to mature without triggering panic.
✴️ Conclusion: The oracle discerns a hidden current of strength, buried beneath the tactical mist. Structural forces remain aligned with continuation - though the flame is dimmed, it is not extinguished.
⊢
⧉ III. Contextvs Macro-Geopoliticvs - (July 25, 2025):
▦ 10:00 AM - Core Capital Goods Orders - (Durable Goods excl. Defense & Aircraft):
∴ The index, a proxy for business investment, contracted by (-0.7%) in June - the sharpest monthly decline of the year;
∴ This marks a decisive loss of momentum in private-sector expansion;
∴ While shipments rose slightly (+0.4%), the delta is attributed to inflation, not demand.
✴️ Conclusion: The business sector shows signs of hesitation, reinforcing the case for policy accommodation.
⊢
▦ 14:30 PM - Trump's Visit to the Federal Reserve - (Rare Executive Intervention):
∴ President Trump visited Powell directly, urging him to cut interest rates to "save the American engine";
∴ Powell responded with a carefully chosen phrase: “The country is doing really well” - read by markets as passive affirmation;
∴ This act marks a rare intrusion into Fed independence, adding political volatility to monetary policy expectations.
✴️ Conclusion: The Fed is now politically cornered, caught between inflation resilience and political coercion.
⊢
▦ 16:00 PM - Market Response & Euphoria Spike:
∴ U.S. indices - S&P 500, Nasdaq, Dow Jones - all reached all-time highs on the back of Powell's phrase and Trump’s pressure;
∴ Approximately 80% of S&P companies beat earnings expectations, providing fuel to the narrative;
∴ Market interpreted silence as assent, reactivating the “Fed put” theory.
✴️ Conclusion: Markets responded as if Powell had already signaled rate cuts, despite no formal commitment.
⊢
▦ 18:00 PM - Rate Cut Probability Assessment - (CME/FedWatch):
∴ Probability of a rate cut in September rose to (61.8%), precisely echoing the Fibonacci retracement now governing Bitcoin price;
∴ This alignment signals macro-on-chain-temporal resonance;
∴ Powell reiterates data dependency - no promises, but full optionality.
✴️ Conclusion: The macro veil is thin - policy pivot is anticipated, but not yet manifest. Tactical patience is vital.
⊢
🜎 Strategic Insight - Macro Oracle:
∴ Economic data weakens subtly;
∴ Political pressure intensifies;
∴ Market euphoria resurfaces on whispers, not substance.
∴ The silence of Powell is being interpreted, not spoken - a dangerous act of collective projection.
✴️ Conclusion: The Fed speaks in veils - and markets trade in illusions. The macro climate is now psychologically unstable, but not yet structurally broken.
⊢
𓂀 Stoic-Structural Interpretation:
▦ Structurally Bullish - Tactically Suspended:
∴ Price action remains well supported above all macro EMA's (21, 50), the OBV is intact, and no distribution signals are present;
∴ Momentum indicators (RSI, MACD, Stoch RSI) confirm a tactical cooldown, not collapse;
∴ On-chain fundamentals (Netflows, Miner Behavior, SOPR, Funding) remain constructively aligned.
✴️ Conclusion: Structurally, the market preserves a bullish foundation, while tactically locked in volatility suppression and directional indecision.
⊢
▦ Tactical Range Caution:
∴ Resistance: $123,377.19 (Upper BB), then $126,000 (local expansion);
∴ Pivot: $117,800 (EMA9) / $116,000 (EMA21);
∴ Support: $113,013.15 (Fibonacci 0.618), $111,691.19 (EMA50), then $107,400 (macro reversal threshold).
✴️ Conclusion: Tactical range is compressed within a ($116K-$123K) gate. Below $111K triggers macro risk.
⊢
◩ Codicillus Silentii - Strategic Note:
∴ In the breath between policy and projection, the markets chant futures yet unspoken.
BTC rests not in fear, nor in hope - but in silence.
✴️ Final Seal: The arc is intact. The veil has not fallen. Patience is power.
⊢
⧉
· Cryptorvm Dominvs · MAGISTER ARCANVM · Vox Primordialis ·
⚜️ ⌬ - Silence precedes the next force. Structure is sacred - ⌬ ⚜️
⧉
⊢

Bitcoin Awaits the Federal Voice - The Threshold of Compression.⊢
⟁ BTC/USD - BINANCE - (CHART: 1H) - (July 24, 2025).
◇ Analysis Price: $117.830,17.
⊣
⨀ I. Temporal Axis - Strategic Interval - (1H):
▦ EMA9 - ($118.267,48):
∴ The 9-period Exponential Moving Average (EMA9) was serving as immediate microstructural support until July 23rd, when a full-bodied bearish candle broke through it with volume below average but directionally firm;
∴ Post-break, EMA9 began to flatten, then bend downward, reflecting a tactical loss of bullish momentum within the intraday range structure;
∴ Price has attempted multiple recoveries toward EMA9 but has been consistently rejected at or below it, confirming its transition into resistance status.
✴️ Conclusion: EMA9 has transitioned from a dynamic support to tactical resistance, indicating a short-term trend deterioration and weakening of upward initiative.
⊢
▦ EMA21 - ($118.396,85):
∴ The 21-period EMA functions as the median layer of microstructure and has held relatively flat for several days, suggesting a compressed momentum environment;
∴ As of the latest price action, the EMA9 has definitively crossed below EMA21 - a classic tactical signal of microtrend exhaustion, especially when paired with lateral volume and a suppressed RSI;
∴ EMA21 remains unbroken since July 21st, reinforcing its role as an anchor level for short-term rejections and as a ceiling against breakout attempts.
✴️ Conclusion: EMA21 maintains structural weight as resistance, and the confirmed cross-under by EMA9 introduces a tactical shift into intraday bearish flow.
⊢
▦ EMA50 - ($118.434,93):
∴ The 50-period EMA, long considered the “defensive perimeter” of bullish short-term structure, had been flattening with slight upward bias since July 19th;
∴ However, in the last two sessions, it has shown the first measurable downward curvature, marking the decay of medium-term intraday bullish control;
∴ Price remains significantly below the EMA50, and multiple upside attempts have failed before even reaching it, reflecting market hesitation and lack of participation.
✴️ Conclusion: EMA50 has begun its first bearish slope since July 16th, indicating an eroded tactical bias and confirming loss of momentum from the bulls' side.
⊢
▦ Bollinger Bands (21, 2) - (Upper: $119.254,34 / Lower: $117.398,28):
∴ The Bollinger Bands have narrowed continuously over the last three sessions, forming a visible compression channel - a prelude to volatility expansion;
∴ Price rejected cleanly from the upper band on July 23rd and traveled to the lower band without support, closing two candles consecutively near the lower range;
∴ The Bollinger Median is aligned with the EMA21, reinforcing its status as the core compression axis and tactical gravity point.
✴️ Conclusion: Bollinger structure suggests imminent breakout scenario; current price behavior signals bearish volatility bias unless structure is broken with strong volume.
⊢
▦ Volume + EMA 21 - (Current: 13 BTC):
∴ Volume has declined steadily throughout the last five trading sessions, as seen in the downward-sloping EMA21 overlaid on the volume histogram;
∴ Recent bearish moves occurred on lower volume compared to previous weeks, indicating low conviction and possible manipulation-prone liquidity zones;
∴ There is no expansion in volume accompanying the most recent directional candles, confirming this as a phase of tactical disinterest rather than distribution.
✴️ Conclusion: Market participants are not committing capital - the tape is flat, silent, and manipulable, increasing the risk of abrupt fakeouts or shadow breakouts.
⊢
▦ RSI (21) + EMA 9 - (Current RSI: 45.55):
∴ The Relative Strength Index has remained below the 50-neutral mark for three sessions, with a confirmed downward slope and rejection from its 9-period EMA overlay;
∴ There is no sign of divergence, bullish or bearish, suggesting that price action is neither exhausted nor ready to reverse;
∴ RSI’s current position confirms momentum is negative but controlled - an environment of inertia rather than acceleration.
✴️ Conclusion: RSI confirms tactical weakness - directional force is absent, and momentum favors sellers in a low-intensity regime.
⊢
▦ Stochastic RSI (3, 3, 21, 9) - (Current: 4.32):
∴ The Stoch RSI has fallen into extreme oversold territory after failing to sustain a double-top formation near the 80-level earlier this week;
∴ The plunge occurred with speed and depth, signaling loss of buying initiative - often a precursor to passive rebounds without follow-through;
∴ Current readings near zero indicate the potential for technical retracement, but no reversal confirmation is present without RSI and MACD alignment.
✴️ Conclusion: The oscillator signals oversold status, but the context suggests any bounce would be corrective, not impulsive - a trap for premature long entries.
⊢
▦ MACD (9, 21) - (MACD: -95.69 / Signal: -129.37):
∴ MACD histogram shows initial contraction of bearish momentum, but remains submerged below the zero-line and far from a clean crossover;
∴ MACD line is attempting to turn up, but the signal line remains significantly below it, indicating lack of consensus between short and medium-term momentum;
∴ Previous fake signals from MACD in this range suggest caution divergence is visible, but -structure is weak.
✴️ Conclusion: MACD shows early signs of momentum divergence, but without structure or volume, the setup remains fragile and unconfirmed.
⊢
▦ OBV + EMA9 - (OBV: 26.69K):
∴ On-Balance Volume has entered a horizontal band with no structural incline or decline for three consecutive days;
∴ OBV's 9-period EMA is now perfectly flat, reflecting market indecision and a symmetrical distribution of volume over time;
∴ No bullish or bearish divergence is visible, indicating that volume flow is passive and non-directional.
✴️ Conclusion: OBV confirms tactical silence in the order book - structure lacks engagement, and accumulation or distribution is absent.
⊢
🜎 Strategic Insight - Technical Oracle:
∴ All indicators on the H1 chart converge toward a single message: tactical drift within a structurally neutral, low-volume regime;
∴ The EMA's are aligned downward, RSI is slipping without exhaustion, MACD offers unconfirmed divergence, and Stoch RSI is oversold without structure;
∴ This constellation presents a dangerous battlefield - one where silence reigns louder than signal;
∴ Breakouts are possible, but not probable without macro ignition.
⊢
∫ II. On-Chain Intelligence - (Source: CryptoQuant):
▦ Exchange Reserves + 9EMA - (All Exchanges):
∴ Bitcoin reserves on centralized exchanges have decreased from (~2.46M) to 2.41M Bitcoin over the past 30 days, but the decline halted on July 21st and entered a horizontal range;
∴ This plateau indicates a pause in the long-term outflow trend, suggesting that neither accumulation nor distribution is dominating;
∴ Exchange reserves are a key liquidity gauge, and flatlining implies equilibrium between withdrawal behavior and deposit pressure.
✴️ Conclusion: No liquidity threat from centralized exchange reserves - a neutral signal in an inert market.
⊢
▦ Funding Rate + 9EMA - (All Exchanges):
∴ The funding rate remains mildly positive across perpetual contracts, indicating a slight long bias - (+0.008);
∴ However, the rate is far from extremes that would signify either overleveraging or liquidation risk;
∴ Historical context shows that a funding rate near zero during price stagnation often precedes volatility expansion.
✴️ Conclusion: Cautious optimism present among derivatives traders, but not enough to drive trend - latent energy, directionless.
⊢
▦ Stablecoin Ratio + 9EMA - (All Exchanges):
∴ The ratio of stablecoins to Bitcoin on exchanges remains at all-time lows, signaling an environment with reduced buying power;
∴ This lack of fresh capital severely limits the capacity for breakout rallies, especially when combined with poor volume and flat OBV;
∴ No stablecoin inflows = no fuel for upward movement.
✴️ Conclusion: The market is liquidity-starved - stablecoin ratio confirms lack of bullish firepower.
⊢
▦ Realized Cap + 9EMA:
∴ Realized Cap has surpassed the $1 trillion mark for the first time, suggesting robust conviction among holders and long-term participants;
∴ This metric rises only when coins move at a profit, indicating that active participants are not capitulating but rather holding or consolidating;
∴ The Realized Cap trajectory diverges from flat spot price - an arcane sign of underlying strength.
✴️ Conclusion: Structural confidence remains intact at the macro level - price inertia belies silent conviction.
⊢
🜎 Strategic Insight - On-Chain Oracle:
∴ On-chain metrics whisper stability;
∴ No excessive optimism, no panic, just a dry and frozen battlefield;
∴ Exchange reserves are flat, stablecoin ratio is weak, but Realized Cap shows unwavering belief; ∴ If the market breaks, it will be macro-induced - not on-chain triggered.
⊢
✴️ Codicillus Silentii - Strategic Note:
∴ The gatekeepers are at the threshold:
Jerome Powell’s speech: July 25;
U.S. GDP Q2 (Preliminary): July 26.
∴ Both are macro-keystones that will either ignite movement or deepen compression. The tape is silent because the world awaits signal.
⊢
𓂀 Stoic-Structural Interpretation:
▦ Structurally Neutral - Tactically Bearish Drift.
∴ EMA's aligned downward, RSI below midline, OBV stagnant - no strength, no collapse;
∴ Bearish drift, but no conviction.
▦ Tactical Range Caution:
∴ Support: $117.400 - (lower Bollinger limit);
∴ Resistance: $118.900 - (EMA cluster + BB midline).
✴️ Final Seal: Bitcoin rests under the veil of compression. Eyes turn to Powell. Silence prepares the break.
⊢
✴️ Final Codex Interpretation:
∴ The chart speaks not in fire nor fury - but in breathless tension:
Each line, curved and silent, awaits the tremor of a greater voice;
The market is not weak - it is listening. And what it hears may not be price, but power.
∴ The candles drift beneath their own gravity:
The EMA's now form a declining constellation, dimming the tactical skies;
No reversal, no collapse - only weightless time.
∴ Volume is not a storm. It is absence:
And absence in markets is not peace - it is preparation.
∴ On-chain, conviction stands with sealed lips:
Reserves unmoved, stablecoins withdrawn, but Realized Cap ascends - as if the soul of Bitcoin advances, while the flesh waits behind.
∴ And above all - the macro sphere:
Two seals remain locked: Powell’s speech and GDP;
One whispers interest rates. The other shouts reality.
⊢
✶ This is not a trend. It is a pause in fate;
✶ This is not weakness. It is breath before the chant.
⊢
✴️ Conclusion Codex Interpretation:
∴ Bitcoin is in deliberate suspension - structurally stoic, tactically inert;
∴ A sovereign asset waiting not for buyers, but for context;
∴ The gate opens July 25th. Until then: silence reigns.
⊢
⧉
· Cryptorvm Dominvs · MAGISTER ARCANVM · Vox Primordialis ·
⚜️ ⌬ - Silence precedes the next force. Structure is sacred - ⌬ ⚜️
⧉
⊢

Bitcoin at the Threshold of the Fibonacci Gate - Silent Strain.⊢
⟁ BTC/USD - BINANCE - (CHART: 1W) - (July 22, 2025).
◇ Analysis Price: $119.209,03.
⊣
⨀ I. Temporal Axis - Strategic Interval - (1W):
▦ EMA9 - ($111.083,72):
∴ Price remains well above the EMA9, with consistent bullish spacing;
∴ The weekly candle closes with strength and full-body integrity above it;
∴ EMA9 slope continues upward, supporting ongoing momentum.
✴️ Conclusion: Short-term structure remains decisively bullish, with trend-following support intact.
⊣
▦ EMA21 - ($103.417,42):
∴ EMA21 is sharply rising and holds significant historical support;
∴ Price remains distanced, but no vertical stretch detected;
∴ Not touched since early 2024 - the bullish cycle is intact.
✴️ Conclusion: Mid-cycle momentum remains strong. No structural weakness under current trajectory.
⊣
▦ WMA200 - ($62.496,26):
∴ Remains deep below current price action - untouched since breakout phase in 2023;
∴ Its angle is now slowly tilting upward - reflecting macro regime change;
∴ Long-term holders remain in command; no gravitational pull is active.
✴️ Conclusion: WMA200 is no longer relevant for tactical reaction, but serves as a structural floor of the cycle.
⊣
▦ Fibonacci Retracement - (Top: $122.056,95 / Bottom: $27.143,79):
✴️ Top: $122.056,95 - (07/14/2025) = 1 Fibo;
✴️ Bottom: $27.143,79 - (10/16/2023) = 0 Fibo.
∴ Price is now within 2.33% of the Fibonacci 1.0 extremity;
∴ Entire move from $27k to $122k retraced cleanly with structural respect to 0.382 ($63.400;62) and 0.618 ($85.800,12);
∴ Current pressure nears full extension, requiring caution;
✴️ Conclusion: Full retracement achieved. Continuation must now be fueled by external influx or will face rejection at golden gate.
⊣
▦ RSI (21) + EMA9 - (RSI: 66.65 / EMA9: 63.73):
∴ RSI remains below 70 - showing momentum without exuberance;
∴ RSI crossed above EMA9 with positive slope;
∴ No divergence present; momentum confirmation continues.
✴️ Conclusion: Silent bullish continuity. No signal of exhaustion.
🜏 ORACVLO ARCANE: (RSI = 66 - No Fibonacci/Guematria convergence).
⊣
▦ MACD (9,21) - (MACD: 7,666.30 / Signal: 5,976.56 / Histogram: +1,689.74):
∴ MACD lines widening - strong expansion phase;
∴ Histogram rising above prior week;
∴ Still in mid-cycle range - not overextended.
✴️ Conclusion: Momentum engine active. No current loss of acceleration.
🜏 ORACVLO ARCANE: (Histogram = 1,689.74 - No convergence).
⊣
▦ OBV + EMA9 - (OBV: 86.27K):
∴ OBV rising cleanly with price;
∴ No divergence detected on weekly timeframe;
∴ EMA9 supportive, confirming accumulation bias.
✴️ Conclusion: Volume structure confirms legitimacy of bullish move.
⊣
▦ Stochastic RSI - (3,3,21,9) - (K: 94.30 / D: 84.53):
∴ Both lines in extreme overbought zone;
∴ No bearish cross yet - but a turn may initiate in next 1-2 candles;
∴ Historical turning points often occur from this elevation.
✴️ Conclusion: Momentum peaking. Vigilance required for reversal trigger in next cycle.
⊣
🜎 Strategic Insight – Technical Oracle:
∴ Price is pressing against the final Fibonacci gate of $122K, with momentum indicators still aligned;
∴ However, overbought pressure is building, particularly on the Stoch RSI.
∴ Breakout will require force; otherwise, a pullback from the threshold is probable.
⊣
∫ II. On-Chain Intelligence – (Source: CryptoQuant):
▦ Exchange Netflow Total - (All Exchanges) - (+920 BTC):
∴ Influx into exchanges suggests potential distribution is being prepared.
⊣
▦ Funding Rates - (All Exchanges) - (+0.008):
∴ Mildly positive; no leverage overheating detected.
⊣
▦ Taker Buy Sell Ratio - (All Exchanges) - (0.959):
∴ Slight taker sell dominance - friction at high prices.
⊣
▦ Spent Output Profit Ratio - (SOPR) - (1.017):
∴ Profitable exits ongoing. Healthy, but could tilt if profit-taking accelerates.
⊣
▦ Realized Cap + (EMA9) - (Rising):
∴ Network is revaluing BTC upward - structurally healthy.
⊣
▦ MVRV Z-Score + (EMA9) - (2.32):
∴ Elevated. Historically a zone where caution is warranted.
⊣
▦ Miner Reserve - (All Miners) - (1.809M BTC declining):
∴ Long-term miner outflows continue - no sudden spike detected.
⊣
🜎 Strategic Insight - On-Chain Oracle:
∴ On-chain data supports the current trend, but with visible friction. Exchange inflow and profit-taking are warning signs that price is now dependent on sustained demand;
∴ This is a zone of silent strain: structurally sound, but tactically stretched. While the broader framework supports continuation, there is no buffer left for error;
∴ Weakness will be exploited if new inflows fail to materialize.
⊣
𓂀 Stoic-Structural Interpretation:
∴ Structurally Bullish - Tactically Suspended;
∴ Tactical Range Caution: ($114.000 / $122.056).
⊣
▦ Codicillus Silentii - Strategic Note:
∴ The CME gap and the proximity to Fibonacci 1.0 have formed a psychological and technical ceiling;
∴ If unbroken this week, the next cycle may revert to (0.786) as reversion.
⊣
▦ Momentum-wise:
∴ RSI remains in the bullish zone (66.65) without entering overbought - a sign of discipline in the ascent;
∴ MACD shows expansion with a growing histogram - no curvature loss;
∴ Stochastic RSI is in extreme overbought (K = 94.30), signaling elevated tension.
✴️ Conclusion: Momentum is intact but strained. A breakout is possible, but failure to continue will invite a flush.
⊢
✴️ Final Codex Interpretation:
∴ Bitcoin stands at the edge of the Fibonacci Gate, within breath of the 1.0 threshold ($122,056); ∴ While structure, momentum, and on-chain flows permit a push higher, the presence of inflows to exchanges, elevated MVRV, and extreme oscillator positioning suggest that the threshold is sacred - and only silence or strength may break it;
∴ Rejection here would not be collapse, but strategic regression to gather force beneath the gate.
⊢
⧉
· Cryptorvm Dominvs · MAGISTER ARCANVM · Vox Primordialis ·
⚜️ ⌬ - Silence precedes the next force. Structure is sacred - ⌬ ⚜️
⧉
⊢

Bitcoin Suspended Beneath the Ichimoku Silence.⊢
⨀ BTC/USD - BINANCE - (CHART: 4H) - (July 20, 2025).
◇ Analysis Price: $117,919.29.
⊣
⨀ I. Temporal Axis - Strategic Interval - (4H):
▦ EMA9 - (Exponential Moving Average - 9 Close):
∴ Price is currently hovering just below the EMA9 at $118,035.43, showing weakening immediate momentum;
∴ EMA9 is now flat-to-downsloping, indicating short-term loss of control from intraday bulls;
∴ Recent candles have failed to reclaim closes above EMA9, reflecting micro-resistance and tactical fragility.
✴️ Conclusion: Logic sealed - EMA9 has lost command; tactical control has shifted to neutrality with bear undertones.
⊢
▦ EMA21 - (Exponential Moving Average - 21 Close):
∴ EMA21 currently sits at $118,164.50, acting as an overhead suppressor;
∴ The gap between EMA9 and EMA21 is compressing, signaling potential for either crossover or volatility breakout;
∴ Price action is now trapped between EMA9 and EMA50, with EMA21 forming the upper barrier of a tactical box.
✴️ Conclusion: Logic sealed - EMA21 serves as containment lid; rejection here confirms tactical indecision.
⊢
▦ EMA50 - (Exponential Moving Average - 50 Close):
∴ EMA50 rests at $117,262.74, offering foundational support within the current structure;
∴ Price has respected this level on multiple dips since mid-July, confirming its strategic function as mid-term equilibrium;
∴ The slope remains mildly upward - no sign of reversal, only compression beneath.
✴️ Conclusion: Logic sealed - EMA50 maintains its structural role as mid-range dynamic floor.
⊢
▦ EMA200 - (Exponential Moving Average - 200 Close):
∴ EMA200 remains well below at $111,765.30, untouched since early July;
∴ Its wide distance from price confirms that the broader structure remains in bullish territory;
∴ Its trajectory continues upward, anchoring the uptrend beneath all volatility.
✴️ Conclusion: Logic sealed - EMA200 secures the long-term structure; market remains elevated far above reversal threshold.
⊢
▦ Ichimoku Cloud - (9, 21, 50, 21):
∴ Price is currently within the Kumo (cloud) zone, defined between SSA and SSB - a region of ambiguity and compression;
∴ The Senkou Span A and Span B are nearly flat, signaling lack of directional command in the near term;
∴ Kijun and Tenkan lines are converged, offering no trend bias - equilibrium is dominating.
✴️ Conclusion: Logic sealed - Ichimoku confirms a neutralized compression state; breakout required for trend clarity.
⊢
▦ RSI (21) + EMA9 - (Relative Strength Index with Signal Smoothing):
∴ RSI value stands at (51.48), while the EMA9-signal rests at (52.25) - confirming a soft bearish crossover;
∴ The RSI has declined from its recent peak and now oscillates around the neutral 50-line;
∴ Momentum is waning without structural damage, indicating tactical cooling.
✴️ Conclusion: Logic sealed - RSI confirms suspended momentum; structural neutrality prevails beneath fading thrust.
⊢
▦ Stochastic RSI - (3, 3, 21, 9):
∴ Current values are: (%K = 35.33), (%D = 32.68) - with %K slightly above %D, forming a mild bullish crossover;
∴ The oscillator has just risen from oversold levels, indicating potential energy buildup;
∴ Prior cycles in this zone have produced false starts, so confirmation is essential.
✴️ Conclusion: Logic sealed - Stoch RSI hints at rebounding energy, but with fragile structure and low reliability.
⊢
▦ MACD - (9, 21, 9 - EMA/EMA):
∴ MACD Line = (–105.52), Signal Line = (–129.07), Histogram = (+23.55) - confirming a bullish crossover;
∴ The crossover occurred below the zero line, indicating a possible reversal from weakness rather than strength;
∴ Slope of MACD is positive but modest - insufficient to declare dominant shift.
✴️ Conclusion: Logic sealed - MACD is in bullish transition mode, but still recovering from beneath structural base.
⊢
▦ OBV + EMA9 - (On-Balance Volume with Trend Overlay):
∴ OBV currently reads (71.13M), and is slightly above its EMA9, signaling retention of volume without strength;
∴ Volume has not left the system - but neither has it surged; this is passive accumulation at best;
∴ No divergence exists for now, but lack of buildup implies neutral positioning.
✴️ Conclusion: Logic sealed - OBV is stable and neutral; no buyer escape, but no commitment surge either.
⊢
▦ Volume + EMA21 – (Volume Profile with Trend Average):
∴ Current volume bar = (13.91), sitting below the EMA21 baseline;
∴ The volume profile across recent sessions is declining - suggesting consolidation or exhaustion;
∴ No breakout volume spike has accompanied price stabilization - trend is under silent compression.
✴️ Conclusion: Logic sealed - volume fails to validate price levels; tactical fragility remains unresolved.
⊢
🜎 Strategic Insight – Technical Oracle:
∴ The H4 structure presents a state of compression beneath a neutral cloud, suspended between tactical short-term EMA's (9, 21) and safeguarded by a rising EMA50 backbone;
∴ Momentum oscillators (RSI, Stoch RSI, MACD) converge toward reactivation, yet none have broken decisively above neutral thresholds - reflecting potential, not power;
∴ Volume participation is inconsistent and fading, offering no confirmation for breakout - the market is in silent observation mode, not assertion;
∴ Ichimoku confirms indecision: price floats within Kumo, without command or breakout - equilibrium reigns;
∴ Price positioning remains elevated above the deeper structure (EMA200), but its current zone between EMA9 and EMA50 represents a coil of indecision;
∴ The overall condition is not bearish - but it is tactically suspended, lacking conviction, awaiting external ignition.
✴️ Conclusion: The Oracle confirms - the structure is intact, but tactical initiative is lost; the field is poised, not marching.
⊢
∫ II. On-Chain Intelligence – (Source: CryptoQuant):
▦ Short-Term Holder (SOPR):
∴ SOPR currently reads (1.001), meaning short-term holders are spending coins with no significant profit or loss - a signal of economic neutrality;
∴ The chart displays persistent lateral volatility around the (1.0) threshold since early July - no emotional dominance in market behavior;
∴ This pattern historically coincides with pre-expansion compression phases, rather than breakdown events.
✴️ Conclusion: Logic sealed - SOPR confirms behavioral neutrality among short-term holders; the market remains in a state of expectation, not realization.
⊢
▦ STH-MVRV - (Short-Term Holder Market Value to Realized Value):
∴ The metric is currently oscillating around (1.30), well above the danger zone at (1.0), but far below the euphoria threshold at (1.8);
∴ The structure reflects multiple euphoria rejections, followed by a return to balance - a classic cooling-off pattern without structural failure;
∴ Convergence between market price, realized value, and short-term cost basis indicates the market is retesting foundation zones.
✴️ Conclusion: Logic sealed - STH-MVRV confirms post-euphoric cooling with structural support intact; no active trend, no breakdown.
⊢
▦ Exchange Inflow Spent Output Age Bands - (All Exchanges):
∴ Inflows to exchanges have been consistently low in recent weeks, particularly among young coins (0d–1d, 1d–1w) - showing no urgency to sell;
∴ Aged outputs (>6m) remain dormant - long-term holders are not mobilizing;
∴ The absence of inflow pressure signals no macro panic or exit event, reinforcing the diagnosis of tactical compression.
✴️ Conclusion: Logic sealed - muted inflows confirm a lack of distribution catalysts; stable structure sustains the technical silence on the 4H chart.
⊢
🜎 Strategic Insight - On-Chain Oracle:
∴ All three on-chain metrics converge into a clear state of tactical equilibrium - not bearish, not euphoric, but suspended between action and observation;
∴ Short-Term Holder SOPR stabilizes at (1.001), marking a precise psychological stasis - profit-taking and panic-selling are both absent;
∴ STH-MVRV confirms a post-euphoria cooldown with structural preservation, implying that short-term holders have recalibrated expectations without abandoning their positions;
∴ Exchange inflows remain historically depressed, with no aged coins activating - a hallmark of silent markets preparing for resolution;
∴ The chain speaks softly: no exit, no aggression, no irrationality - only latency, and the potential energy of stillness.
✴️ Conclusion: The Oracle confirms - the on-chain architecture reflects suspended initiative; nothing is broken, nothing is charged - only paused.
⊢
𓂀 Stoic-Structural Interpretation:
▦ Structurally: Bullish;
∴ Price remains well above the EMA200 and EMA50, with no breach of long-term support;
∴ All EMA's (9, 21, 50) are compressing, but retain upward trajectory - confirming structural integrity;
∴ Ichimoku Kumo holds price within a neutral band, but does not reflect a breakdown.
⊢
▦ Momentum-wise: Suspended Compression.
∴ MACD shows bullish crossover from beneath, but lacks amplitude to confirm trend reversal;
∴ RSI is parked around 50 with a bearish signal crossover - signaling stagnation, not strength;
∴ Stochastic RSI is climbing out of oversold, but with no impulsive follow-through.
⊢
✴️ Final Codex Interpretation:
∴ The H4 structure is consolidating beneath short-term resistance and within equilibrium clouds;
∴ Momentum is rebuilding, but flow remains stagnant;
∴ Buyers have not exited, but neither have they re-initiated force;
∴ The chart breathes - but does not speak.
⊢
⧉
· Cryptorvm Dominvs · MAGISTER ARCANVM · Vox Primordialis ·
⚜️ ⌬ - Silence precedes the next force. Structure is sacred - ⌬ ⚜️
⧉
⊢

Bitcoin in Tactical Suspension - Beneath the Compression Veil.⊣
⨀ BTC/USD – BINANCE – (CHART: H1) – (July 19, 2025).
◇ Analysis Price: $118,192.34.
⊣
⨀ I. Temporal Axis - Strategic Interval - (H1):
▦ EMA9 - (Exponential Moving Average - 9 Close):
∴ Price: $118,192.34 | EMA9: $118,176.07;
∴ EMA9 is currently being pierced by price - neither clearly above nor decisively rejected;
∴ The EMA9 has flattened - signaling short-term equilibrium tension, not momentum dominance;
∴ Price candles are compressing into the EMA9 without thrust - indecision at the microstructure.
✴️ Conclusion: Logic sealed - EMA9 reflects tactical stalling; energy coiled at surface level.
⊢
▦ EMA21 - (Exponential Moving Average - 21 Close):
∴ EMA21: $118,199.53 - now above current price, acting as immediate tactical resistance;
∴ A minor bearish slope is forming in EMA21, reflecting recent downside pressure;
∴ Price failed to sustain any candle close above this level in the last 5 sessions - confirming resistance activation.
✴️ Conclusion: Logic sealed - EMA21 has turned from guide to barrier; tactical trend favors compression below.
⊢
▦ EMA50 - (Exponential Moving Average - 50 Close):
∴ EMA50 stands at $118,400.31, well above both price and the shorter EMA's - defining a ceiling of short-term exhaustion;
∴ Its curve is turning sideways, indicating that dominant upward momentum has faded;
∴ The last time price touched EMA50 was during the failed attempt to reclaim the upper Bollinger band - sign of rejection.
✴️ Conclusion: Logic sealed - EMA50 confirms the upper boundary of compression; the short-term trend remains capped.
⊢
▦ Bollinger Bands - (21 SMA, 2 Standard Deviations):
∴ Current BB range:
• Upper Band: $118,586.19;
• Lower Band: $117,291.33;
• Midline - (SMA21): $117,938.76;
∴ Price sits marginally above the midline, but beneath the upper band - indicating a neutral stance within the envelope;
∴ Bands are in a state of mild contraction, reflecting reduced volatility and lack of decisive breakout pressure;
∴ Price has failed to close above the upper band on multiple attempts, suggesting exhaustion without thrust;
✦ Tactical Signal:
• The flattened curvature of the bands and the centering of price near the midline indicates that the market is in compression;
• This condition favors mean-reversion trades or breakout anticipation setups, but lacks directional conviction;
• No squeeze pattern is imminent - but energy is coiling slowly.
✴️ Conclusion: Logic sealed - Bollinger structure is balanced, with compression overtaking directional thrust; breakout not yet awakened.
⊢
▦ Volume + EMA21 - (Tactical Volume Profile H1):
∴ The latest H1 volume candle registers 9 (unit scale), significantly below the average trend of the prior days;
∴ There has been a consistent decline in volume since the spike observed near the $120k rejection zone - participation is fading;
∴ Volume EMA21 is now visibly above most recent volume bars, signaling that market energy has dropped beneath its tactical baseline;
✦ Tactical Diagnosis:
• A market with low volume near compression zones often reflects lack of initiative, not calm;
• The absence of sellers is not strength - it is hesitation;
• The lack of follow-through volume confirms that current price action is drifting, not being driven.
∴ No volume-led breakout is forming - the structure is floating within silence.
✴️ Conclusion: Logic sealed - tactical volume profile confirms stasis; market awaits external spark to ignite movement.
⊢
▦ RSI (21) + EMA9 - (Relative Strength Index – H1):
∴ RSI value: 48.13, EMA9 of RSI: 47.86 - both seated precisely on the neutral axis (50), indicating momentum equilibrium;
∴ RSI has been flatlining between 45/50 for several hours, reflecting a lack of directional force from both bulls and bears;
∴ The minor bullish crossover of RSI over its EMA9 is present, but lacks slope, strength, or historical reliability in the current formation;
✦ Interpretation Layer:
• This is a classic pause zone - RSI not weak enough to signal reversal, not strong enough to suggest advance;
• The close proximity of RSI and its EMA9 suggests a market suspended in technical indecision;
• No bullish or bearish divergence is visible - just momentum silence.
∴ Tactical RSI echoes the broader reading: structure without drive, energy held in restraint.
✴️ Conclusion: Logic sealed - RSI reflects equilibrium; momentum direction is undefined and dormant.
⊢
▦ MACD (9,21) - (Tactical Momentum Engine - H1):
∴ Current MACD Line: (+165.21), Signal Line: (+188.36) - forming a bearish crossover, with the MACD line now trailing the signal line for multiple candles;
∴ The histogram is negative and expanding, confirming that bearish momentum is actively growing, not stalling;
∴ The slope of the MACD line has turned definitively downward, with no flattening in sight - this indicates a sustained momentum bleed;
✦ Tactical Interpretation:
• The momentum crest occurred near $119,700, and since then, MACD has been fading consistently;
• Price has failed to reclaim the MACD highs despite proximity, suggesting a divergence in effort vs. energy;
• This is not a false cross - but a validated tactical downturn with histogram acceleration.
∴ The engine beneath the structure is declining in output - the wheels turn, but they no longer drive.
✴️ Conclusion: Logic sealed - MACD confirms tactical momentum decay; the engine is reversing beneath the surface.
⊢
▦ Stochastic RSI (3,3,21,9) - (Short-Term Momentum Oscillator - H1):
∴ %K: 51.29, %D: 68.32 - a confirmed bearish crossover has occurred, with %K now beneath %D and both values descending;
∴ The oscillator has recently exited the overbought region (>80) and is now transitioning through the mid-zone, reflecting short-term loss of thrust;
∴ Price has failed to respond to prior overbought readings with continuation — indicating momentum dissipation without execution;
✦ Microstructure Insight:
• The current descending arc of %K + %D shows that micro-traders are unwinding positions;
• The zone between 50/70 is a tactical fading region, not a place of strength;
• Absence of a rebound in %K suggests that short-term buyers are standing down.
∴ This oscillator confirms that momentum is not only absent - it is actively declining at the tactical level.
✴️ Conclusion: Logic sealed - short-term momentum cycle is unwinding; compression reigns over velocity.
⊢
▦ OBV + EMA9 - (On-Balance Volume with Tactical Smoothing - H1):
∴ Current OBV: (–89.21K, EMA9 of OBV: –89.02K) - OBV remains slightly below its moving average, indicating a net negative flow of volume;
∴ While price has drifted sideways, OBV has continued to tilt downward, reflecting silent capital outflow beneath surface price stability;
∴ There is no upward curvature or crossover attempt - the OBV line remains submissive, signaling passivity or tactical retreat from market participants;
✦ Strategic Implication:
• The sustained divergence between OBV and price implies that larger hands are not accumulating - rather, they are disengaged;
• This condition often precedes fake breakouts or downward drifts, especially when unconfirmed by volume or RSI;
• The EMA9 serving as a lid rather than support confirms that internal flow is structurally bearish at the H1 frame.
∴ The tactical OBV structure reveals the undercurrent: orderless and hollow, despite price still holding ground.
✴️ Conclusion: Logic sealed - OBV confirms quiet withdrawal of pressure; tactical structure lacks foundational support.
⊢
🜎 Strategic Insight - Technical Oracle:
∴ The H1 tactical frame reveals a market in constrained inertia - price floats between short-term EMA's, yet every major momentum engine (MACD, Stochastic RSI, OBV) confirms internal recession;
∴ EMA's no longer guide - they constrain;
∴ Bollinger Bands contract - but hold no breakout;
∴ Volume is absent - and OBV confirms retreat;
∴ The chart is alive in form, yet dead in force;
∴ No element acts as initiator - only sustainers remain;
∴ The next tactical move must emerge externally, not organically.
✴️ Conclusion: The Tactical Oracle speaks - market energy is sealed beneath compression; movement is possible, but currently unprovoked.
⊢
▦ Structurally (H1):
✴️ Structurally: Neutral.
∴ Price floats near EMA9, below EMA21 and EMA50 - without rejection or breakthrough;
∴ No directional dominance has been established in the current cycle;
∴ Compression prevails over construction - this is not collapse, but pause.
✴️ Conclusion: Logic sealed - the structure is balanced but unsustained; no active trend is in command.
⊢
▦ Tactically: Suspended under Soft Compression:
∴ Momentum indicators (MACD, Stoch RSI, OBV) are all aligned in tactical decay - no upside thrust is evident;
∴ Volume remains below threshold and fails to accompany price fluctuations - a sign of apathy, not conflict;
∴ Price is trapped between EMA's and centered within Bollinger range - with no pressure buildup for breakout.
✴️ Conclusion: Logic sealed - the market is in tactical suspension, drifting within a soft compression chamber; movement requires external ignition.
⊢
⧉
· Cryptorvm Dominvs · MAGISTER ARCANVM · Vox Primordialis ·
⚜️ ⌬ - Wisdom begins in silence. Precision unfolds in strategy - ⌬ ⚜️
⧉
⊢

Bitcoin at the Edge of the Fibonacci Gate - Silent Strain.⊣
⟁ BTC/USD - BINANCE - (CHART: 1D) - (Jul 18, 2025).
◇ Analysis Price: $118,866.60.
⊣
⨀ I. Temporal Axis - Strategic Interval - (1D):
▦ EMA9 - (Exponential Moving Average - 9 Close):
∴ EMA9 is currently positioned at $119,077.81, closely tracking the current price, acting as dynamic micro-support;
∴ The slope of EMA9 remains upward, with price consistently closing above it in the past sessions;
∴ Compression candles are forming above this line, suggesting it is being defended as a tactical floor.
✴️ Conclusion: EMA9 is structurally supportive, signaling short-term bullish control beneath compression.
⊣
▦ EMA21 - (Exponential Moving Average - 21 Close):
∴ EMA21 is placed at $118,537.29 and holds a clear upward slope;
∴ Recent pullbacks have tested the region near EMA21 but failed to close beneath it;
∴ EMA21 is establishing itself as the primary mid-range buffer zone within this bullish phase.
✴️ Conclusion: EMA21 confirms intermediate momentum preservation and mid-term trend integrity.
⊢
▦ EMA50 - (Exponential Moving Average - 50 Close):
∴ EMA50 is located at $116,804.80 and remains untouched during the current rally phase;
∴ The distance between EMA21 and EMA50 is widening, confirming structural momentum;
∴ This line now functions as the lower tier of the bullish envelope - a defensive anchor.
✴️ Conclusion: EMA50 reflects resilient bullish understructure and rising support basin.
▦ Fibonacci Retracement - (ATH = $122,056.95 / Low = $74,623.79):
∴ Price is currently positioned just under the 0.786 level, a classic tension zone before ATH retests;
∴ The 0.618 level has already been claimed and held as support, showing strength through key retracements;
∴ The market is coiling between 0.786 and 1.000 in preparation for decisive expansion or rejection.
✴️ Conclusion: BTC sits within the golden gate - structurally pressurized near final resistance thresholds.
⊢
▦ Bollinger Bands:
∴ Bands are visibly contracting, forming a volatility funnel around the current price zone;
∴ The price is maintaining proximity to the upper band without closing beyond it;
∴ The base band remains far beneath ($116k zone), indicating untriggered potential.
✴️ Conclusion: Volatility is compressing structurally; directional resolution is imminent.
⊢
▦ Volume + EMA21:
∴ Volume bars have declined steadily during this upper-range consolidation;
∴ EMA21 on volume confirms weakening participation relative to early July moves;
∴ Absence of breakout-volume suggests either stealth accumulation or passive stalling.
✴️ Conclusion: Volume behavior is non-confirmatory - the structure floats without conviction.
⊢
▦ RSI - (21) + EMA9:
∴ RSI(21) currently prints 60.45, above its own EMA9 at 59.41, suggesting net upward pressure;
∴ The RSI slope remains neutral-to-positive without entering overbought;
∴ The absence of bearish divergence confirms internal momentum coherence.
✴️ Conclusion: RSI structure is clean, moderate, and aligned with sustainable trend energy.
⊢
▦ Stochastic RSI - (3,3,21,9):
∴ K = 78.78 | D = 71.55 - both above 70, nearing the overbought ceiling;
∴ The fast line (K) shows minor inflection but no confirmed cross;
∴ Momentum is elevated, but historical context shows price can remain extended.
✴️ Conclusion: Momentum is entering saturation zone - caution on short-term exhaustion.
⊢
▦ MACD - (9,21):
∴ MACD line (540.52) remains above the signal line (414.93) in sustained bullish crossover;
∴ The histogram has begun flattening, indicating reduced acceleration;
∴ There is no bearish cross yet, but momentum build is slowing.
✴️ Conclusion: MACD supports bullish continuation, but thrust intensity is decaying.
⊢
▦ OBV + EMA9:
∴ OBV reads 71.13M and is currently flat, with no new highs in accumulation;
∴ EMA9 on OBV closely hugs the raw OBV line, confirming stagnation;
∴ Prior upward surges in OBV are not being extended, showing tactical pause in conviction.
✴️ Conclusion: Liquidity expansion has halted; OBV structure is tactically neutral.
⊢
🜎 Strategic Insight - Technical Oracle:
∴ The BTC/USD structure is entering a compressed apex between structural momentum (EMA stack, RSI, MACD) and tactical exhaustion signals (Stochastic RSI, Bollinger Band constriction, flattening OBV);
∴ Price is stabilizing just beneath the ATH gate ($122,056), indicating a threshold scenario - where breakout and rejection probabilities are approaching parity;
∴ Volume decline reflects the absence of forced participation, and suggests that the next move will be event-triggered or liquidity-engineered. The current environment favors volatility re-expansion, not trend reversal;
✴️ This is a threshold phase: structurally bullish, tactically suspended, awaiting ignition.
⊢
∫ II. On-Chain Intelligence – (Source: CryptoQuant):
▦ Exchange Netflow Total + EMA9:
∴ Current Netflow: -938 Bitcoins - sustained negative flow over time indicates coins leaving exchanges;
∴ Persistent outflows reflect holding sentiment and reduced immediate sell pressure;
∴ Price action shows historical upside alignment when netflows remain negative across clusters.
✴️ Conclusion: Exchange behavior signals macro holding bias, not liquidation cycles.
⊢
▦ Binary CDD + EMA9:
∴ Binary CDD has spiked into high activity zones in the past week, showing awakened dormant coins;
∴ This metric historically precedes localized tops when synchronized with weak flows;
∴ However, no consistent clusters are forming - signals remain scattered.
✴️ Conclusion: Binary CDD reflects isolated movements, not systemic awakening or distribution.
⊢
▦ Exchange Whale Ratio + EMA9:
∴ Current ratio hovers at ~0.62 - elevated but not extreme;
∴ Sustained whale activity near 0.60+ can precede volatility events;
∴ Trendline is rising since May, showing gradual uptick in dominance from top senders.
✴️ Conclusion: Whale activity is tactically elevated, implying latent strategic intent.
⊢
▦ Supply-Adjusted Dormancy + EMA9:
∴ Dormancy values are near historical lows, indicating old coins are staying inactive;
∴ EMA9 confirms a downward trend in dormant supply movement;
∴ Long-term holders are not distributing at this level.
✴️ Conclusion: Structural dormancy supports holder conviction - no exit signals from old supply.
⊢
▦ Realized Cap + EMA9:
∴ Realized Cap is now exceeding $1T, rising consistently without parabolic spikes;
∴ EMA(9) and line are in lockstep - a healthy ascent;
∴ No acceleration = no blow-off = sustainable revaluation.
✴️ Conclusion: Value accumulation remains organic, not euphoric.
⊢
▦ MVRV Ratio + EMA9:
∴ MVRV sits at 2.36 - below historical overvaluation levels (>3.0);
∴ EMA(9) confirms gradual slope upward, consistent with price;
∴ Ratio is not overheated - risk/reward remains structurally favorable.
✴️ Conclusion: MVRV indicates non-euphoric regime - mid-phase of value appreciation.
⊢
▦ BTC vs GOLD vs S&P500 - (BGemetrix Comparative Graph):
∴ BTC continues to outperform both GOLD and SPX in long-term slope, even after corrections;
∴ Current phase shows GOLD flattening and SPX slightly lagging BTC in verticality;
∴ This divergence hints at BTC leading in speculative rotation while traditional assets stabilize.
✴️ Conclusion: BTC holds macro-dominance position, operating as the apex volatility proxy in current intermarket structure.
⊢
🜎 Strategic Insight - On-Chain Oracle:
∴ Despite short-term compression, the on-chain structure reveals no distribution threats;
∴ Holder conviction, realized valuation, and MVRV slope all suggest controlled structural appreciation, not mania;
∴ Whales are tactically present, but dormancy and exchange flows confirm no mass exit;
∴ This is an internally coherent, tactically patient regime.
✴️ Bitcoin is preparing, not peaking.
⊢
𓂀 Stoic-Structural Interpretation:
▦ Structurally Bullish - Tactically Suspended:
∴ All key EMA's (9/21/50) are stacked and rising; price remains elevated yet non-parabolic;
∴ Fibonacci apex is active, with price compressing beneath the ATH zone ($122,056), not retreating;
∴ On-chain intelligence confirms long-term conviction, with no distribution from whales or dormants.
✴️ Conclusion: The system retains structural strength; pressure is latent, not expired. The architecture is bullish, not euphoric.
⊢
▦ Tactical Range Caution:
∴ Stochastic RSI and MACD show early-stage exhaustion;
∴ Volume has declined into apex, favoring liquidity traps or volatility bursts;
∴ Whale Ratio elevation implies pre-positioning behavior, not public confirmation.
✴️ Conclusion: Tactical maneuvering is dominant. Breakout potential exists but is not trustable until confirmed by volume and displacement.
⊢
⧉
Cryptorvm Dominvs · ⚜️ MAGISTER ARCANVM ⚜️ · Vox Primordialis
⌬ - Wisdom begins in silence. Precision unfolds in strategy - ⌬
⧉
⊢

Bitcoin Strategic Compression Beneath the Cloud Gate.⊣
⟁ BTC/USD - BINANCE - (CHART: 4H) - (July 17, 2025).
◇ Analysis Price: $118,099.62.
⊣
⨀ I. Temporal Axis - Strategic Interval – (4H):
▦ EMA9 - (Exponential Moving Average - 9 Close):
∴ EMA9 is currently positioned at $118,286.83, marginally above the current price of $118,099.62;
∴ The slope of the EMA9 has begun to turn sideways-to-downward, indicating loss of short-term acceleration;
∴ The price has crossed below EMA9 within the last two candles, suggesting an incipient rejection of immediate bullish continuation.
✴️ Conclusion: Short-term momentum has weakened, positioning EMA 9 as immediate dynamic resistance.
⊢
▦ EMA21 - (Exponential Moving Average - 21 Close):
∴ EMA21 is measured at $118,018.67, positioned slightly below both price and EMA9, indicating a recent tightening of trend structure;
∴ The slope of EMA21 remains positive, preserving the medium-range bullish structure intact;
∴ EMA21 has been tested multiple times and held as support since July 15 - confirming tactical reliability as dynamic floor.
✴️ Conclusion: EMA21 stands as a critical pivot zone; any sustained breach would denote structural stress.
⊢
▦ EMA50 - (Exponential Moving Average - 50 Close):
∴ EMA50 is currently located at $116,240.85, well below current price action;
∴ The curve maintains a healthy positive inclination, affirming preservation of broader intermediate trend;
∴ No contact or proximity to EMA50 over the last 20 candles - indicating strong bullish detachment and buffer zone integrity.
✴️ Conclusion: EMA50 confirms medium-term bullish alignment; not yet challenged.
⊢
▦ EMA200 - (Exponential Moving Average - 200 Close):
∴ EMA200 stands at $110,539.69, forming the base of the entire 4H structure;
∴ The gradient is gradually rising, reflecting accumulation over a long time horizon;
∴ The distance between price and EMA200 reflects extended bullish positioning, yet also opens risk for sharp reversion if acceleration collapses.
✴️ Conclusion: Long-term structure remains bullish; early signs of overextension exist.
⊢
▦ Ichimoku Cloud - (9, 21, 50, 21):
∴ Price is currently above the Kumo (cloud), placing the pair within a bullish regime;
∴ Tenkan-sen (conversion) and Kijun-sen (base) lines show narrowing separation, suggesting momentum compression;
∴ Senkou Span A > Span B, and the cloud ahead is bullishly twisted, though thinning - indicating potential vulnerability despite structural advantage.
✴️ Conclusion: Bullish regime intact, but loss of momentum and cloud compression warrant caution.
⊢
▦ Volume + EMA21:
∴ Current volume for the latest candle is 3 BTC, compared to the EMA21 of 84 BTC;
∴ This indicates an extremely low participation phase, often associated with distribution zones or indecisive consolidation;
∴ Previous impulsive candles (July 15) reached well above 100 BTC - the current contraction is stark and strategically significant.
✴️ Conclusion: Absence of volume threatens trend continuation; energy depletion apparent.
⊢
▦ RSI - (21) + EMA9:
∴ RSI (21) is positioned at 55.73, marginally above neutral zone;
∴ EMA 9 of RSI is 57.71, crossing downward against RSI - bearish micro signal;
∴ No divergence is present versus price action - oscillator confirms current stagnation rather than exhaustion.
✴️ Conclusion: RSI losing strength above neutral; lacks momentum for breakout, but no capitulation.
⊢
▦ Stoch RSI - (3,3,21,9):
∴ %K is 21.44, %D is 45.34 - both pointing downward, in deacceleration phase;
∴ Recent rejection from overbought zone without full reset into oversold - signaling weak bullish thrust;
∴ Historical cycles show rhythmical reversals near current levels, but only with supportive volume, which is absent now.
✴️ Conclusion: Short-term momentum failed to sustain overbought breakout - micro-correction expected.
⊢
▦ MACD - (9, 21):
∴ MACD line is at -104.80, Signal line at 268.16 - large separation, histogram deeply negative;
∴ The bearish crossover occurred with declining volume, implying fading momentum rather than aggressive sell-off;
∴ No bullish divergence formed yet - continuation of correction remains technically favored.
✴️ Conclusion: MACD confirms trend exhaustion; no reversal in sight.
⊢
▦ OBV + EMA 9:
∴ OBV is 71.13M, perfectly aligned with its EMA9 - indicating equilibrium in volume flow;
∴ No directional bias in accumulation or distribution - flatlining suggests passive environment;
∴ Prior OBV uptrend has stalled since July 15 - reinforcing narrative of hesitation.
✴️ Conclusion: Institutional flow is neutral; no aggressive positioning detected.
⊢
🜎 Strategic Insight - Technical Oracle: The current price structure presents a classic post-impulse compression configuration within a preserved bullish environment. Despite the higher timeframe alignment, multiple short-term indicators exhibit tactical dissonance and signs of momentum decay. This inconsistency reflects a market caught between structural optimism and tactical hesitation.
♘ Key strategic signals - Structural Alignment:
∴ All major EMA's (9, 21, 50, 200) remain stacked in bullish order with no bearish crossovers imminent;
∴ Price remains above the Ichimoku Cloud and above EMA50 - both confirming structural dominance by buyers.
♘ Momentum Degradation:
∴ RSI (21) is drifting below its EMA9, weakening the momentum required for further upside continuation;
∴ Stochastic RSI has rolled over aggressively, failing to reach oversold before reversing - mid-cycle weakness is confirmed.
♘ Volume Collapse:
∴ The current volume profile is critically weak - 3 Bitcoin against an average of 84 Bitcoins (EMA21);
∴ Price attempting to sustain above EMA's with no conviction signals distribution or passivity.
♘ MACD & OBV:
∴ MACD histogram remains deep in negative territory, and no bullish crossover is visible;
∴ OBV is flat - neither accumulation nor distribution dominates, leaving directional thrust suspended.
✴️ Oracle Insight:
∴ The technical field is Structurally Bullish, but Tactically Compressed.
∴ No breakout should be expected unless volume decisively returns above baseline (84 Bitcoins EMA);
∴ Below $117,800, the structure risks transition into a corrective phase;
∴ Above $118,450, potential trigger zone for bullish extension if accompanied by volume surge.
♘ Strategic posture:
∴ Wait-and-observe regime activated;
∴ No entry condition satisfies both structure and momentum at present;
∴ Tactical neutrality is advised until confirmation.
⊢
∫ II. On-Chain Intelligence - (Source: CryptoQuant):
▦ Exchange Reserve - (All Exchanges):
∴ The total Bitcoin reserves held on all exchanges continue a sharp and uninterrupted decline, now at ~2.4M BTC, down from over 3.4M in mid-2022;
∴ This downtrend has accelerated particularly after January 2025, with a visible drop into new lows - no accumulation rebound observed;
∴ Historically, every prolonged depletion of exchange reserves correlates with structural bullish setups, as supply becomes increasingly illiquid.
✴️ Conclusion: On-chain supply is structurally diminishing, confirming long-term bullish regime intact - mirrors technical EMA alignment.
⊢
▦ Fund Flow Ratio - (All Exchanges):
∴ Current Fund Flow Ratio stands at 0.114, which is well below historical danger thresholds seen near 0.20-0.25 during local tops;
∴ The ratio has remained consistently low throughout the 2025 uptrend, indicating that on-chain activity is not directed toward exchange-based selling;
∴ Spikes in this indicator tend to precede local corrections - but no such spike is currently present, reinforcing the notion of non-threatening capital flow.
✴️ Conclusion: Capital is not rotating into exchanges for liquidation - volume weakness seen in 4H chart is not linked to sell intent.
⊢
▦ Miners' Position Index - (MPI):
∴ The MPI sits firmly below the red threshold of 2.0, and currently ranges in sub-neutral levels (~0.5 and below);
∴ This suggests that miners are not engaging in aggressive distribution, and are likely retaining Bitcoin off-exchange;
∴ Sustained low MPI readings during price advances confirm alignment with institutional and long-term accumulation behavior.
✴️ Conclusion: Miner behavior supports structural strength - no mining-induced supply pressure present at this stage.
⊢
🜎 Strategic Insight - On-Chain Oracle:
∴ Across the three strategic indicators, no on-chain evidence supports short-term weakness;
∴ Supply is declining - (Exchange Reserve ↓);
∴ Funds are not preparing for exit - (Flow Ratio stable);
∴ Miners are not selling - (MPI subdued).
✴️ This constellation reinforces the thesis of Structural Bullishness with Tactical Compression, and suggests that any pullback is not backed by foundational stress.
⊢
𓂀 Stoic-Structural Interpretation:
∴ The multi-timeframe EMA stack remains intact and aligned - (9 > 21 > 50 > 200);
∴ Price floats above Ichimoku Cloud, and above EMA21 support, confirming elevated positioning within a macro bull channel;
∴ On-chain metrics confirm supply contraction, miner retention, and absence of fund rotation toward exchanges - structure remains sovereign;
∴ RSI - (21) slips under its EMA9 with low amplitude, indicating absence of energetic flow;
∴ Stoch RSI fails to reset fully and points downward - suggesting premature momentum decay;
∴ MACD histogram remains negative, while volume is significantly beneath EMA baseline (3 BTC vs 84 BTC);
∴ Price faces resistance at Kijun-sen ($118.451), acting as tactical ceiling; no breakout signal detected.
⊢
✴️ Interpretatio Finalis:
∴ Structural integrity remains unshaken - the architecture is bullish;
∴ Tactically, however, the battlefield is fogged - silence reigns in volume, hesitation in oscillators;
∴ A true continuation requires volume resurrection and resolution above $118,450. Until then, neutrality governs the edge.
⊢
⧉
Cryptorvm Dominvs · ⚜️ MAGISTER ARCANVM ⚜️ · Vox Primordialis
⌬ - Wisdom begins in silence. Precision unfolds in strategy - ⌬
⧉
⊢
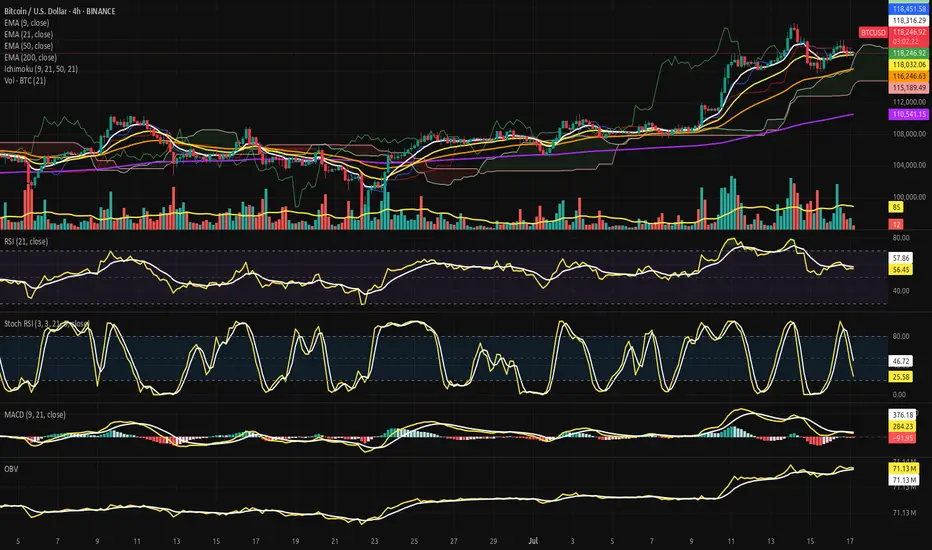
Bitcoin Ascends into the Clear Sky: Structural Break Confirmed.⊣
⟁ BTC/USD - BINANCE - (CHART: 1D) - (Jul 14, 2025).
◇ Analysis Price: $121,662.29.
⊣
⨀ I. Temporal Axis - Strategic Interval - (1D):
▦ EMA9 - ($115,313.08):
∴ The EMA9 is aggressively sloped upward, serving as dynamic support during the latest expansion phase.
✴️ Conclusion: Bullish control confirmed; momentum is guided tightly by the EMA9 anchor.
⊣
▦ EMA21 - ($111,636.30):
∴ EMA21 remains positively inclined, acting as a structural trend base beneath price and volume clusters.
✴️ Conclusion: Market remains structurally sound as long as price stays above the 21-day mean.
⊣
▦ Volume + EMA21 - (Volume: 497.79 BTC - EMA21: 262 BTC):
∴ Volume surge surpasses the rolling average, confirming institutional participation and breakout legitimacy.
✴️ Conclusion: Volume expansion validates price movement - no signs of divergence or exhaustion detected.
⊣
▦ RSI + EMA9 - (RSI: 77.99 - EMA9: 68.49):
∴ RSI has entered overbought territory, yet its trajectory remains upward and wide above its smoothing band.
✴️ Conclusion: Bullish momentum sustained; overbought conditions not yet reversing.
⊣
▦ MACD - (9, 21, 9) + EMA's smoothing:
∴ MACD: 3,271.60 | Signal: 2,013.81 | Divergence: +1,257.79;
∴ The MACD line is expanding positively over its signal, confirming momentum acceleration.
✴️ Conclusion: Technical conviction favors bullish continuation; signal remains clean and unsaturated.
⊣
▦ Ichimoku Cloud - (9, 26, 52, 26):
∴ Price is decisively above the Kumo cloud - “Clear Sky” territory;
∴ Senkou Span A = 121,653.30 | Senkou Span B = 112,486.54;
∴ Tenkan and Kijun lines are sharply elevated, confirming trend authority.
✴️ Conclusion: Zero resistance above; cloud projection supports further upward development.
⊣
🜎 Strategic Insight - Technical Oracle:
∴ All indicators are aligned in a rare harmonic convergence, signaling trend expansion with no current topping structure;
∴ Market shows the behavior of an advanced impulse wave entering Phase II expansion;
∴ Strategic play remains bullish - pullbacks, if any, should be shallow and fast.
⊣
𓂀 Stoic-Structural Interpretation:
∴ Structurally Bullish – Tactically Advancing
⊢
⧉
Cryptorvm Dominvs · ⚜️ MAGISTER ARCANVM ⚜️ · Vox Primordialis
⌬ - Wisdom begins in silence. Precision unfolds in strategy - ⌬
⧉
⊢
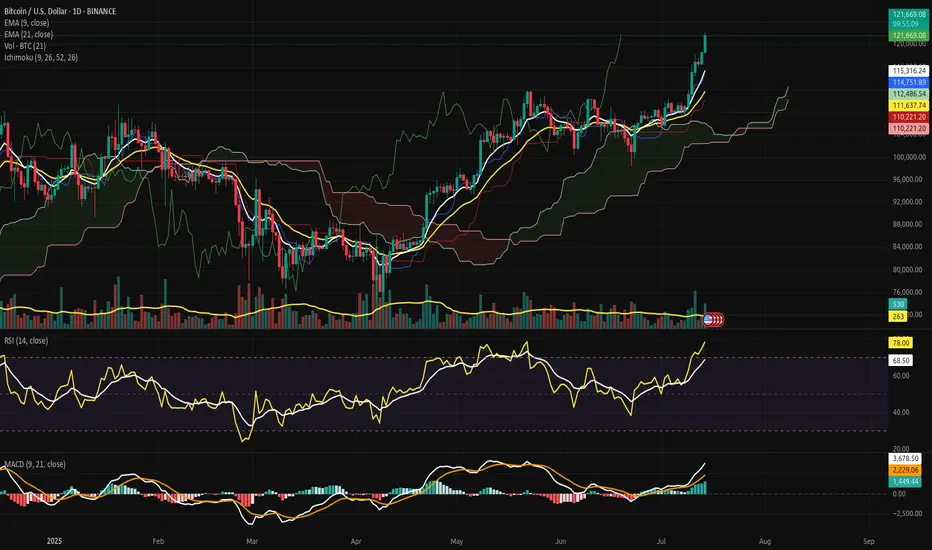
Bitcoin Strategic Breakout at the Threshold of Silence!⊣
⟁ BTC/USD - BINANCE - (CHART: 1D) - (Jul 09, 2025).
◇ Analysis Price: $110,767.80.
⊣
⨀ I. Temporal Axis - Strategic Interval - (1D):
▦ EMA9 - ($108,767.55):
∴ Price remains above the 9-day EMA, maintaining a short-term bullish posture;
∴ The moving average acts as dynamic support with positive slope.
✴️ Conclusion: Immediate trend remains intact, with momentum supported at $108,767.55.
⊢
▦ EMA21 - ($107,663.85):
∴ EMA21 acts as the structural support of the medium-term trend;
∴ Price maintains a healthy gap above it, confirming bullish continuity.
✴️ Conclusion: Structural integrity remains bullish - no threat of reversal below $107,663.85.
⊢
▦ Ichimoku Cloud - (Senkou A: $106,870.32 / Senkou B: $105,173.14):
∴ Price is clearly above the Kumo, with bullish Tenkan/Kijun alignment;
∴ Lagging Span (Chikou) is above both price and cloud - clean trend confirmation.
✴️ Conclusion: Primary trend remains bullish; cloud structure provides layered support between $106,800 and $105,100.
⊢
▦ RSI - ($61.33):
∴ RSI is rising, currently at 61.33, still below the overbought threshold;
∴ No divergence or bearish signal present; EMA9 of RSI is supportive at 56.94.
✴️ Conclusion: Momentum is healthy and climbing - room to extend toward the 70 level.
⊢
▦ MACD - (MACD Line: 251.71 / Signal Line: 836.26):
∴ Recent bullish crossover confirmed; histogram turning increasingly positive;
∴ MACD shows early-stage trend resumption with growing momentum.
✴️ Conclusion: Renewed bullish phase underway - MACD structure confirms sustained strength.
⊢
▦ Volume + EMA21 - (Current: 352.24 / MA: 244):
∴ Current daily volume significantly exceeds 21-day average;
∴ The breakout candle is technically validated by volume strength.
✴️ Conclusion: Real buying presence behind the move - not a hollow breakout.
⊢
🜎 Strategic Insight - Technical Oracle:
∴ All technical indicators are in alignment;
∴ Price is supported by volume, short-term EMA's, bullish Ichimoku structure, and clean RSI/MACD momentum;
∴ The price is approaching the (ATH - $111,317.37) and any confirmed close above it, backed by volume, could trigger a Fibonacci-based extension toward - ($115,000 / $117,300).
⊢
∫ II. On-Chain Intelligence - (Source: CryptoQuant):
▦ Exchange Inflow Total - (All Exchanges) - (13.4K Bitcoin):
∴ No abnormal spikes - inflows remain historically low.
✴️ Conclusion: Selling pressure is absent - no signs of miner or whale unloading.
⊢
▦ Exchange Reserve - (Binance) - (537.4K Bitcoin):
∴ Continuous outflow trend - reserves have declined sharply in recent weeks.
✴️ Conclusion: Structural supply contraction - classic hallmark of accumulation.
⊢
▦ Funding Rates - (All Exchanges)- (+0.006%):
∴ Slightly positive, well within neutral zone - no euphoria.
✴️ Conclusion: Leverage is present but controlled - not overheating.
⊢
▦ Open Interest - (All Exchanges) - (gradually increasing):
∴ OI rising gradually without abrupt spikes.
✴️ Conclusion: Positions are being built systematically - not impulsively.
⊢
🜎 Strategic Insight - On-Chain Oracle:
∴ The breakout is not driven by leverage, but rather by spot accumulation and institutional withdrawal;
∴ This environment mirrors previous (pre-expansion) phases (notably late 2020), when reserves declined and funding stayed flat;
∴ All vectors are aligned - a structurally sound rally is underway.
⊢
⧈ Codicillus Silentii - Strategic Note:
∴ The market exhibits complete silence beneath price - no inflows, no speculative buildup;
∴ Only those attuned to the deeper rhythm perceive the pressure building within this compressed structure;
∴ The Codex observes no disruptive anomalies; the energy is latent, not explosive - yet.
⊢
▦ Tactical Range Caution:
∴ Immediate Support: $108,767.55 - (EMA9);
∴ Structural Support: $107,663.85 - (EMA21);
∴ Previous ATH: $111,317.37;
∴ Breakout Extension Target: $115,000 - $117,300.
⊢
𓂀 Stoic-Structural Interpretation:
▦ Structurally Bullish - Tactically Confirming.
⊢
⧉
Cryptorvm Dominvs · ⚜️ MAGISTER ARCANVM ⚜️ · Vox Primordialis
⌬ - Wisdom begins in silence. Precision unfolds in strategy - ⌬
⧉
⊢
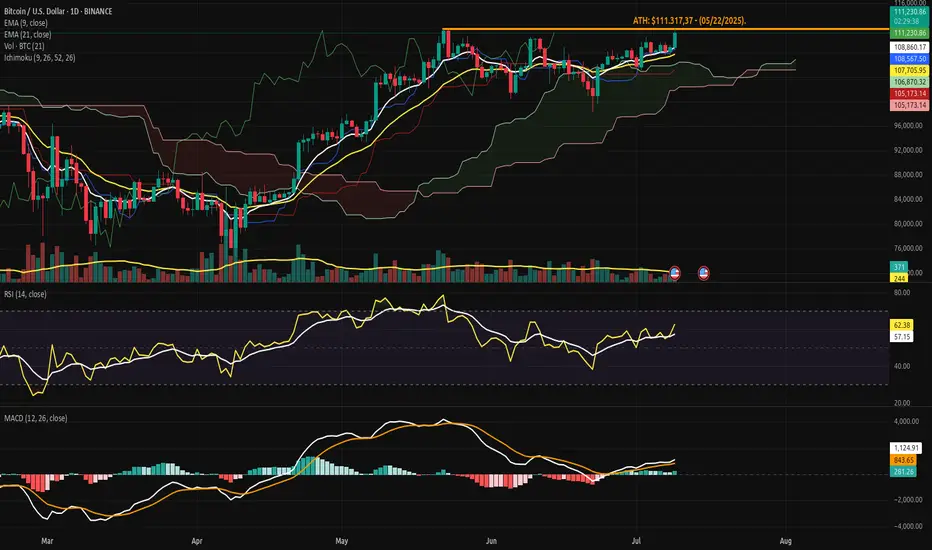
Bitcoin Between Strength and Suspension Tactical Inflow Anomaly.⊣
⟁ BTC/USD – BINANCE - (CHART: 1H) – (Jul 03, 2025).
◇ Analysis Price: $109,716.55.
⊣
⨀ I. Temporal Axis – Strategic Interval – (1H):
▦ EMA 9 – ($109,510.76):
∴ Price remains above EMA9, sustaining the short-term bullish impulse;
∴ The EMA 9 is ascending with consistent candle-body support across recent sessions.
✴ Conclusion: Tactical momentum persists as long as price holds above EMA9 on closing basis.
⊢
▦ EMA 21 – ($109,064.37):
∴ EMA 21 serves as dynamic support, unbroken since the July 2nd surge;
∴ Distance between EMA9 and EMA21 confirms preserved trend integrity.
✴ Conclusion: No structural weakness observed; trend foundation remains intact under current volatility.
⊢
▦ Volume – (Visual estimation, TradingView):
∴ Volume surged during July 2 rally; subsequent bars show diminishing interest;
∴ Last high-volume candle aligns with recent local top attempt.
✴ Conclusion: Buyer aggression is fading. Volume must return for any continuation to be credible.
⊢
▦ Bollinger Bands (20, 2.0) – (Upper: $110,050.15 / Lower: $108,545.25):
∴ Price recently tapped upper band and pulled back slightly without breakdown;
∴ Bands are widening after expansion, indicating active volatility but no climax.
✴ Conclusion: System operates in elevated volatility regime, with breakout potential still valid if supported.
⊢
▦ Price Action (66, 6, 5) – (Visual structure, local range):
∴ Price formed a clean higher low and higher high sequence starting July 2nd, confirming bullish microstructure;
∴ Current candles show upper wick formation at ~$110,050, indicating rejection and absorption at resistance.
✴ Conclusion: Uptrend structure is valid but approaching short-term exhaustion. If support holds at $109,100–108,900, continuation remains viable.
⊢
▦ RSI + EMA9 – (RSI: 62.69 / EMA: 63.27):
∴ RSI dipped below its own EMA9, indicating weakening strength in recent hours;
∴ RSI remains above 60, preserving bullish territory but signaling caution.
✴ Conclusion: Early-stage exhaustion detected. Zone of hesitation active.
⊢
▦ ATR (14, RMA) – (447.69):
∴ Average volatility is still elevated relative to June baseline;
∴ Slight decline in ATR may suggest slowing force behind directional moves.
✴ Conclusion: Tactical volatility is active but not expanding. Suitable for traps or distribution setups.
⊢
🜎 Strategic Insight – Technical Oracle:
∴ The structural setup holds a bullish bias with dynamic supports (EMA9/EMA21) intact;
∴ Bollinger expansion and RSI positioning signal a zone of heightened interest, but the fading volume and early RSI crossover inject caution;
∴ This is a tactically suspended state where continuation is possible but dependent on incoming confirmation volume.
⊢
⟁ II. ARCANVM SIGNAL - (Bitcoin Inflow +5,000):
∴ Current Hourly Inflow: 20,788.10 BTC;
∴ Structural Threshold (30EMA): ~3,200 BTC;
∴ Trigger Threshold: ≥ 5,000 BTC.
✴ Conclusion and Interpretation: This event constitutes a critical liquidity anomaly under the Silent Sentinel Protocol. While it does not inherently dictate trend direction, its magnitude-6.5x above the structural average-configures:
∴ A probable institutional move for redistribution or liquidity unlocking;
∴ Elevated risk for short-term distortion events, particularly across the H1–H4 timeframes;
∴ An urgent need to monitor subsequent Netflow, to confirm whether real outflow pressure follows.
⊢
∫ III. On-Chain Intelligence – (Source: CryptoQuant):
▦ Exchange Netflow Total - (All Exchanges):
∴ Current: +555 Bitcoin net inflow;
∴ The ARCANVM inflow (+20,788 Bitcoin) has not been fully absorbed or reversed.
✴ Conclusion: Some liquidity remains inside exchanges. Potential for redistribution or silent preparation.
⊢
▦ Exchange Reserve - (All Exchanges):
∴ Continuously declining; current: ~2.44M Bitcoin;
∴ The inflow did not shift the macro trend of reserve depletion.
✴ Conclusion: Structural scarcity preserved. Inflow likely tactical and non-systemic.
⊢
▦ Futures Perpetual Funding Rate 7D-SMA - (All Exchanges):
∴ Holding near 0.01% – neutral bias;
∴ No evidence of directional crowding in perpetuals.
✴ Conclusion: Perpetual markets in tactical balance. Spot-driven price action dominates.
⊢
🜎 Strategic Insight – On-Chain Oracle:
∴ Despite the aggressive ARCANVM signal, the absence of structural reversals in reserves and neutral derivatives positioning confirms the move is non-structural.
∴ Markets remain in equilibrium.
∴ No emergent directional force-just silent posture-shifting.
⊢
⧈ Codicillus Silentii – Strategic Note:
∴ This is a state of tactical ambiguity. Breakout or failure depends on external triggers, as neither volume nor derivatives offer decisive guidance.
∴ The structure listens, not speaks.
⊢
▦ Tactical Range Caution:
∴ Resistance Watch Level: $110,050;
∴ Tactical Support: $109,100;
∴ Structural Alert Level: $108,400.
⊢
𓂀 Stoic-Structural Interpretation:
∴ Structurally Bullish – Tactically Suspended;
⊢
⧉
⚜️ Magister Arcanvm – Vox Primordialis!
𓂀 Wisdom begins in silence. Precision unfolds in strategy.
⧉
⊢
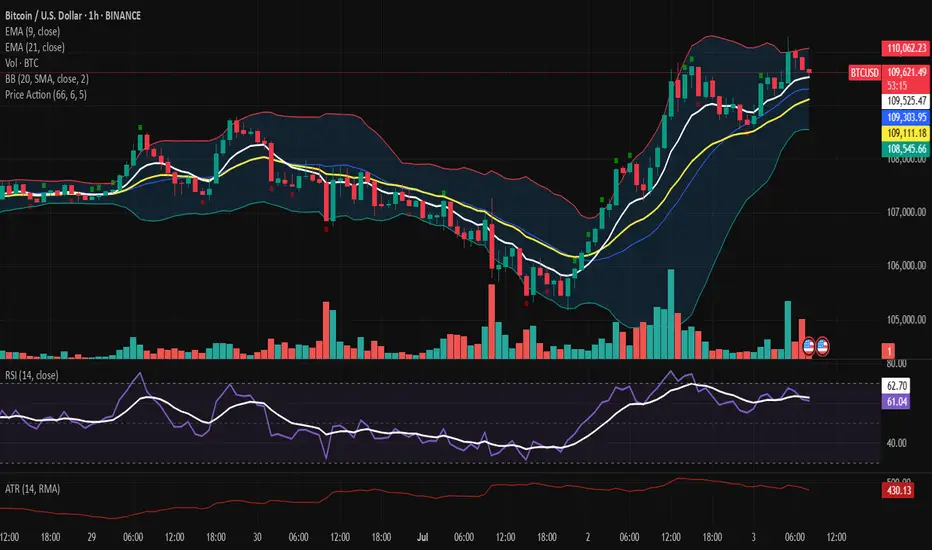
Bitcoin - The Silent Ascent of Under Institutional Custody.⊢
⟁ BTC/USD – BINANCE – (CHART: 1W) – (Date: July 01, 2025).
◇ Analysis Price: $106,464.00.
⊢
⨀ I. Temporal Axis – Strategic Interval – (1W):
▦ EMA21 – ($98,213.17):
∴ The EMA21 has provided dynamic mid-term support since early Q4 2024;
∴ Recent pullbacks respected the line precisely, confirming its role as tactical trend anchor.
✴ Conclusion: Tactical bullish posture maintained. Rejection above EMA21 signals controlled bullish continuation.
⊢
▦ Week Moving Average 200WMA – ($60,425.78):
∴ The 200WMA continues its upward ascent, now surpassing the symbolic $60k level;
∴ Price remains structurally elevated, approximately 76% above the WMA baseline, marking a strong long-term cycle support.
✴ Conclusion: Structurally bullish. The 200WMA acts as a deep support; no signs of cyclical exhaustion.
⊢
▦ Volume + MA21:
∴ Volume remains within normal bounds, with no explosive or capitulative behavior;
∴ The 21-week average volume shows steadiness, confirming institutional absorption rather than speculative frenzy.
✴ Conclusion: Price action is supported by consistent volume. There is conviction, not hype.
⊢
▦ RSI + EMA21 – (RSI: 61.01 | EMA: 60.00):
∴ RSI remains stable above the 60-threshold, traditionally a bull-control zone;
∴ The EMA21 on RSI sits just beneath it, reflecting sustainable momentum without overheating.
✴ Conclusion: Momentum is alive and consistent. Pressure is not euphoric, but persistently positive.
⊢
▦ Mayer Multiple – (1.11):
∴ The current Mayer Multiple (Price ÷ 200WMA) is at 1.11, far below critical cyclical warning zones;
∴ Historical peaks formed above 2.4–3.2×, placing current readings in neutral-to-accumulative territory.
✴ Conclusion: No signs of macro-top formation. Room for expansion remains open within cycle structure.
⊢
🜎 Strategic Insight – Technical Oracle:
∴ Bitcoin maintains an elevated stance above all major structural supports;
∴ No indicators suggest euphoric excess or terminal cycle behavior;
∴ Momentum, structure, and volume all reflect the essence of a mature but breathing bull cycle, silently advancing.
⊢
∫ II. On-Chain Intelligence – (Source: CryptoQuant):
▦ MVRV Ratio – (2.22):
∴ The current MVRV remains below the historical danger zone of >2.5;
∴ Price is elevated, but not euphoric - reflective of controlled structural ascent.
✴ Conclusion: BTC sits in the upper-middle band of valuation. No top formation indicated, but vigilance required.
⊢
▦ Exchange Reserve – (All Exchanges – 2.4M BTC (new low):
∴ Continuous decline in BTC held on exchanges since Q4 2022;
∴ Signals that coins are being withdrawn to self-custody – typical of conviction-based accumulation.
✴ Conclusion: Supply is drying from trading venues. This is fundamentally bullish and reduces short-term dump risk.
⊢
▦ Realized Cap – ($958B):
∴ The realized capitalization is climbing in tandem with price - without flattening or divergence;
∴ Indicates strong inflow of high-conviction capital setting new cost-bases.
✴ Conclusion: Market is absorbing price increases via real buyer interest. Structural support is being rebuilt at higher levels.
⊢
▦ Short-Term Holder Realized Price & Profit/Loss Margin:
∴ Profit margins are rising but remain beneath the historical 70% “euphoria line;”
∴ No extreme deviation between spot price and realized price.
✴ Conclusion: Profit-taking is occurring in equilibrium. No signs of unsustainable speculation.
⊢
▦ Spent Output Profit Ratio – (SOPR - 1.036):
∴ Values above 1 indicate net selling at a profit;
∴ However, the ratio is stable and modest – no spike.
✴ Conclusion: Profitable selling is active, but not excessive. Market is cycling profits without panic or climax.
⊢
▦ Stablecoin Supply Ratio - (SSR – 17.6):
∴ A high SSR means fewer stablecoins relative to BTC -> lower immediate buy-side liquidity;
∴ This aligns with observed euro-stablecoin inflows and USD retreat.
✴ Conclusion: Bitcoin price is rising without massive stablecoin inflow. Potential for future upside if SSR compresses.
⊢
🜎 Strategic Insight – On-Chain Oracle:
∴ All six indicators converge on a structurally bullish;
∴ Tactically stable market;
∴ There is no evidence of blow-off top, exhaustion, or manic distribution;
∴ Supply is retreating, valuation rising moderately, and profit cycles remain rational.
⊢
⧉ III. Contextvs Macro–Geopoliticvs – Interflux Economicvs:
▦ Macro-Structural Narrative:
∴ Bitcoin closed Q2 2025 with a +29.9% quarterly gain - (source: CryptoRank);
∴ The rally is attributed to growing institutional adoption, bolstered by pro-Bitcoin policies of the Trump administration, including treasury-on-chain initiatives;
∴ Macroeconomic tension around trade wars has eased, fueling upward movement in both BTC and the S&P 500, signaling synchronized risk-on appetite - (source: Coindesk).
✴ Conclusion: The quarterly momentum reflects fundamental confidence, not speculative heat, Bitcoin is tracking macro cycles and policy favorability - not detaching from economic logic.
⊢
▦ Liquidity Rotation Signal:
∴ While BTC saw a record monthly close above $106K in June, attention turned to the Euro, which surged ~4%, outperforming Bitcoin ~2.5% monthly gain - (source: Coindesk);
∴ This signals capital movement out of the USD and into alternative monetary zones, including euro-pegged stablecoins, highlighting a shift in liquidity strategy.
✴ Conclusion: Bitcoin performance remains strong, but stablecoin flows suggest hedging against USD, and potential cross-currency dynamics now influence crypto markets more than in past cycles.
⊢
▦ Institutional Absorption:
∴ Q2 2025 marked multiple treasury-scale Bitcoin purchases, the most notable was Strategy Inc.’s addition of $531 million in Bitcoin;
∴ Coindesk reports increasing movement of aged coins, suggesting long-term holders are realizing profit selectively, not exiting fully;
∴ Realized on-chain gains estimated around $2.4 billion, but SOPR and STH-P/L data show no speculative frenzy.
✴ Conclusion: Institutional reaccumulation is active - distribution is rational, not euphoric, the market is cycling profits, not dissolving conviction.
⊢
▦ Sentiment & Policy Alignment:
∴ Trump’s active endorsement of Bitcoin as a "strategic reserve instrument" has galvanized corporate treasuries and conservative capital;
∴ Policy signals from the U.S. now mirror early El Salvador-like rhetoric but on a scaled geopolitical stage;
∴ Meanwhile, legislative friction in the EU is softening, with euro-stablecoin flows confirming multi-jurisdictional bullish alignment.
✴ Conclusion: Bitcoin is evolving from speculative asset into a political-economic monetary instrument. Its adoption curve is now influenced by state-level policy vectors, not just market actors.
⊢
⧈ Synthesis – Silent Codex Verdict:
∴ Bitcoin’s Q2 expansion is rooted in structural convergence: (policy + macro easing + institutional inflows + on-chain discipline);
∴ The asset is not overheated, and continues to mature within a globalized, politically aware framework;
∴ The cycle breathes silently, with strength.
⊢
⌘ Codicillus Silentii – Strategic Note:
∴ Resistance remains near $110K–112K, region of monthly closure highs;
∴ EMA21 at $98K defines tactical floor - breach would signify shift in short-term conviction;
∴ SSR at 17.6 suggests temporary stablecoin dryness, delaying momentum ignition.
✴ Conclusion: Tactical posture is consolidative, awaiting macro or capital inflow catalyst.
Upside remains open, but not yet inevitable.
⊢
𓂀 Stoic-Structural Interpretation:
∴ Structurally Bullish – (Tactically Controlled);
∴ Bitcoin maintains long-term structural dominance, anchored above the 200WMA and supported by rising Realized Cap and exchange outflows;
∴ The RSI + EMA21 structure confirms active but non-euphoric momentum;
∴ MVRV at 2.22 and SOPR at 1.03 reflect profitable cycling, not late-stage irrationality;
∴ No blow-off volume or destabilizing divergence across timeframes.
✴ Conclusion: Bitcoin is in mid-cycle ascension, exhibiting maturity, discipline, and policy-aligned backing. The structural bullish thesis is intact.
⊢
⧉
⚜️ Magister Arcanvm – Vox Primordialis!
𓂀 Wisdom begins in silence. Precision unfolds in strategy.
⧉
⊢
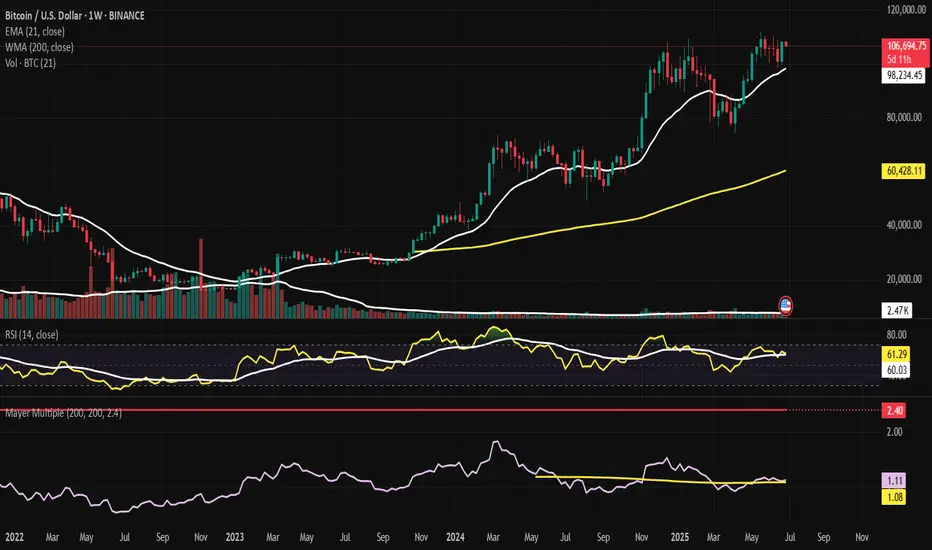
Bitcoin H1 Reversal – Codex Arcanvm + Tactical Breakdown.⊢
⟁ BTC/USD – BINANCE – (CHART: 1H) – (Date: Jun 30, 2025).
◇ Analysis Price: $107,599.99.
⊢
⨀ I. Temporal Axis – Strategic Interval – (1H):
▦ EMA 9 – ($107,799.64):
∴ The 9-period EMA remains above the current price, signaling downward rejection from short-term momentum line;
∴ It recently crossed below the EMA21, reinforcing a weakening of bullish impulse.
✴ Conclusion: EMA9 now acts as intraday resistance, confirming that immediate market strength has decayed and volatility expansion may continue unless reclaimed.
⊢
▦ EMA 21 – ($107,861.93):
∴ EMA21 is sharply curved downward, validating loss of directional conviction from the previous bullish run;
∴ This level aligns with a former consolidation zone, now potentially serving as a resistance pivot.
✴ Conclusion: EMA21 confirms a short-term trend break, and the inability to reclaim this line would prolong corrective action.
⊢
▦ EMA 50 – ($107,703.87):
∴ The EMA50 was breached decisively in the previous candle cluster, now positioned above price;
∴ Slope is turning neutral-to-down, reflecting a transition from trend to turbulence.
✴ Conclusion: EMA50 shift implies structural vulnerability in the intermediate frame, amplifying bearish tactical weight if no recovery emerges swiftly.
⊢
▦ SMA 100 – ($107,007.08):
∴ SMA100 is currently positioned just below price, offering momentary support in case of further weakness;
∴ Horizontal alignment indicates a pause or inflection zone, lacking directional strength.
✴ Conclusion: SMA100 is a neutral-bullish support shelf, but could flip to active resistance if breached intraday.
⊢
▦ SMA 200 – ($105,890.26):
∴ The SMA200 remains firmly upward-sloping and untouched — a sign of medium-trend resilience.
∴ It defines the lower structural boundary for this time-frame.
✴ Conclusion: SMA200 still holds bullish structural integrity, but if reached, it would represent a full reversion of recent strength.
⊢
▦ Volume + EMA 21 – (Current Vol: 5.31 BTC):
∴ Volume shows an uptick during bearish candle clusters — indicative of active sell-side participation;
∴ The EMA21 on volume reveals a rising slope, confirming that volatility is not passive, but driven by conviction.
✴ Conclusion: Volume action supports the thesis of deliberate distribution, not merely rotational choppiness.
⊢
▦ VWAP (Session) – ($107,995.35):
∴ Price has broken decisively below VWAP, showing institutional disengagement or absence of bid reinforcement;
∴ VWAP now serves as magnetic resistance during any mean-reversion attempts.
✴ Conclusion: VWAP position confirms that price is under fair-value, and current path is dominated by tactical sellers.
⊢
▦ Bollinger Bands – (Lower Band: $107,007.08):
∴ Bands have widened, with price hugging the lower edge - a hallmark of volatility expansion;
∴ Mean price ($107,895.00) sits significantly above spot, reinforcing downside pressure.
✴ Conclusion: BB's suggest momentum breakdown, with price entering statistically stretched, yet uncorrected territory.
⊢
▦ RSI + EMA 9 – (RSI: 87.06 | EMA: 92.92):
∴ RSI has sharply fallen from extreme overbought, but remains above the 70-level — reflecting ongoing exit from euphoric levels;
∴ The EMA over RSI is crossing below, signaling loss of short-term strength and potential trend reversal.
✴ Conclusion: RSI behavior implies a momentum peak has passed, though correction may still be in early phase.
⊢
▦ MACD – (MACD: 1.87 | Signal: -99.46 | Histogram: 101.33):
∴ MACD histogram turned sharply positive following a steep drop, suggesting a potential pause in bearish acceleration;
∴ Lines are converging but remain well below the zero axis - no bullish crossover yet.
✴ Conclusion: MACD reflects oversold relief, but not reversal. Current state favors tactical caution rather than confidence.
⊢
▦ ATR (14, RMA) – (315.31):
∴ ATR remains elevated, confirming ongoing high volatility and larger-than-average candle bodies;
∴ This level sustains a risk zone scenario, where price swings may be unpredictable.
✴ Conclusion: ATR indicates volatility expansion persists, further validating the need for defensive tactical posture.
⊢
🜎 Strategic Insight – Technical Oracle:
∴ The technical constellation on the 1H chart reveals a clear breakdown of short-term bullish structure, now transitioning into a tactically bearish phase;
∴ The rejection from VWAP and convergence of all EMA's above price confirm that any recovery must reclaim the 107.800–108.000 cluster to negate downside bias;
∴ The current support rests on SMA100, yet its flat orientation and proximity to price suggest fragility, not strength. Meanwhile, SMA200 at 105.890 represents a more significant structural floor - its breach would mark a deeper tactical deterioration;
∴ Volatility metrics (BB and ATR) indicate that the market is no longer coiled - it has entered expansion, and directional bias is momentarily controlled by sellers. RSI exiting overbought and MACD’s unresolved negative zone further support the thesis of ongoing correction, not mere pause;
✴ Conclusion: In essence, the market has shifted into a correctional pulse, guided by structural breakdowns and expanding volatility. Tactical recoveries remain possible, but fragile and likely limited unless EMA's are reclaimed with force.
⊢
∫ II. On-Chain Intelligence – (Source: CryptoQuant):
▦ Exchange Netflow Total – (All Exchanges) – (Last Recorded: +2.1K BTC):
∴ Recent spike in netflow reveals a sudden influx of Bitcoin into centralized exchanges, marking the first positive divergence after a long series of outflows;
∴ Such inflows historically precede tactical distribution events or profit-taking phases, especially following extended rallies.
✴ Conclusion: Netflow confirms that holders are actively preparing to sell, giving real on-chain weight to the price rejection seen on the 1H chart.
⊢
▦ Short-Term Holder SOPR – (Latest Value: 1.012):
∴ SOPR sits slightly above 1.0, but descending - indicating a transition from profit realization to potential break-even or loss selling;
∴ If the trend continues and dips below 1.0, it marks capitulation from recent buyers — often a trigger for volatility spikes or local bottoms.
✴ Conclusion: Current STH SOPR signals weakening conviction among short-term holders, supporting a corrective narrative rather than trend continuation.
⊢
🜎 Strategic Insight – On-Chain Oracle:
∴ The on-chain substrate aligns precisely with the tactical weakness shown in the chart. The positive exchange netflow acts as a material indicator of sell-side readiness;
∴ This inflow, breaking the historical trend of outflows, marks a shift in intent - from holding to liquidation;
∴ Simultaneously, the Short-Term Holder SOPR sits on a critical edge. Its descent toward the 1.0 threshold implies that recent buyers are either approaching breakeven or beginning to capitulate;
∴ This fragile posture typically amplifies local corrections, especially when coupled with rising volatility;
∴ On-chain momentum no longer supports bullish continuation. Instead, it reflects hesitation, rotation, and distribution - all hallmarks of a short-term correction phase, in alignment with the temporal analysis;
✴ Conclusion: The on-chain field confirms that the technical breakdown is not speculative - it is supported by active internal dynamics, signaling a pause or reversal in trend strength at a structural level.
⊢
⧈ Codicillus Silentii – Strategic Note:
∴ The current H1 formation is a textbook example of post-euphoric fragility. What appeared as steady accumulation has now transitioned into a volatile de-leveraging phase. The confluence of bearish momentum, increased volume, and netflow reversal suggests the market is entering a tactical contraction zone;
∴ No structural collapse is yet confirmed - but the absence of bullish defense at VWAP and EMA clusters denotes reduced resilience. Until these are reclaimed, all attempts at recovery must be viewed with caution.
✴ Conclusion: Silence in structure signals preparation - not passivity. The next move shall emerge not from noise, but from the void left by exhaustion.
⊢
𓂀 Stoic-Structural Interpretation:
∴ Structurally Bearish – Tactically Suspended ;
∴ The 1H chart shows a break below short-term momentum zones (EMA's, VWAP), confirming structural fragility;
∴ Despite momentary support on SMA100, the loss of upward slope across the EMA's and RSI reversal validate a structural bearish bias;
✴ Conclusion: Tactical direction remains suspended until one of two pivots is breached: either VWAP (~107.995) reclaimed, or SMA200 (~105.890) broken.
⊢
⧉
⚜️ Magister Arcanvm – Vox Primordialis!
𓂀 Wisdom begins in silence. Precision unfolds in strategy.
⧉
⊢
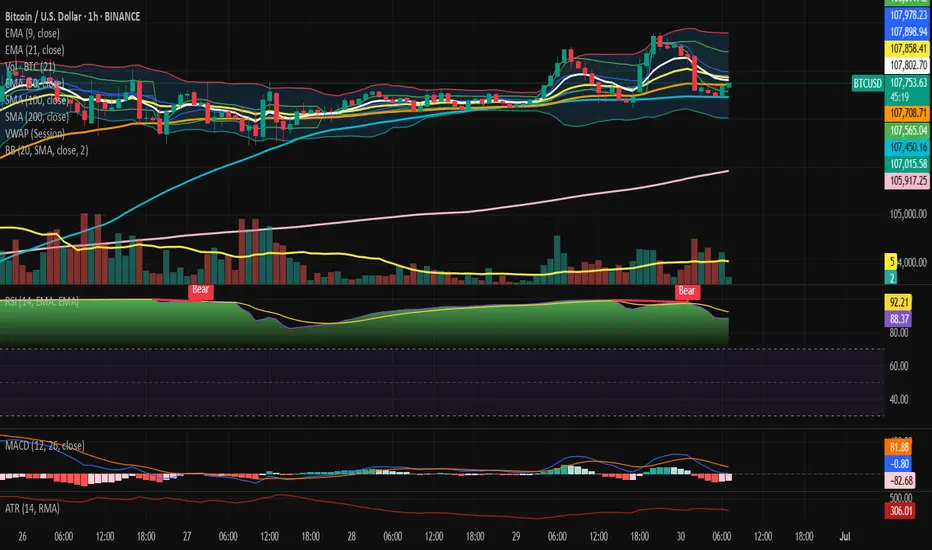
Bitcoin Structurally Momentum Bullish – On-Chain Confirmed.⊢
⟁ BTC/USD – BINANCE – (CHART: 4H) – (June 27, 2025).
⟐ Analysis Price: $106,840.15.
⊢
⨀ I. Temporal Axis – Strategic Interval – (4H):
▦ EMA(9) – ($107,126.95):
∴ Current price is slightly below the EMA(9), indicating the beginning of intraday buyer fatigue;
∴ EMA(9) still curves upward, sustaining the recent bullish momentum, but showing signs of deceleration.
✴️ Conclusion: Short-term strength is weakening; potential micro-shift in sentiment underway.
⊢
▦ EMA(21) – ($106,574.03):
∴ EMA(21) acts as immediate dynamic support, now closely tested;
∴ Still sloping upward, suggesting buyers are attempting to defend the structure.
✴️ Conclusion: Tactical support remains intact - this is the battlefield line.
⊢
▦ EMA(50) – ($105,651.25):
∴ Mid-range structure confirms trend stability as price remains well above the EMA(50);
∴ EMA(50) direction remains mildly bullish, reinforcing medium-term control by buyers.
✴️ Conclusion: Medium trend unshaken; pullbacks remain controlled within bullish context.
⊢
▦ EMA(200) – ($104,890.51):
∴ Long-term baseline remains untouched, with price notably above;
∴ The slope of EMA(200) is stable and slightly positive.
✴️ Conclusion: Structural bullish foundation remains intact. No long-term threat detected.
⊢
▦ Ichimoku Cloud (9/26/52/26):
∴ Price remains above the Kumo cloud; Tenkan and Kijun are aligned in bullish formation, though beginning to flatten;
∴ Chikou Span remains free and clear above historical price — no conflict.
✴️ Conclusion: Structure is still bullish, but compression in the cloud signals potential pause in directional conviction.
⊢
▦ Volume (BTC) + MA(21):
∴ Volume sits below its 21-period moving average, indicating waning buyer participation;
∴ No breakout or capitulation candle - sentiment is reserved.
✴️ Conclusion: Lack of conviction - volume confirms indecision and pause in impulse.
⊢
▦ RSI + EMA9 – (RSI: 54.78 / EMA9: 59.70):
∴ RSI curves downward from the upper-neutral zone - momentum is retreating;
∴ RSI has crossed below its EMA(9), which typically signals fading bullish strength.
✴️ Conclusion: Momentum has weakened - buyers are hesitating.
⊢
▦ Stoch RSI – (K: 9.72 / D: 10.22):
∴ Oscillator is deep in the oversold region, preparing a bullish cross;
∴ No confirmation of reversal yet - early signal.
✴️ Conclusion: Setup for potential rebound exists, but signal remains unconfirmed.
⊢
▦ MACD – (MACD: 725.17 / Signal: 883.72 / Histogram: –158.55):
∴ MACD histogram turns increasingly negative, suggesting decay in momentum;
∴ Though MACD line remains above signal, curvature favors a bearish crossover soon.
✴️ Conclusion: Momentum fading; risk of technical crossover if weakness persists.
⊢
▦ OBV – (71.13M):
∴ OBV is flat and shows no divergence, suggesting balanced pressure;
∴ Movement remains parallel to EMA21, confirming neutrality.
✴️ Conclusion: Volume flow is not supporting a continuation; neutral.
⊢
🜎 Strategic Insight – Technical Oracle:
∴The structure remains bullish at the macro and medium levels;
∴ As evidenced by EMA alignment and Ichimoku posture. However, momentum signals are fading, and the current 4H candle lacks conviction;
∴ A breakout requires stronger volume and RSI reacceleration - until then, the tactical stance is suspended.
⊢
∫ II. On-Chain Intelligence – (CryptoQuant):
▦ 1. Exchange Netflow Total – (All Exchanges):
∴ Current readings show net outflows dominating, indicating coins moving out of exchanges - typically interpreted as holding behavior and bullish bias;
∴ No recent spike in inflows that would suggest imminent selling pressure or dump risk.
✴️ Conclusion: Exchange behavior is structurally bullish - environment favors accumulation.
⊢
▦ 2. Exchange Stablecoins Ratio – (All Exchanges):
∴ The ratio remains low and stable, meaning high stablecoin reserves vs. Bitcoin on exchanges - suggesting potential buying power in standby;
∴ No spike in the ratio - no immediate conversion from stablecoins into Bitcoin.
✴️ Conclusion: Stablecoins on standby confirm latent demand - supportive for bullish continuity if triggered.
⊢
▦ 3. Funding Rates – (All Exchanges):
∴ Funding is positive but mild, indicating long interest, yet not overheated;
∴ No excessive leverage detected - absence of speculative imbalance.
✴️ Conclusion: Derivatives market supports a healthy uptrend with no signs of crowd euphoria.
⊢
▦ 4. Estimated Leverage Ratio – (All Exchanges):
∴ Leverage ratio remains within neutral bounds, not expanding aggressively;
∴ Suggests market is currently not dominated by overleveraged positions.
✴️ Conclusion: The structure is stable - no systemic risk from forced liquidations.
⊢
▦ 5. Taker Buy/Sell Ratio – (All Exchanges):
∴ The ratio is slightly above 1.0 - meaning more aggressive buying than selling, but without dominance;
∴ Reinforces sentiment of cautious buying, not yet euphoric.
✴️ Conclusion: Taker flow confirms moderate bullish sentiment, no reversal pressure.
⊢
🜎 Strategic Insight – On-Chain Oracle:
∴ On-chain metrics align with structural bullishness;
∴ Netflows, leverage, and taker activity all support continuation;
∴ Importantly, stablecoin ratios signal dry powder remains available, meaning the market holds the potential energy for further upside - if volume and technical confirmation align.
⊢
⧈ Codicillus Silentii Strategic Note:
∴ In the discipline of silence, one waits as price tests its dynamic zone. The wise act after structure, not inside uncertainty;
∴ The chain speaks in whispers. Smart liquidity waits. The structure is armed - but momentum requires ignition. Not fear, not hope - signal.
⊢
𓂀 Stoic-Structural Interpretation:
∴ Structurally Bullish - (Tactically Suspended);
∴ The core architecture remains intact, but the absence of volume and declining oscillators justify a suspended stance for entry;
∴ On-chain and chart-based structures are aligned in bullish posture, but technical indicators remain in a suspended tactical phase. Awaiting breakout or deeper pullback for positioning.
⊢
▦ Tactical Range Caution:
∴ Watch $106,574 (EMA21) and $105,651 (EMA50) for reactive buying;
∴ Below $104,890 (EMA200) - structure weakens;
∴ Upside breakout requires volume reclaim above $107,330;
∴ Resistance: $107,330 / $108,200.
⊢
⧉
⚜️ Magister Arcanvm (𝟙⟠) – Vox Primordialis!
𓂀 Wisdom begins in silence. Precision unfolds in strategy.
⧉
⊢
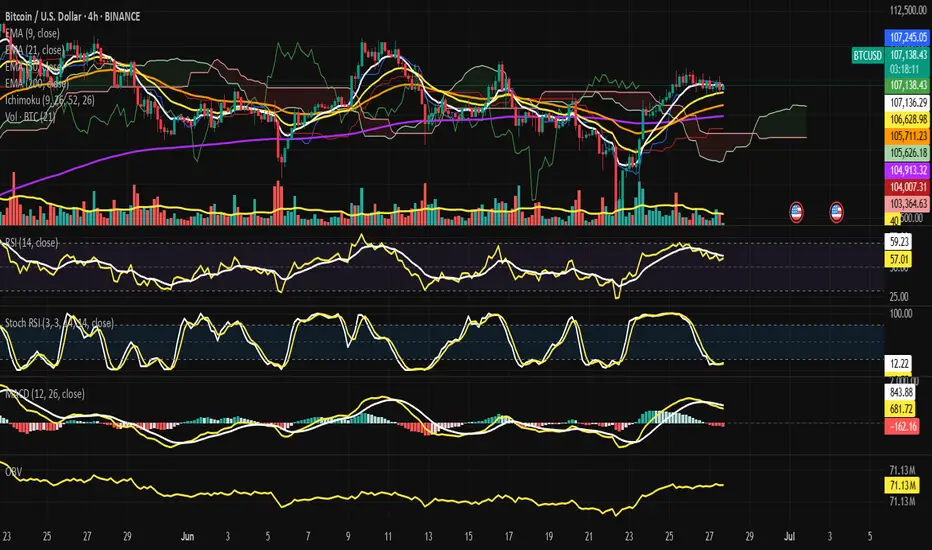
Bitcoin Strategic Risk Framework & Market Structure Assessment.⊢
⟁ BTC/USD – BINANCE – (CHART: 1D) – (Jun 25, 2025).
⟐ Analysis Price: $107,191.94.
⊢
⨀ I. Temporal Axis – Strategic Interval – (1D):
▦ EMA21 – ($105,207.93):
∴ Price has reclaimed EMA21 decisively after testing below;
∴ EMA21 maintains upward slope, indicating reactivation of short-term bullish sentiment;
∴ Dynamic support now resides at ~$105.2K.
✴️ Conclusion: EMA structure favors bullish continuation while price holds above.
⊢
▦ SMA200 – ($96,064.16):
∴ SMA200 remains strongly upward sloped, untouched since March 2024;
∴ Long-term momentum remains firmly bullish;
∴ No contact with SMA200 confirms macro support far below.
✴️ Conclusion: Structural support intact; macro uptrend fully confirmed.
⊢
▦ Ichimoku Cloud – ($103,065.53 / $104,456.43):
∴ Price positioned above Kumo; bullish structure remains intact;
∴ Kijun-sen ($104,456.43) and Tenkan-sen ($103,065.53) both flat, signaling short-term consolidation;
∴ Chikou Span approaches historical resistance zone; Span A and B flattening.
✴️ Conclusion: Bullish trend preserved, but lacking forward thrust; potential stagnation if breakout fails.
⊢
▦ Volume (MA21) – (~129 BTC):
∴ Current volume ~128.73 BTC, slightly under the moving average;
∴ No breakout volume confirmation despite recent price thrust;
∴ Weak volume expansion reduces reliability of short-term breakout.
✴️ Conclusion: Momentum requires validation through volume escalation.
⊢
▦ MACD – (-4.44 / 36.48 / -40.92):
∴ Histogram contracting upward, bearish momentum fading;
∴ MACD Line (-4.44) still below Signal Line (36.48);
∴ No confirmed bullish crossover, but compression phase active.
✴️ Conclusion: Latent bullish reversal potential; not yet validated.
⊢
▦ RSI – (55.95):
∴ RSI reclaimed level above 50, positioning in neutral-bullish zone;
∴ RSI MA at 48.78 confirms momentum shift;
∴ Positive slope suggests rising momentum, but lacks steepness.
✴️ Conclusion: Momentum entering constructive zone, still not impulsive.
⊢
🜎 Strategic Insight – Technical Oracle:
∴ Structure remains technically bullish with constrained momentum;
∴ Indicators are aligned toward continuation, yet breakout conviction is hindered by insufficient volume and pending oscillator confirmation;
∴ Short-term path is upward-biased, conditional on validation.
⊢
∫ II. On-Chain Intelligence – (Source: CryptoQuant):
▦ Exchange Netflow – (All Exchanges):
∴ Netflow remains negative on 7-day average;
∴ Sustained outflows indicate strategic accumulation or self-custody preference;
∴ No evidence of large-scale exchange inflows that signal distribution.
✴️ Conclusion: Net capital migration continues favoring off-exchange security; bullish underlying tone.
⊢
▦ Stablecoin Supply Ratio (SSR):
∴ SSR near 17.5 indicates relatively low stablecoin dominance;
∴ Reduced buying power vs Bitcoin implies cooling short-term demand;
∴ Historically elevated SSR levels precede price consolidations or local tops.
✴️ Conclusion: Stablecoin reserves insufficient for sustained upward pressure; caution warranted.
⊢
▦ Exchange Whale Ratio – (All Exchanges):
∴ Whale Ratio near 0.59 denotes moderate large-holder activity;
∴ Ratio not in critical zone (>0.7), yet above accumulation range (<0.4);
∴ Potential soft distribution behavior if ratio trends upward.
✴️ Conclusion: Mixed signal - no panic, but latent whale presence requires monitoring.
⊢
▦ Miner Reserve:
∴ Miner balances steadily declining over past 30 days;
∴ Consistent outflows suggest controlled selling behavior;
∴ No aggressive miner dumping detected.
✴️ Conclusion: Miner pressure exists but remains tactical and non-destructive.
⊢
▦ Long-Term Holder SOPR (LTH-SOPR):
∴ Metric above 1.0 indicates long-term holders are in profit and realizing gains;
∴ No sharp spike detected, suggesting rational distribution;
∴ Structure consistent with healthy bull cycle mechanics.
✴️ Conclusion: Profit-taking underway in equilibrium; not a signal of panic.
⊢
▦ Funding Rate – (Futures):
∴ Funding mildly positive (~0.002–0.004%), reflecting long positioning bias;
∴ Rates remain low, indicating lack of overcrowded trades;
∴ No sign of speculative overheating in derivatives.
✴️ Conclusion: Derivatives sentiment is constructive, not euphoric; room for further upside exists.
⊢
🜎 Strategic Insight – On-Chain Oracle:
∴ On-chain metrics reflect a stable yet cautious accumulation phase;
∴ Absence of sell pressure, tempered long-term holder realization, and moderate derivative sentiment suggest foundation for continuation, albeit with reduced immediate force;
∴ Confirmation must align with price and volume.
⊢
⧉ III. Contextvs Macro–Geopoliticvs – Interflux Economicvs:
▦ Geopolitical Axis – Middle East Ceasefire:
∴ Ceasefire between Israel and Iran eased global tension, triggering flight from commodities into risk assets;
∴ Brent crude declined over -2.5% following truce reports, reducing inflationary pressure;
∴ However, geopolitical fragility remains - peace is provisional, not structural;
✴️ Conclusion: Tactical relief observed; no systemic safety guaranteed.
⊢
▦ Monetary Policy – US Federal Reserve Outlook:
∴ Jerome Powell signals continued rate hold, citing sticky inflation and fragile global equilibrium;
∴ Futures markets price ~20% chance of July cut, ~60% for September;
∴ Bond yields retreating (2Y at ~3.78%), suggesting easing expectations embedded;
✴️ Conclusion: Macro liquidity conditions marginally favorable to crypto; policy risk remains asymmetric.
⊢
▦ Equities & Global Sentiment – Dow Jones / Nasdaq Futures:
∴ Dow Futures flat (~+0.02%), Nasdaq Futures rise on tech optimism;
∴ Equity markets supported by decline in oil, stabilization in rates, and AI-sector inflows;
∴ No VIX spike – volatility subdued;
✴️ Conclusion: Macro-risk appetite firming up, enhancing crypto’s speculative appeal.
⊢
▦ Derivatives Behavior & Institutional Flow:
∴ Option markets show accumulation of BTC calls at 108K–112K strike zones;
∴ Futures funding positive but low, consistent with healthy long-side conviction;
∴ No structural imbalance detected;
✴️ Conclusion: Derivatives support scenario of moderate bullishness without speculative overreach.
⊢
⌘ Codicillus Silentii – Strategic Note:
∴ Temporal architecture remains bullishly aligned, but lacks velocity – movement is present without ignition;
∴ On-chain metrics reveal quiet distribution among long-term holders, yet without aggressive miner displacement or exchange flooding;
∴ Market tension is suspended in a state of equilibrium – neither contraction nor breakout assert dominion;
∴ The asymmetry of opportunity lies dormant, awaiting conviction in participation and volume.
⊢
𓂀 Stoic-Structural Interpretation:
▦ Structurally Bullish – Tactically Suspended:
∴ Price structure above EMA21 and SMA200 confirms preservation of macro uptrend – foundation remains unbroken;
∴ Miner reserve reduction and stable LTH-SOPR suggest controlled realization, not structural weakness;
∴ However, Ichimoku flattening and low volume expansion indicate stalling momentum, lacking breakout substance.
⊢
▦ Tactical Range Caution:
∴ Whale Ratio mid-levels and SSR elevation highlight proximity to potential resistance exhaustion;
∴ MACD crossover remains unconfirmed; RSI enters constructive zone without strength – reactionary rather than initiative-based;
∴ Until volume and oscillator confirmation emerge above $108.2K, posture remains protective and selective.
⊢
⧉
⚜️ Magister Arcanvm (𝟙⟠) – Vox Primordialis!
𓂀 Wisdom begins in silence. Precision unfolds in strategy.
⧉
⊢

Bitcoin Under Resistance: Neutral Core, Bearish Pressure.⊢
⟁ BTC/USD – BINANCE – (CHART: 4H) – (Date: June 22, 2025).
⟐ Analysis Price: $103,041.65.
⊢
⨀ I. Temporal Axis – Strategic Interval – (H4):
▦ EMA21 – (Exponential Moving Average 21-Period) – ($103,957.85):
∴ The current price is below the 21EMA, signaling weakness in short-term momentum;
∴ The slope of the moving average is negative, reflecting ongoing downward pressure;
∴ Recent attempts to reclaim the level were rejected, reinforcing its role as dynamic resistance.
✴️ Conclusion: The 21EMA acts as an active intraday resistance, and its breakout is a primary condition for any directional shift.
⊢
▦ EMA50 – (Exponential Moving Average 50-Period) – ($104,101.19):
∴ The 50 EMA remains above the price and the 21EMA, confirming a bearish trend alignment over the mid-term;
∴ The widening gap between EMA's suggests a well-established downward trend;
∴ A reclaim of both EMAs is required to revalidate bullish structure.
✴️ Conclusion: The 50EMA stands as a structural mid-term resistance, whose breakout would mark a tactical trend reversal.
⊢
▦ VPVR – (Volume Profile Visible Range) - (75, Up/Down):
∴ The POC (Point of Control) is concentrated around the $104,000 – $105,000 zone, just above the current price;
∴ This region reflects the highest volume concentration and tends to act as passive resistance or a redistribution zone;
∴ There’s a visible volume gap between $100,000 and $102,000, creating vulnerability to rapid price moves.
✴️ Conclusion: Price remains below institutional interest concentration, limiting upside potential unless volume reclaims the POC zone.
⊢
▦ BB – (Bollinger Bands - 20-Period SMA, 2.0 StdDev):
∴ The previous candle tapped the lower band and triggered a technical buy reaction (mean reversion);
∴ The mid-band aligns precisely with the 50 EMA (~$104,100), reinforcing confluence resistance;
∴ The channel shows slight downward expansion, suggesting volatility may continue to favor bears.
✴️ Conclusion: The recent bounce is technical relief; there is no structural reversal unless the price reclaims the mid-band.
⊢
▦ RSI – (Relative Strength Index) – (41.76):
∴ RSI is recovering from oversold territory but remains below the neutral 50 mark;
∴ The absence of a clear bullish divergence with price weakens the reversal thesis;
∴ RSI resistance lines sit between 45 and 50 – key levels that must be breached to confirm relief.
✴️ Conclusion: RSI signals technical relief, but still operates within a bearish zone — no clear evidence of dominant buying force yet.
⊢
▦ MACD – (Moving Average Convergence Divergence) – (MACD: –135.56 | Signal: –539.84):
∴ MACD line is crossing the signal line from below, generating an early bullish reversal signal;
∴ The histogram is contracting on the negative side, showing seller exhaustion;
∴ Readings remain deep in negative territory, requiring further confirmation.
✴️ Conclusion: MACD hints at momentum reversal, though structural validation requires a return to the positive zone.
⊢
▦ VOL – (Volume Bars):
∴ Volume increased significantly during the recent bounce, indicating reactive buyer demand;
∴ However, follow-through volume was not sustained — warning of potential bull trap;
∴ The absence of consistent volume undermines the durability of the bounce.
✴️ Conclusion: Volume shows reactive presence, but lacks sustained confirmation — recovery may be short-lived.
⊢
🜎 Strategic Insight – Technical Oracle:
∴ Bitcoin on the 4H chart is staging a relief move after recent sell-side pressure, yet remains below all key EMAs, under volume-based resistance, and without confirmation from momentum indicators.
∴ The structure is best defined as technical relief, not a confirmed trend reversal.
⊢
∫ II. On-Chain Intelligence – (Source: CryptoQuant & BGeometrics):
▦ Exchange Inflow Total - (All Exchanges) = (Latest Spike Zone ~103K):
∴ A recent uptick in Bitcoin inflows to exchanges is visible at local price levels, aligning with prior rejection zones;
∴ Increased inflows suggest potential intent to distribute, especially at resistance;
∴ Historically, such inflow patterns precede local price weakness or continuation of retracement.
✴️ Conclusion: Exchange inflow data warns of potential short-term sell pressure, supporting a cautious outlook near current levels.
⊢
▦ Funding Rate – (Binance Perpetual) – (Near Neutral to Slightly Positive):
∴ Current funding rates remain slightly positive but balanced, reflecting lack of directional conviction from leveraged traders;
∴ The absence of aggressive long bias reduces the risk of long squeezes but also suggests weak bullish momentum;
∴ Historically, neutral funding rates precede volatile expansions when followed by imbalances.
✴️ Conclusion: Funding rate indicates a neutral sentiment posture - not bearish, but lacking speculative bullish fuel.
⊢
▦ Open Interest – (All Exchanges) – (~$33.2B):
∴ Open Interest is elevated, marking one of the highest levels since April;
∴ The price is falling while OI remains high - a classic divergence signaling potential liquidation risk;
∴ This setup increases volatility probability and indicates the market is loaded with directional exposure.
✴️ Conclusion: Open Interest suggests a high-risk environment; either a cascade of liquidation or a sharp reversal is imminent.
⊢
▦ Realized Price – (Market: $103K | Realized: ~$47.5K):
∴ The gap between market price and realized price is vast, reflecting that most market participants are sitting on large unrealized gains;
∴ This positioning exposes the market to profit-taking impulses;
∴ The lack of compression between these metrics implies no capitulation is underway.
✴️ Conclusion: Market remains well above realized cost basis, implying latent sell-side risk and no evidence of fear-driven exits.
⊢
▦ UTXO Age Bands – (Realized Price by Age = 6m–3y clusters above $90K):
∴ Long-term holders (6m–3y) maintain positions well in profit, with realized values near or above $90K;
∴ No major movement from these cohorts detected — suggesting continued conviction or strategic dormancy;
∴ Younger UTXO bands are positioned lower, indicating recent accumulation remains underwater.
✴️ Conclusion: No signs of distribution from experienced holders — current structure favors hodler passivity, not capitulation.
⊢
▦ Miner Outflows – (Miner Transfer Volume Stable):
∴ Miner outflows remain stable, with no sharp spikes in transfers to exchanges;
∴ Implies no immediate operational selling pressure from mining entities;
∴ Miner behavior remains conservative, awaiting directional confirmation.
✴️ Conclusion: Miners are currently not a source of sell pressure, reinforcing structural equilibrium in supply flow.
⊢
🜎 Strategic Insight – On-Chain Oracle:
∴ The on-chain structure supports a technically vulnerable, yet fundamentally intact market; ∴ ∴ Exchange inflows and high Open Interest signal short-term caution, while the lack of miner selling, stable long-term holder behavior, and distance from realized price all point to no deep structural breakdown;
∴ Expect heightened volatility with directional resolution dependent on external catalysts or spot-driven pressure.
⊢
⌘ Codicillus Silentii – Strategic Note:
∴ Temporal framework reveals local reactive strength, but lacks structural realignment;
∴ On-chain flow warns of directional tension - neither resolve nor breakdown confirmed;
∴ Macro environment holds liquidity in suspension, awaiting a trigger;
∴ All vectors align under strategic ambiguity - stillness is not stasis, but anticipation.
⊢
𓂀 Stoic-Structural Interpretation:
▦ Structurally Neutral:
∴ The broader structure is intact - no systemic breakdown, yet no resumption of trend authority;
∴ Exchange inflows and high OI generate latent fragility, despite holder and miner resilience;
∴ The system holds - but without forward thrust, the architecture is stable, not ascendant.
⊢
▦ Tactically Cautious:
∴ Technical signals show reaction, not reversal - EMA's remain unbroken, volume is passive, RSI is capped;
∴ On-chain risk (inflows, OI) outpaces confirmation of strength;
∴ Action without structure is speculation - the trader must remain coiled, not extended.
⊢
⧉
⚜️ Magister Arcanvm (𝟙⟠) – Vox Primordialis!
𓂀 Wisdom begins in silence. Precision unfolds in strategy.
⧉
⊢

Bitcoin – Ritual Latency & Tactical Tension.⊢
⟁ BTC/USD – Binance – (CHART: 1H) – (June 21, 2025).
⟐ Analysis Price: $103,909.52.
⊢
⨀ I. Temporal Axis – Strategic Interval – (H1):
▦ EMA9 – ($103,783.82):
∴ The price oscillates around EMA9 with marginal bullish slope;
∴ Two candle rejections confirmed the EMA9 as a reactive short-term axis;
∴ Current close is above, but lacking directional follow-through.
✴️ Conclusion: Momentum attempt, yet unsupported – fragility persists.
⊢
▦ EMA21 – ($103,869.74):
∴ Flattened trajectory overlapping EMA9;
∴ Indicates tactical compression – a latency band rather than trendline;
∴ No breakout confirmation.
✴️ Conclusion: Equilibrium zone – direction undecided.
⊢
▦ EMA50 – ($104,212.18):
∴ Serves as immediate dynamic resistance;
∴ Price has not closed above since June 20, 13:00 UTC;
∴ Requires sustained move to invalidate micro-downtrend.
✴️ Conclusion: Key reversal barrier – price remains below structural trigger.
⊢
▦ SMA100 – ($104,552.65):
∴ Downsloping, acting as mid-term ceiling;
∴ No candle engagement in recent sessions;
∴ Confluence zone with EMA50 adds density.
✴️ Conclusion: Inertial resistance zone – trend continuity until breach.
⊢
▦ SMA200 – ($105,197.18):
∴ Highest structural ceiling on H1;
∴ Remains untouched, reinforcing broader tactical bearish bias.
✴️ Conclusion: SMA200 maintains bearish structure – trend remains capped.
⊢
▦ Bollinger Bands - (20,2):
∴ Bands tightened – low volatility configuration;
∴ Upper band slightly expands – minor opening signal;
∴ Price contacts upper range without strength.
✴️ Conclusion: Potential breakout pattern – requires volume ignition.
⊢
▦ RSI (14, smoothed by EMA9) – (11.00 | Avg: 13.85):
∴ RSI at historical low – indicative of exhaustion rather than momentum;
∴ EMA of RSI confirms suppressed structure;
∴ Hidden divergence plausible but not confirmed.
✴️ Conclusion: Latent reversal conditions – needs confirmation from RSI reclaim.
⊢
▦ MACD (12,26,9) – (MACD: 88.35 | Signal: -159.25 | Histogram: -247.60):
∴ Histogram remains negative but is narrowing;
∴ MACD line curling upward, approaching signal;
∴ No crossover yet – early recovery signal under surveillance.
✴️ Conclusion: Bullish divergence forming – reversal not validated.
⊢
▦ ATR (14, RMA) – (372.44):
∴ Volatility decreasing after a local spike;
∴ Range-bound structure indicates compression, not impulse.
✴️ Conclusion: Tactical latency – volatility may reawaken post-volume.
⊢
▦ Volume (21):
∴ Faint increase in last bullish candle – still below strategic threshold;
∴ Lacks institutional confirmation.
✴️ Conclusion: Spot activity insufficient – neutral, vulnerable structure.
⊢
🜎 Strategic Insight – Technical Oracle:
∴ H1 presents structural compression between EMA9/21/50, confirming tactical latency;
∴ RSI at deep oversold – signal of exhaustion, not yet momentum;
∴ Bollinger and MACD show early signs of kinetic preparation;
∴ The market is postured, not reactive – awaiting a directional event.
✴️ Tactical View: Structurally Neutral – Momentum Suspended, entry only upon RSI/Volume confirmation and MACD validation.
⊢
∫ II. On-Chain Intelligence – (Source: CryptoQuant):
∴ Update as of June 21, 2025 – Synchronized to H1 Structural Reading.
▦ Exchange Netflow Total – (All Exchanges) – (+692 BTC):
∴ Positive net inflow detected over 24h;
∴ Suggests moderate sell-side liquidity entering exchanges;
∴ Reflects defensive posturing, not panic-driven behavior.
✴️ Conclusion: Mild bearish pressure – not sufficient to invalidate structural base.
⊢
▦ Spot Taker CVD - (Cumulative Volume Delta, 90-day):
∴ Dominance of Taker Sell Volume confirmed – aggressive sellers remain in control;
∴ Pattern consistent over the last 6 sessions;
∴ No divergence between volume behavior and price structure.
✴️ Conclusion: Market remains tactically sell-biased – momentum driven by taker aggression.
⊢
▦ Spent Output Profit Ratio (SOPR) – (1.009):
∴ Marginally above 1.00 – coins being spent in mild profit;
∴ Absence of capitulation, but also no sign of deep conviction among holders;
∴ Stable rotation, not breakout-driven.
✴️ Conclusion: Structural neutrality – market is churning without direction.
⊢
▦ Adjusted SOPR (aSOPR) – (≈1.00):
∴ Flat – confirms lack of distribution or panic;
∴ Historically aligns with consolidation regimes.
✴️ Conclusion: Supply behavior is balanced – trend-neutral reading.
⊢
▦ Open Interest – All Exchanges – ($34.01B):
∴ Remains elevated – indicative of speculative leverage;
∴ Elevated risk of liquidation cascade on directional volatility;
∴ OI rising faster than spot volume = synthetic exposure dominating.
✴️ Conclusion: Market structurally exposed – fragile to external triggers.
⊢
▦ Funding Rate – All Exchanges – (-0.003):
∴ Slightly negative – shorts funding longs;
∴ Suggests bearish bias among leveraged participants;
∴ Conditions ripe for short squeeze if spot demand increases.
✴️ Conclusion: Contrarian setup building – tactical upside risk exists.
⊢
🜎 Strategic Insight – On-Chain Oracle:
∴ Metrics reflect a market under cautious speculative tension;
∴ No broad liquidation, no long-term holder exit – base intact;
∴ Taker dominance and leverage build-up suggest reactive positioning;
∴ System is neutral-leaning fragile – vulnerable to both triggers and traps.
✴️ Tactical Note: "Structurally Stable – Tactically Unsettled"
⊢
⧉ III. Contextvs Macro–Geopoliticvs – Interflux Economicus:
∴ Macro Landscape Reference – June 21, 2025.
▦ United States – Federal Policy & Risk Layer:
∴ Treasury Yield Curve remains slightly positive (+0.44%), removing short-term recession signal;
∴ 10Y yield elevated at 4.42% – reflects sustained inflation resistance and risk demand;
∴ Fed maintains QT stance – no rate cuts expected before September;
∴ Tension with Iran intensifying – military rhetoric entering fiscal discourse.
✴️ Conclusion: U.S. macro acts as compression catalyst – neutral on surface, volatile underneath.
⊢
▦ Strategic Bitcoin Reserve – (Executive Order – Trump):
∴ Recent Executive Order establishes BTC as sovereign asset class;
∴ Adds policy-level legitimacy to institutional accumulation;
∴ Reflects shift from “hedge” to “strategic reserve logic”.
✴️ Conclusion: Structural bull signal – narrative transition confirmed.
⊢
▦ China – Internal Stimulus & Soft Deflation:
∴ PPI negative at -3.3%, Retail Sales up 6.4% – stimulus-driven divergence;
∴ Fiscal revenue declining YTD – systemic drag despite easing;
∴ Not a current volatility driver.
✴️ Conclusion: China is neutral to crypto – reactive, not directive.
⊢
▦ European Union – Disinflation & Monetary Drift:
∴ HICP falls to 1.9%, ECB cuts deposit rate to 2.00%;
∴ PMI Composite < 50 – economic contraction quietly progressing;
∴ Forward guidance hesitant.
✴️ Conclusion: EU remains marginal – supportive for risk, but not catalytic.
⊢
▦ Global Fragmentation & SWIFT Erosion:
∴ Geopolitical blocs continue diverging – dollar-reliant systems weakening;
∴ Bitcoin seen increasingly as transactional hedge in sanctioned environments;
∴ De-dollarization dynamic accelerating.
✴️ Conclusion: Bitcoin positioned as neutral monetary rail – volatility shield and escape valve.
⊢
🜎 Strategic Insight – Interflux Macro Oracle:
∴ U.S. remains the dominant macro variable – its monetary and geopolitical stance defines volatility posture;
∴ Bitcoin structurally benefits from institutional legitimacy, but tactically suspended by risk-off layers;
∴ The system is internally calm, externally tense – volatility is downstream of Powell and geopolitical shock.
⊢
⌘ Codicillus Silentii – Strategic Note:
∴ Temporal structure remains compressed, yet technically reactive;
∴ On-chain behavior supports latent structural integrity, but reveals synthetic tension;
∴ Macro axis introduces dual asymmetry – stability in policy, instability in conflict;
∴ The system is in latency – not due to certainty, but due to mutual hesitation.
⊢
𓂀 Stoic-Structural Interpretation:
▦ Structurally Bullish.
∴ The underlying structure - long-term moving averages, exchange reserves, macro narrative, and holder behavior - remains intact and upward-biased;
∴ There is no technical breakdown or structural disassembly;
∴ It is the silent foundation - the “floor” of the chart remains elevated.
⊢
▦ Tactically Suspended.
∴ Although the structure points to strength, the present moment neither demands nor validates action;
∴ There is no volume, no ignition signal, no confirmation flow;
∴ Thus, the tactic is suspended - the trader (or observer) is in a disciplined state of observation, not execution.
⊢
⧉
⚜️ Magister Arcanvm (𝟙⟠) – Vox Primordialis!
𓂀 Wisdom begins in silence. Precision unfolds in strategy.
⧉
⊢
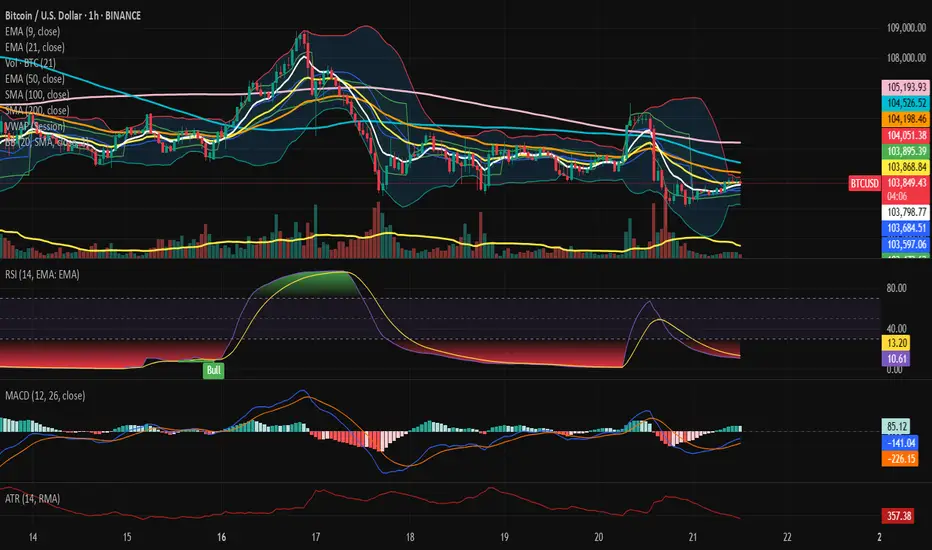
Bitcoin Strategic Compression, ETF Inflows and Powell’s Shadow.⊢
⟁ BTC/USD - Binance - (CHART: 12H) - (June 17, 2025).
⟐ Analysis Price: $105,324.51.
⊢
⨀ I. Temporal Axis – Strategic Interval – (12H):
▦ EMA13 – ($106,094.47):
∴ The arcane speed line was briefly reclaimed but lost again in the latest candle close;
∴ Price has consistently failed to close above EMA13 since June 13th, indicating weakening momentum;
∴ It now acts as primary dynamic resistance in the 12H structure.
✴️ Conclusion: EMA13 has been rejected. Bearish pressure remains in control.
⊢
▦ EMA44 – ($105,907.07):
∴ Price is currently below EMA44, though recent candles show no strong bearish conviction;
∴ This level functions as a neutral battleground - a true trend emerges only with decisive close above or below;
∴ The slope remains positive, preventing immediate breakdown.
✴️ Conclusion: EMA44 is the structural balance line. Below it, weakness persists.
⊢
▦ VWAP (Session) – ($106,117.67):
∴ VWAP sits above current price, reflecting rejection of institutional value;
∴ All recent attempts to reclaim VWAP failed, signaling lack of dominant buy-side volume;
∴ Confluence with EMA13 and Donchian upper band creates a unified technical ceiling.
✴️ Conclusion: Institutional control remains absent. Value zone denied.
⊢
▦ Donchian Channel (20) – ($106,690.95 / $102,854.49):
∴ Bands remain narrow, and price consolidates between mid-channel and the lower range;
∴ Upper band has been precisely respected for multiple sessions;
∴ This signals imminent volatility release from compression.
✴️ Conclusion: Volatility is fully compressed. Expansion is near.
⊢
▦ Volume - (MA20: 154):
∴ Volume remains below the 20-period moving average;
∴ No strong buying or selling pressure confirms indecision;
∴ Market stands in strategic silence.
✴️ Conclusion: Low activity zone. Observation mode prevails.
⊢
▦ Stoch RSI (3,3,14,14) – (21.38 / 27.27):
∴ Oscillator is crossing upward from oversold, but with weak momentum;
∴ Attempt to recover above 40 still incomplete;
∴ Risk of fakeout unless next candle confirms with bullish volume.
✴️ Conclusion: Reversal signal is weak. Watch for trap conditions.
⊢
▦ MFI (14) – (31.86):
∴ Money flow index stays in low liquidity zone - no signs of accumulation from large players;
∴ No clear bullish divergence, yet no panic selloff either;
∴ The flat trajectory since June 10 confirms institutional disengagement.
✴️ Conclusion: Capital remains cautious. No inflow to trigger reversal.
⊢
🜎 Strategic Insight — Technical Oracle:
∴ Indicators show compression, rejection at $106K and lack of institutional momentum;
∴ Price structure is neutral-bearish with volume confirming indecision;
∴ A breakout would only be valid with strong candle body and +180 BTC/12H volume.
✴️ Conclusion: Tactical patience advised. Await true breakout with confirmation.
⊢
∫ III. On-Chain Intelligence – (Source: CryptoQuant):
▦ Exchange Inflow Total – (All Exchanges):
∴ Total BTC inflows remain below 10K/day, well beneath panic thresholds;
∴ No spikes above 50K BTC since early April - aligns with neutral market conditions;
∴ This reflects dormant whale behavior and no visible distribution phase.
✴️ Conclusion: The market is in structural silence. No signs of capitulation.
⊢
▦ Exchange Inflow Mean = (MA7) – (All Exchanges):
∴ The 7-day moving average of inflow size dropped to ~0.4 BTC - a historic low;
∴ Indicates retail-dominant transactions, not whales;
∴ Precedents show this pattern often occurs before breakout events.
✴️ Conclusion: Institutional wallets remain inactive. Momentum awaits external ignition.
⊢
▦ Spot Taker CVD - (Cumulative Volume Delta, 90-day):
∴ Buyers still hold slight dominance, but the curve is flattening;
∴ This signals demand exhaustion and growing equilibrium;
∴ Historically precedes redistribution or longer sideways action.
✴️ Conclusion: Spot market is neutralizing. Demand fades. No clear strength.
⊢
🜎 Strategic Insight - On-Chain Oracle:
∴ All on-chain indicators confirm weak momentum, low inflows, and diminishing spot demand;
∴ There’s no signal of heavy sell pressure - but also no engine for rally;
∴ This is the seal of silence: light flows, thin volume, no imbalance.
✴️ Conclusion: Market waits for external driver. Watch for catalyst.
⊢
⧉ IV. Contextvs Macro–Geopoliticvs – Interflux Economicus:
▦ Middle East Tensions – Israel / Iran:
∴ Dow and S&P futures drop as evacuation alerts from Tehran raise global concern - (InfoMoney);
∴ Crude oil rises up to +2% - markets brace for supply disruption via Hormuz - (CryptoSlate);
∴ Global capital flows to Treasuries and gold, reducing liquidity in risk-on assets like BTC.
✴️ Conclusion: Geopolitical risk increases macro fear. Bitcoin faces risk-off inertia.
⊢
▦ ETF Activity vs Macro Outlook:
∴ Despite $1.7B ETF inflows last week, price failed to hold key resistances - (CryptoSlate);
∴ This divergence reflects growing fear and fragile confidence in crypto exposure amid global tension;
∴ Institutional demand is present, but impact is diluted by macro noise.
✴️ Conclusion: ETF flows bring no clear edge under macro instability.
⊢
▦ Fed Chair Powell (Upcoming):
∴ Jerome Powell will speak on June 19 - expected to comment on rate pause and forward guidance - (Cointelegraph);
∴ Retail data weakens U.S. outlook, but Fed’s stance remains cautious - (FXStreet);
∴ The speech will likely reset volatility across all assets.
✴️ Conclusion: Powell’s message is the next global pivot point. Market waits.
⊢
⚜️ 𝟙⟠ Magister Arcanvm – Vox Primordialis!
⚖️ Wisdom begins in silence. Precision unfolds in strategy.
⊢
⊢
⌘ Codicillus Silentii – Strategic Note:
The current bias is neutral with a bearish weight;
No validated entry present at this time;
Volume must confirm any breakout attempt;
The Seal of Silence remains active - we watch, not react.
⊢
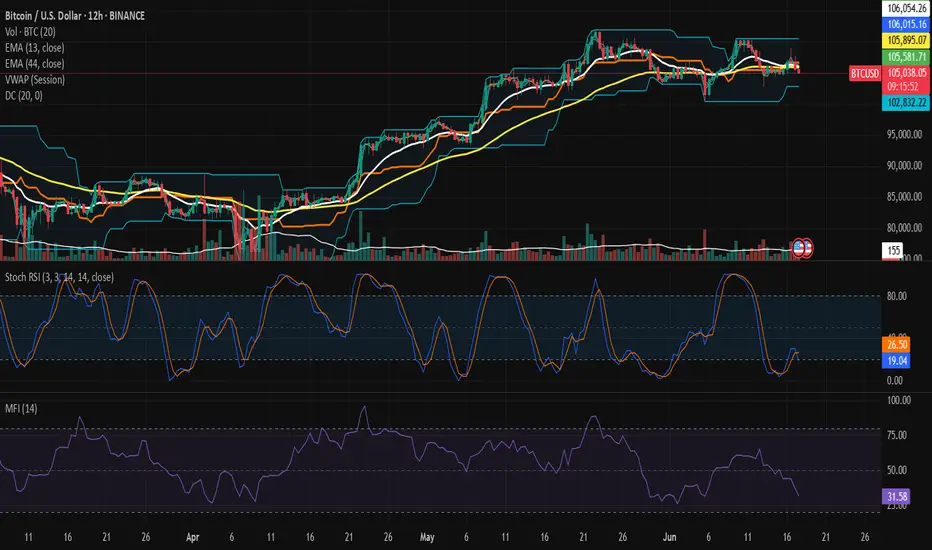
BTC/USD is bearish on 4hr Time Frame -TFBTC/USD is bearish on 4hr Time Frame (TF)
short BTC for the given targets -shown as levels - pls use sl as swing high -