BTCUSD BTCUSD still expecting some good run within to the up side as there’s a new higher price that’s not been touched
Btcusdbuy
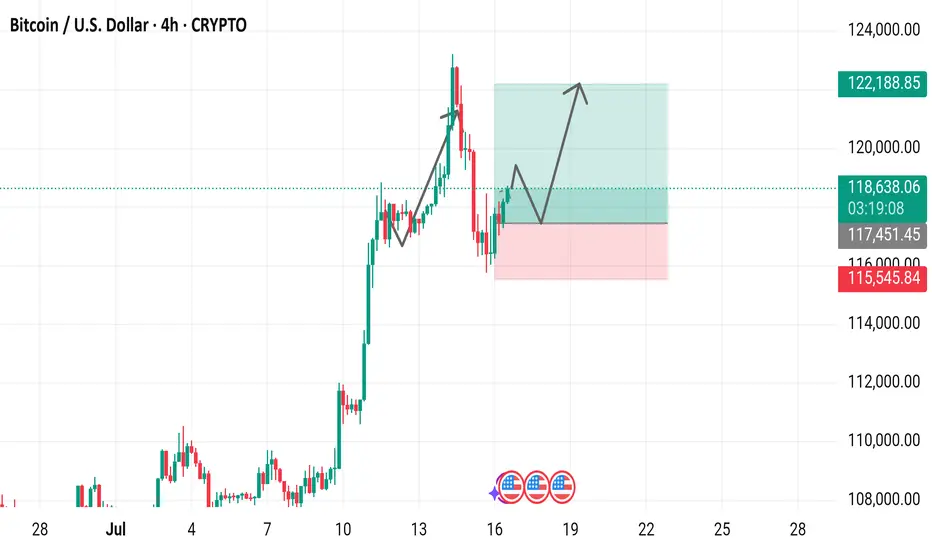
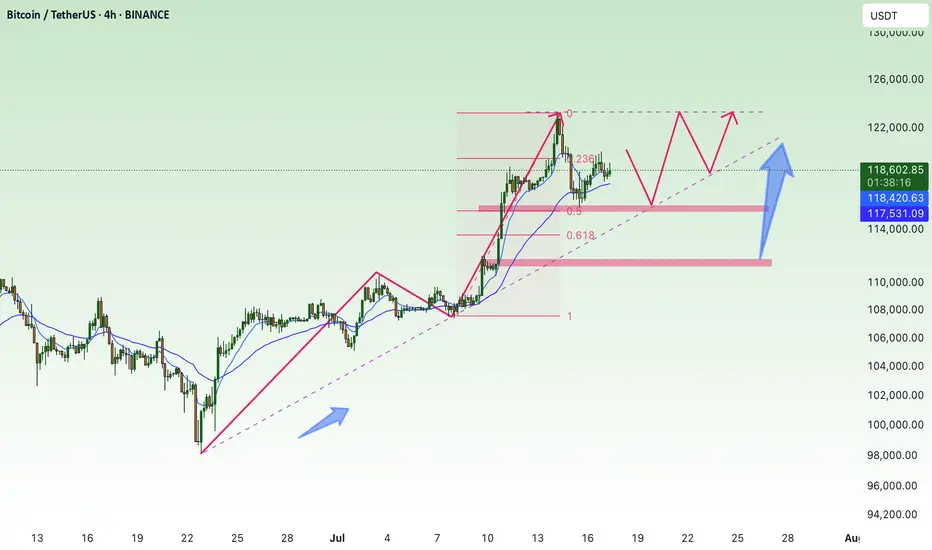
Bitcoin / U.S. Dollar 4-Hour Chart (July 2025)4-hour price movement of Bitcoin (BTC) against the U.S. Dollar (USD). The price has risen from 118,714.64 to 118,714.64 (+937.9 or +0.80%) over the period. Key levels include a support zone around 115,451.45 to 117,451.45 and a resistance zone near 120,000.00 to 122,188.85,
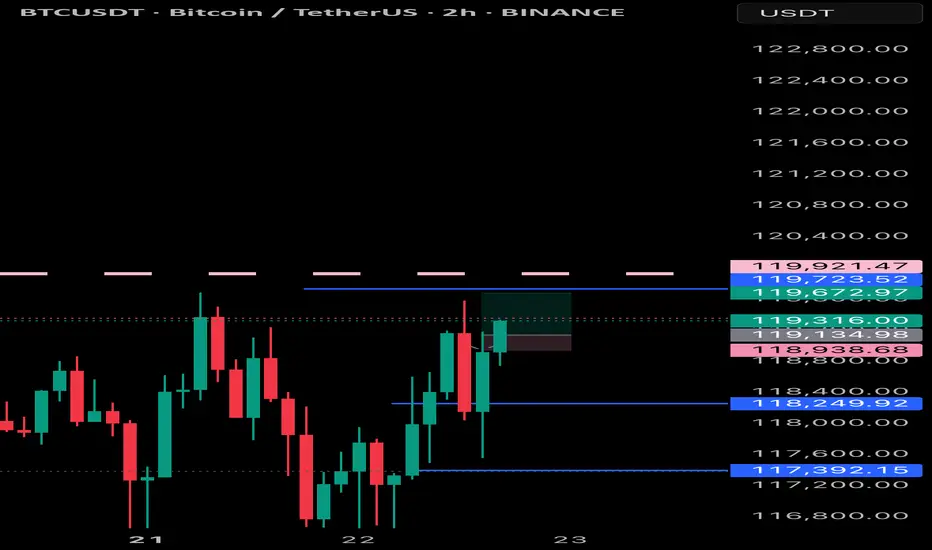
$BTC Breakout Coming?CRYPTOCAP:BTC is coiling up inside a symmetrical triangle on the 2H chart.
A breakout looks close if it clears resistance; we could see a 7.5% move toward the $127K–$128K zone.
Watch for volume confirmation.
DYOR, NFA

Urgent Bitcoin Prediction: Longs Beware!!! Bitcoin longs should be careful, as we are below an important resistance and the market looks bearish. Wait for the confirmations I’ve shown in the video before making any moves! Trade professionally with a proper strategy and well-defined entry tactics!

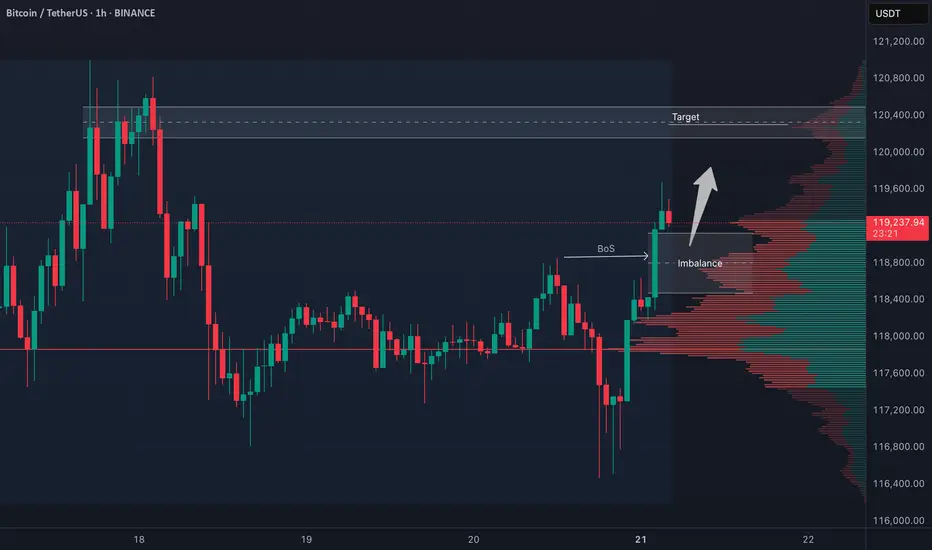
BTC 4H Structure Break – Long Bias with Conditions🚀 BTC (Bitcoin) has clearly broken bullish market structure on the 4-hour timeframe.
📈 My bias is to ride the momentum and look for a pullback to enter long.
✅ I follow a specific entry criteria — price must pull back into the imbalance, find support, and then form a bullish break of structure on a 15m chart to trigger an entry.
❌ If that setup doesn't play out, we simply abandon the idea.
⚠️ This is not financial advice.
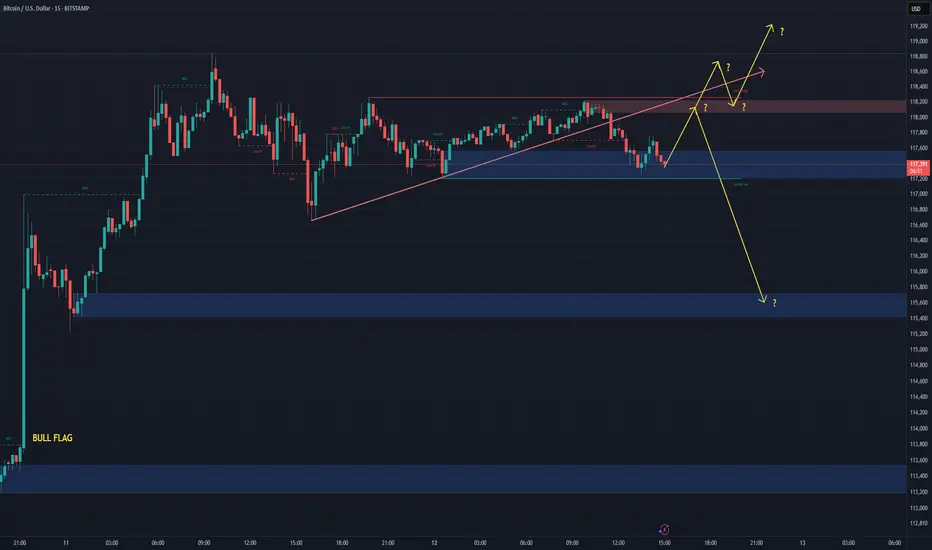
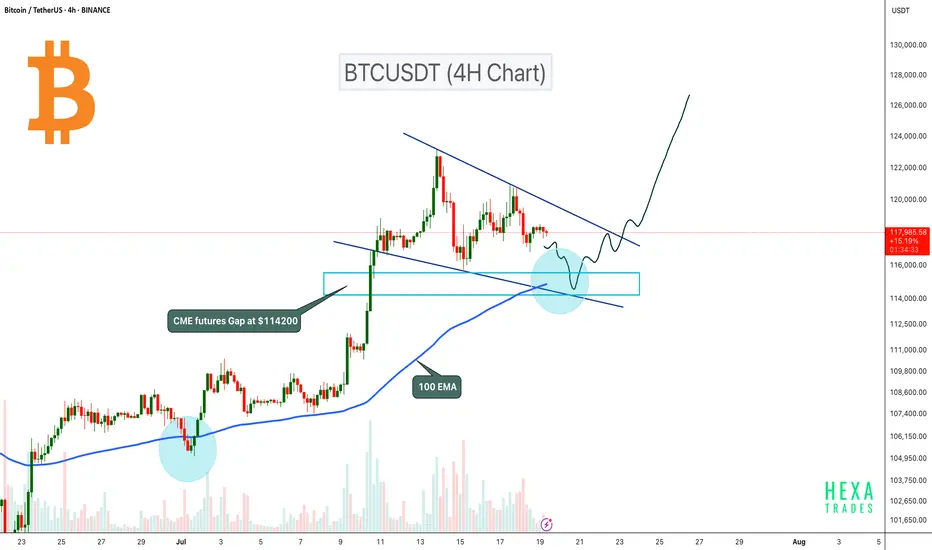
BTC Pullback Expected to $114K Before Next Leg Up!Bitcoin is currently consolidating inside a bullish flag pattern on the 4H timeframe. The price could retest the flag support, where the 100 EMA will act as dynamic support. Additionally, there is a CME futures gap at the $114,200 level, which also aligns with the 0.5 Fibonacci retracement level. Therefore, a retest to the $114,200 zone is likely before the next potential upward move.
A potential bullish reversal could occur if BTC retests this zone and confirms a bounce. A breakout from the bullish flag pattern could signal the next leg up.
Cheers
Hexa🧘♀️
BITSTAMP:BTCUSD CRYPTOCAP:BTC
LAST BTC PUSH? Dear Community,
in order to expand my skills analysis, I will regularly share my analyses and ideas here on TradingView. I still consider myself a beginner in the “stock market” and “crypto” area and am therefore very much looking forward to your comments and input!
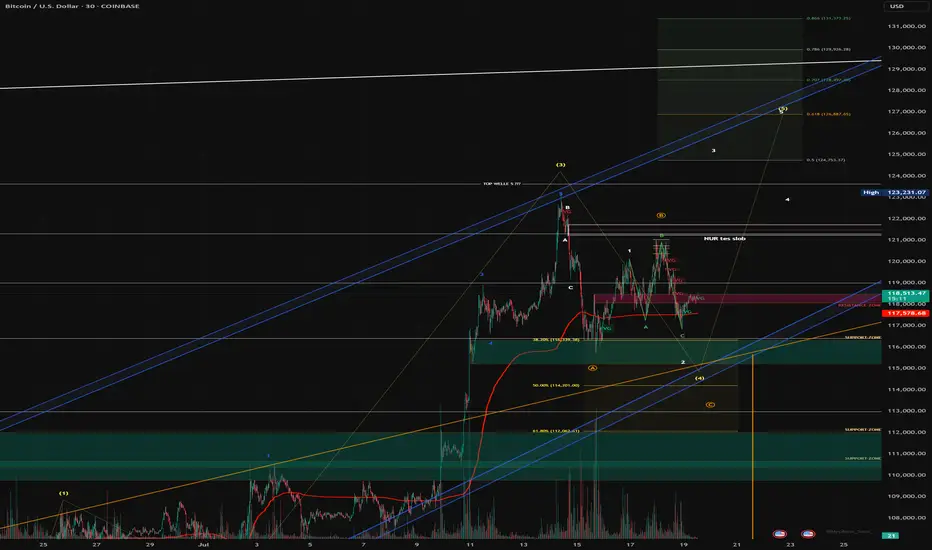
My primary assumption is that we are still in a final upward move. However, I am also pursuing alternative scenarios that could lead to significantly higher levels.
BTC analysis - 1H chart
In my analysis, wave (3) in yellow is complete and we are currently in wave (4) correction, which may not be complete yet.
My guess:
- Wave B (yellow) has been completed, wave C has extended and could still reach USD 113 679, where the Fibonacci 100 level is located. There is also an FVG in the 1H chart.
- A retest of the blue trend channel would be quite possible in order to pick up liquidity at this level before wave 5 (yellow) is completed between USD 126,887 and USD 130,000.
- My risk management is down to USD 107,326 (Fibonacci 1.866).
- We have already tested the Fibonacci 0.5 level (pullback level) and seen a positive reaction. However, we currently lack volume in the market.
- If the blue channel and the Fibonacci 100% level break, I have to assume an alternative count.
In this case, wave 4 would still have scope to reach the Fibonacci 61.8% level in the yellow box at USD 112,062.
If my current forecast does not materialize, I assume that we have already completed wave A and are in the correction to wave B, which will be followed by wave C - with a target of around USD 130,000 for the final impulse.
This scenario also fits in well with risk management up to the Fibonacci level of 1.866. There are also high liquidity areas (long) at this level, which are very attractive for market makers.
What do you think?
BTC-----Buy around 118000, target 120000 areaTechnical analysis of BTC contract on July 18:
Today, the large-cycle daily level closed with a small positive line yesterday, the K-line pattern continued to rise, the price was above the moving average, and the attached indicator was golden cross and running with shrinking volume. The large-scale upward trend is still very obvious. After the previous strong performance, there was a short-term shock correction trend. According to the current trend rules, it is a correction and a trend of market demand. The trend has not changed; the short-term hourly chart yesterday's European session price support rebound, the current K-line pattern continued to rise and the attached indicator was golden cross, so we still have to look at the continuation of the break in the day and the European session. The moving average support position is 120,000 area; the high point is near 121,000 area.
Today's BTC short-term contract trading strategy:
Buy in the 118,000 area, stop loss in the 117,000 area, target the 121,000 area, break the position and look at the 121,500 area;

The Setup: Bullish Breaker in Play!Yesterday, BTC smashed into a strong bullish breaker and bounced like a champ. Today, it’s retracing back to this key level, setting up for what I expect to be another explosive buy reaction. Why? Because this breaker is rock-solid, and the price action is giving us all the right signals! Plus, it’s Friday—the last trading day of the week—and I’m betting BTC will stretch its legs to cover the weekly range. 🏃♂️
🎯 Trade Details: Where to Jump In
Buy Area: Right now, the price is teasing the breaker zone.
Stop Loss: Protect your capital with a stop loss at around ~117,700.
Target: We’re aiming for the Buyside Liquidity sitting pretty around 121,000. That’s a juicy move with solid risk-reward potential! 💪
🧠 Why This Trade Makes Sense
Bullish Breaker Strength: This level has proven itself as a springboard for price action.
Weekly Range Play: Fridays often see BTC push to cover its weekly range, and we’re in prime position to catch it.
Liquidity Grab: The Buyside Liquidity at 121,000 is like a magnet for price—let’s ride it there!
⚠️ Risk Management Reminder
Always trade smart! Use proper position sizing, stick to your risk management rules, and don’t go all-in like it’s a casino. Keep those stops tight to avoid getting wrecked by any sudden volatility. 😎
💬 Join the Conversation!
What do you think of this setup? Are you jumping on this BTC train or waiting for more confirmation? Drop your thoughts in the comments below! 👇 Also, if you like this idea, smash that LIKE button ❤️ and follow for more trade ideas to keep your portfolio poppin’! 🚀
Happy trading, and let’s stack those pips! 💰
#BTC #CryptoTrading #BuyTrade #Bullish #TradingView

Bitcoin Extends Rally – Eyeing $121K+📊 Market Overview:
•Bitcoin is trading around $120,013, up +0.0149% on the day, with a daily range of $117,715 – $120,691 — continuing momentum after a historic rally.
•The rally is supported by strong inflows into BTC ETFs, institutional demand, and pro-crypto legislation recently passed in the U.S. House of Representatives.
📉 Technical Analysis:
• Key resistance: $121,000 – $122,000 (next technical target post breakout)
• Nearest support: $118,000 – $119,000 (aligns with 50 MA and previous consolidation zone)
• EMA 09: Price is above the EMA 09, confirming strong short-term bullish momentum
• Candlesticks / Volume / Momentum: RSI and MACD remain bullish; rising volume in ETFs and institutional flows confirm upward momentum.
📌 Outlook:
Bitcoin is likely to extend its gains in the short term if it holds above $119,000–$120,000 and institutional buying continues.
• Holding above $120,000 → potential to test $121,000 – $122,000
• Falling below $119,000 → risk of correction to $118,000
💡 Suggested Trading Strategy:
BUY BTC/USD at: 119,500 – 120,000
🎯 TP: 121,500
❌ SL: 118,500
SELL BTC/USD at: 121,000 – 122,000 (if bearish reversal signals appear)
🎯 TP: 120,000
❌ SL: 122,500

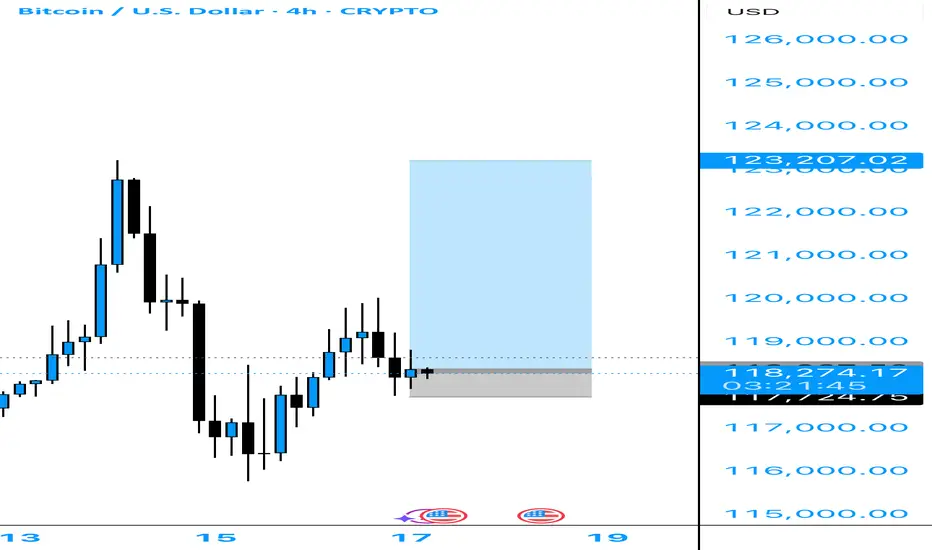
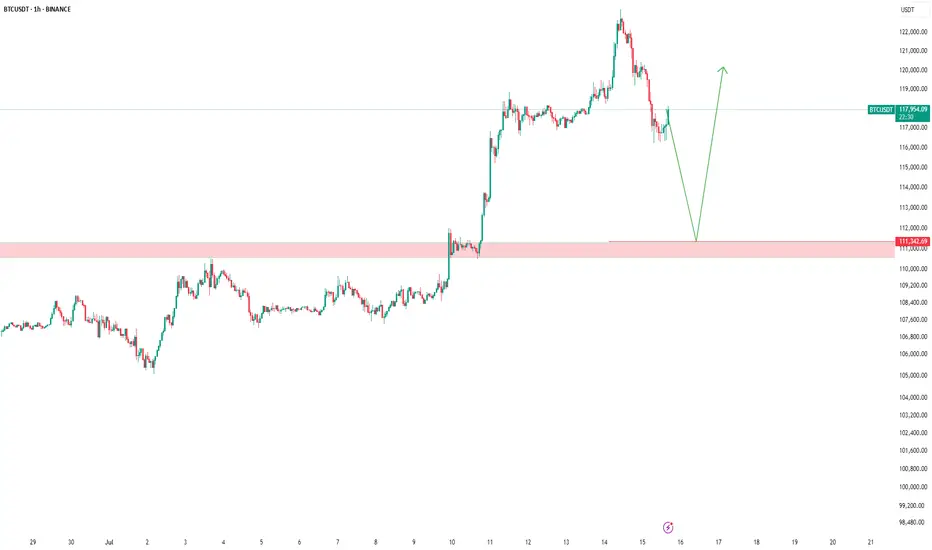
BTC sideways above 115k💎 BTC PLAN UPDATE (July 17)
NOTABLE NEWS ABOUT BTC
Bitcoin Price Forecast: BTC Recovers as Trump Steps In to Revive Crypto Legislation Momentum
Bitcoin (BTC) saw a mild recovery, trading around $119,000 at the time of writing on Wednesday, after falling nearly 2% the previous day. This rebound followed an announcement by U.S. President Donald Trump on Wednesday morning, stating that the GENIUS Act is ready to be passed by the House during the legislative “Crypto Week”, sparking optimism in the crypto market. Furthermore, institutional demand continues to grow, with spot Bitcoin ETFs recording over $400 million in inflows on Tuesday, extending the growth streak since July 2.
TECHNICAL ANALYSIS
🧠 Pattern Overview:
The chart clearly displays an Elliott Wave pattern (1) → (2) → (3) → (4) → (5) along with Fibonacci Retracement and Extension levels, helping to identify potential support and resistance zones.
1. Elliott Waves:
Wave (3) was completed around the $122,144 zone and the market is currently in the corrective wave (4).
Wave (5) is expected to move upward with targets at:
• 1.618 Fibonacci Extension: ~$127,404
• Or further: ~$130,747
2. Support Zone (grey area below):
Located around $115,000 – $116,000, which is:
• The 0.5 – 0.618 retracement of Wave (3)
• Aligned with the EMA200 and dotted black trendline support.
If the price falls into this area, it’s highly likely to bounce back and form Wave (5).
3. Danger Zone if Broken:
If this support fails, price may fall deeper to:
• $113,200 (0.786 retracement),
• Or even lower: $111,600 – $111,800
4. Potential Scenarios:
Two main outcomes:
• Continued Uptrend: Price bounces from the support zone and heads toward $127,000 – $130,000
• Breakdown: If the support breaks, a deeper decline may occur, breaking the wave structure.
Follow the channel for continuous and up-to-date analysis on XAUUSD, CURRENCIES, and BTC.
Bitcoin Day Trade Signsl To Buy NowIf this trade plays out I will make 7x my risk!
Subscribe to my YT channel at DNiceFx to watch me trade live!!
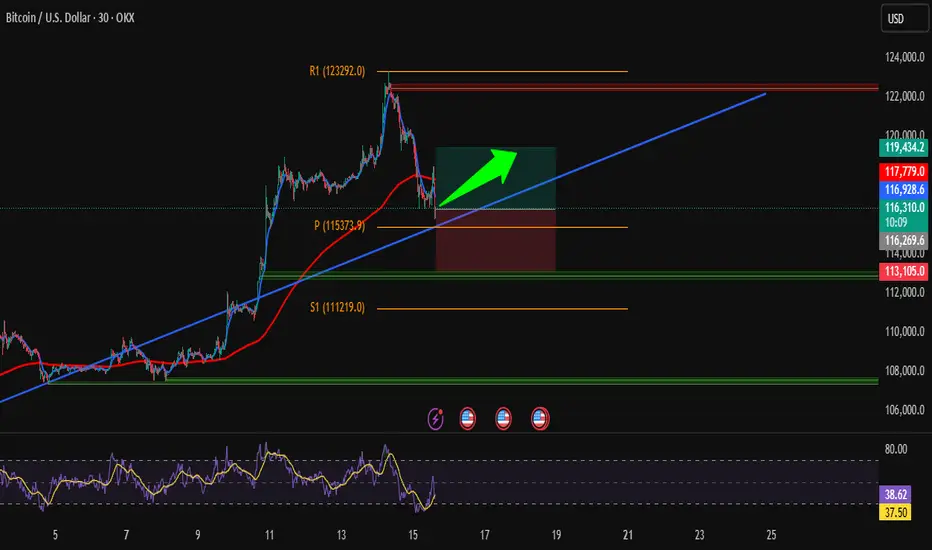
Clean BTC Trade – Bounce from Key Trendline SupportHi traders! , Analyzing BTC/USD on the 30-minute timeframe, we can observe that price is respecting the ascending channel and reacting to the dynamic trendline support (blue line). This bounce, aligned with prior structure, signals a potential bullish continuation.
🔹 Entry: 116,249
🔹 Take Profit (TP): 119,434
🔹 Stop Loss (SL): 113,105
Price remains above the 200 EMA while continuing to respect the ascending trendline, signaling sustained bullish structure. The RSI is showing a bullish divergence, which supports the idea of upward momentum. We also saw a strong reaction at the pivot point (115,373), and a bullish engulfing candle formed right near the trendline — adding further confirmation to this potential long setup.
This long setup presents a favorable risk/reward ratio within the context of the broader trend. Targeting a clean break above previous resistance and return to the R1 zone.
⚠️ DISCLAIMER: This is not financial advice. Trade at your own risk and always use proper risk management
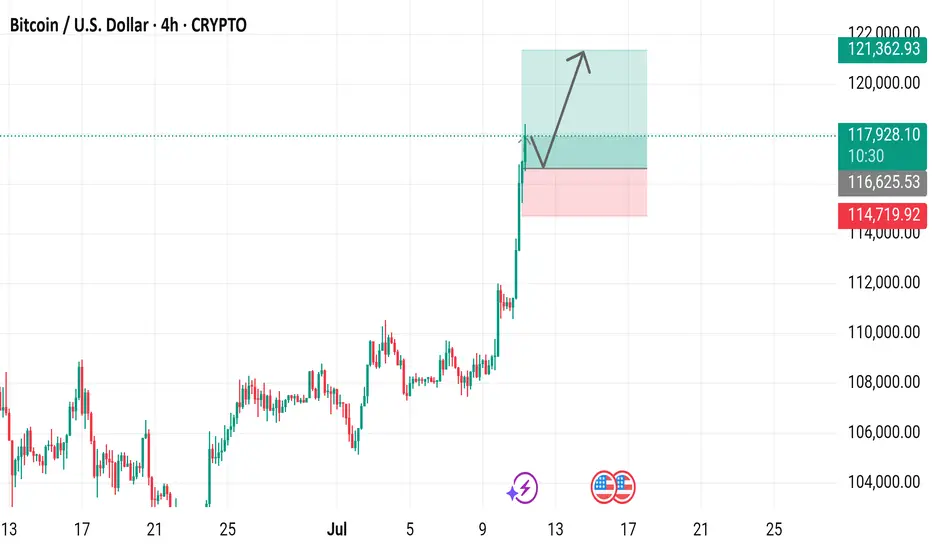
Bitcoin / U.S. Dollar 4-Hour Chart (BTCUSD)4-hour chart displays the recent price movement of Bitcoin (BTC) against the U.S. Dollar (USD) as of July 11, 2025. The current price is $117,979.53, reflecting a 4-hour increase of $1,938.91 (+1.67%). The chart highlights a significant upward trend, with a notable breakout above the $114,719.92 resistance level, reaching up to $121,362.93. Key price levels include support at $116,625.93 and resistance at $121,362.93, with buy and sell options marked at the current price.
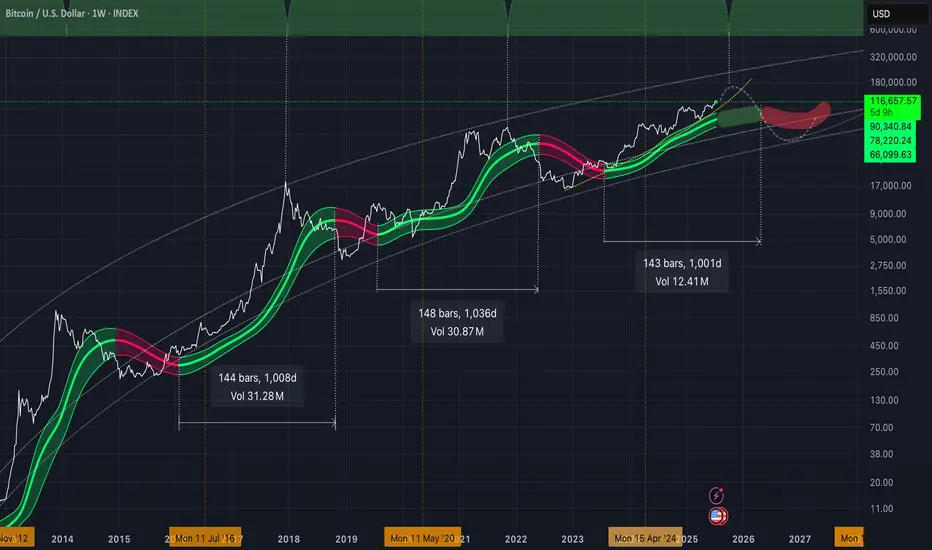
Gaussian suggesting the last leg to the upside!As we approach close to the ~1000 days of bull market conditions above the green GC. Volatility to the upside should be coming before peaking at some point probably in October. Make sure to sell some coins before we get back to the core of the Gaussian. We could be seeing the price tank from 40k-50k later next year. Cheers!
BITCOIN UPDATEHello friends🙌
📈Given the upward trend we had, you can see that the price is in an upward channel and has also formed a bullish pattern, which, given the strength behind the trend, seems to have higher targets.
🔊Be careful, the basic principle of trading is capital management, so be sure to follow capital management.
🔥Join us for more signals🔥
*Trade safely with us*

BTC Analysis — Long-Term Buy Zone AheadI'm watching $111,000 as a major buy zone on Bitcoin.
If price retraces to that level, I’ll be ready to enter a long position.
This is not a prediction — it’s a scenario.
Smart traders don’t guess, they prepare.
Let price come to your level. No chasing.
📍Set your alerts and stay patient.
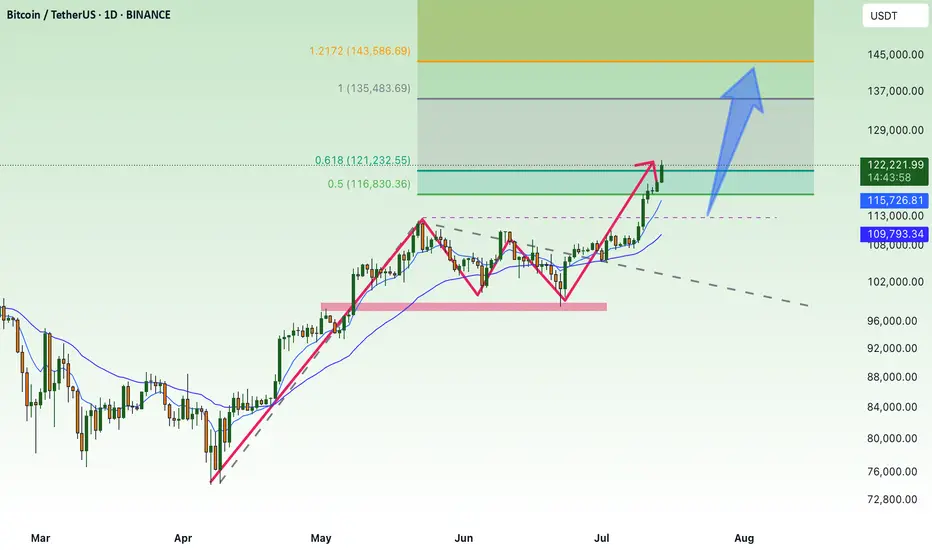
BTC Era, continue to create new ATH💎 BTC WEEKLY PLAN UPDATE (14 July )
NOTABLE NEWS ABOUT BTC
Bitcoin (BTC) broke above a key milestone on Friday, setting a new all-time high of $119,999 with no signs of slowing down. The technical outlook supports further gains as momentum indicators remain strong and price action is solidly in price discovery mode, with the next potential target at $135.000
Bitcoin’s Next Stop: $135.000
Bitcoin entered price discovery on July 9, and since then, the king of cryptocurrencies has surged toward the $120,000 target—a key psychological level for traders. Early Monday during the Asian session, BTC climbed to a peak of $119,999, marking a new all-time high and the closest the asset has come to this milestone.
TECHNICAL ANALYSIS PERSPECTIVE
Two key momentum indicators on the daily timeframe signal underlying bullish momentum in Bitcoin, suggesting a potential for further upside. The Relative Strength Index (RSI) reads 76, and the Moving Average Convergence Divergence (MACD) is flashing green histogram bars above the neutral line.
However, if BTC undergoes a correction, it may extend its pullback to find support near the lower boundary of the Fair Value Gap (FVG) around $115,222.
Derivatives market data shows that $76 million was liquidated over the past 24 hours as BTC surged toward its new high. The long/short ratio, which is considered an indicator of bullish or bearish trader sentiment, is above 1—indicating that more derivative traders are optimistic about Bitcoin and are expecting further gains in the king of cryptocurrencies.
Stay tuned to the channel for updates.
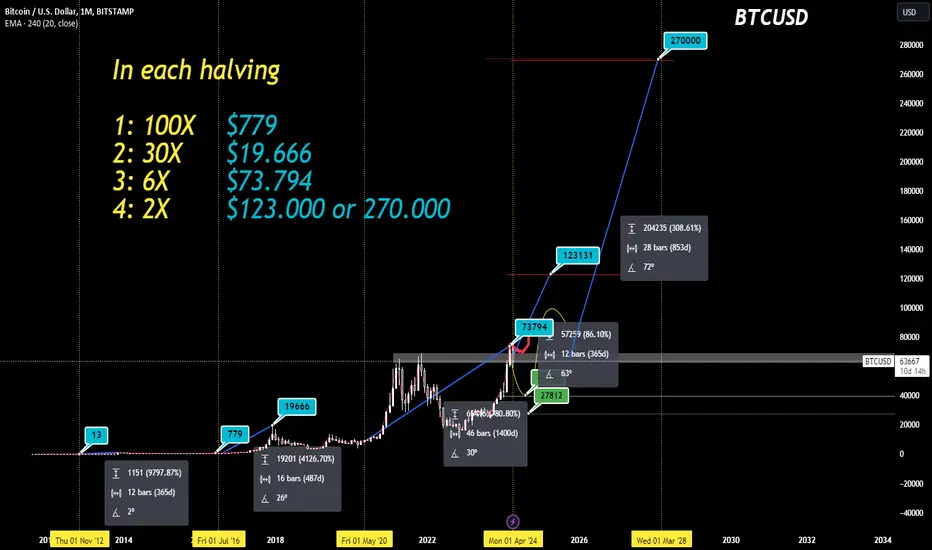
BTC: Next price Halving 📊Analysis by AhmadArz: #BTCUSD
By calculating the price growth in the 4-year halving time frame, we came to the conclusion that with the growth of the Bitcoin market cap, its growth will be halved and we can expect $120,000 from Bitcoin, and it is expected to grow up to 270,000 dollars in halvings.
🔗"Uncover new opportunities in the world of cryptocurrencies with AhmadArz.
💡Join us on TradingView and expand your investment knowledge with our five years of experience in financial markets."
🚀Please boost and💬 comment to share your thoughts with us!
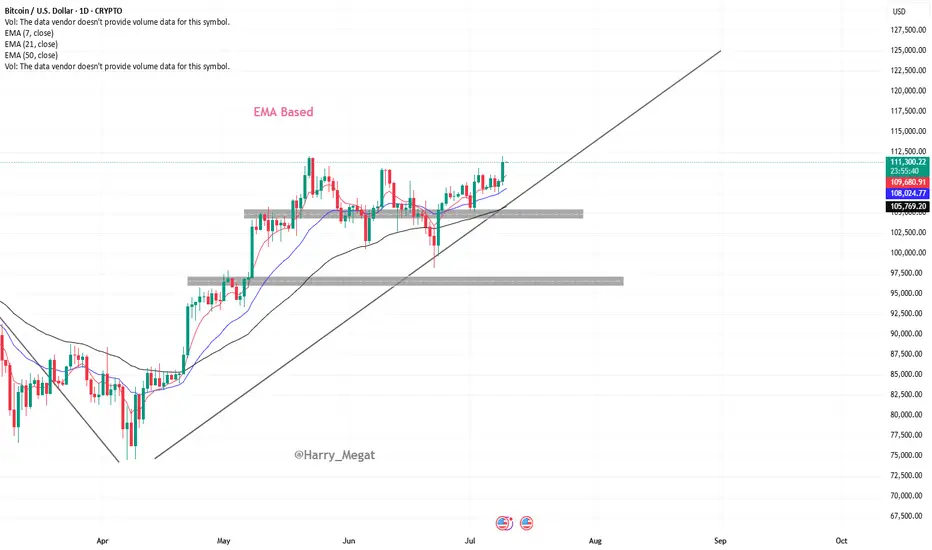
BTCUSD Chart Analysis (Daily Timeframe)Chart Analysis – BTC/USD (Daily Timeframe)
Trend Overview:
* The chart shows **Bitcoin (BTC/USD)** on the **daily timeframe**.
* Price is in a **clear uptrend**, making **higher highs and higher lows**.
* The recent breakout above **\$111,000** suggests a **bullish continuation**.
Moving Average Analysis (EMA 7, 21, 50):
* **EMA 7 > EMA 21 > EMA 50** — this alignment confirms **strong bullish momentum**.
* Price is **well above all EMAs**, especially the 50 EMA (\~\$105,546), showing trend strength and possible institutional support.
* EMAs are **sloping upward**, which further confirms the upward momentum.
Recent Breakout:
* BTC broke out of a **short-term consolidation zone** between \~\$108,000–\$111,000.
* Today’s candle shows a **strong bullish close**, indicating fresh buying interest.
* If this breakout holds, price could extend toward the **next psychological level of \$115,000–\$117,500**.
Support Zones to Watch:
* **Minor support:** \~\$109,000 (EMA 7 + breakout retest area)
* **Stronger support:** \~\$105,500 (EMA 50 and previous swing low)
A break below **\$105,500** could signal a trend shift or deeper pullback.
Summary:
Bitcoin is showing **strong bullish structure** on the daily chart with EMAs aligned upward and a recent breakout above \$111,000. If momentum holds, next upside targets are around **\$115,000–\$117,500**. The bullish trend remains intact unless price breaks and closes below **\$105,500**.
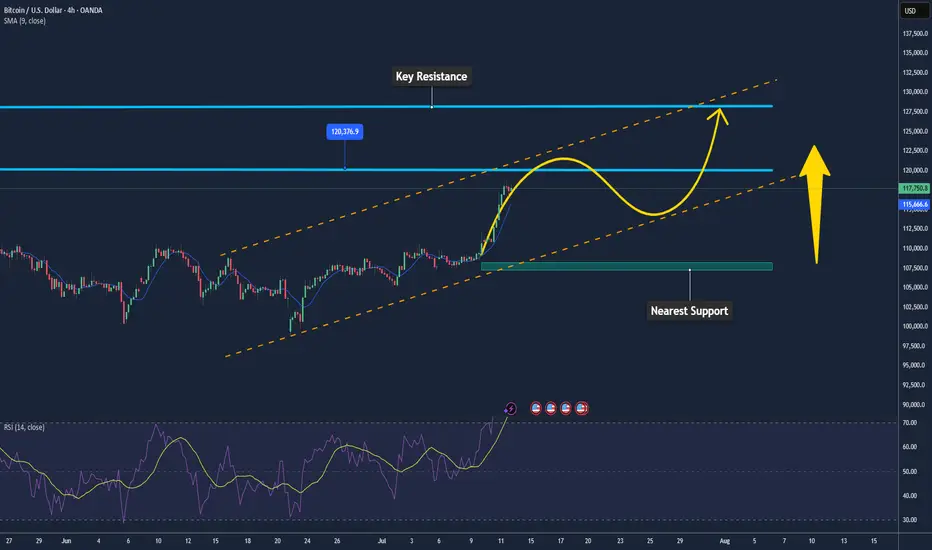
Bitcoin May Continue Rising After Breakout📊 Market Overview:
• Bitcoin recently broke above $118,000, reaching a weekly high of $118,740, fueled by expectations of a Fed rate cut in September and strong ETF inflows into the market
• Katie Stockton from Fairlead Strategies highlights a bullish cup-and-handle pattern, supporting a potential 14% upside toward $134,500
📉 Technical Analysis:
• Key Resistance: $120,000 – $128,500 (based on Fibonacci projection).
• Nearest Support: ~$108,300 – previous resistance turned support, along with ~$107,000 near the 50-day EMA.
• EMA 09: Price is trading above the 9-day EMA, indicating a short-term bullish trend.
• Patterns & Volume:
o A cup-and-handle breakout suggests continued upside potential.
o Rising volume on breakouts reflects strong buying interest.
o MACD is bullish, and RSI is not yet overbought — allowing further room to rise.
📌 Outlook:
Bitcoin may continue to rise in the short term if it holds above the 9-day EMA and avoids a sharp drop below the $108k–110k support zone. A break below this area could trigger a deeper correction toward $100k.
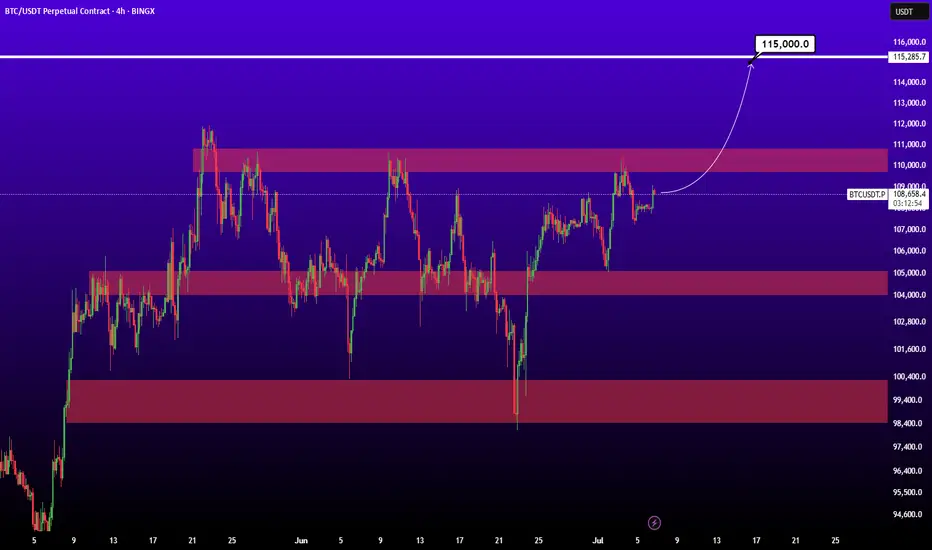
BTCUSDTWait for breaked ATH for 115K target.
BINANCE:BTCUSDT.P
Now price is in two level trading renge but come entry volume of buyers.