BTCUSD (Bitcoin): Forex Technical AnalysisDate: 11 July 2025
Momentum: Up
First Scenario : long positions above 115,706.14 with targets at 117,269.52, 117,904.51 and 118,513.05
Second Scenario : short positions below 115,706.14 with targets at 114,544.35, 113,774.89 and 113,053.39
Comment: RSI - Bullish.
Supports and resistances :
118,513.05 **
117,904.51 *
117,269.52
116,747.25 - Last price
114,544.35
113,774.89 *
113,053.39 **
Btcusdbuy
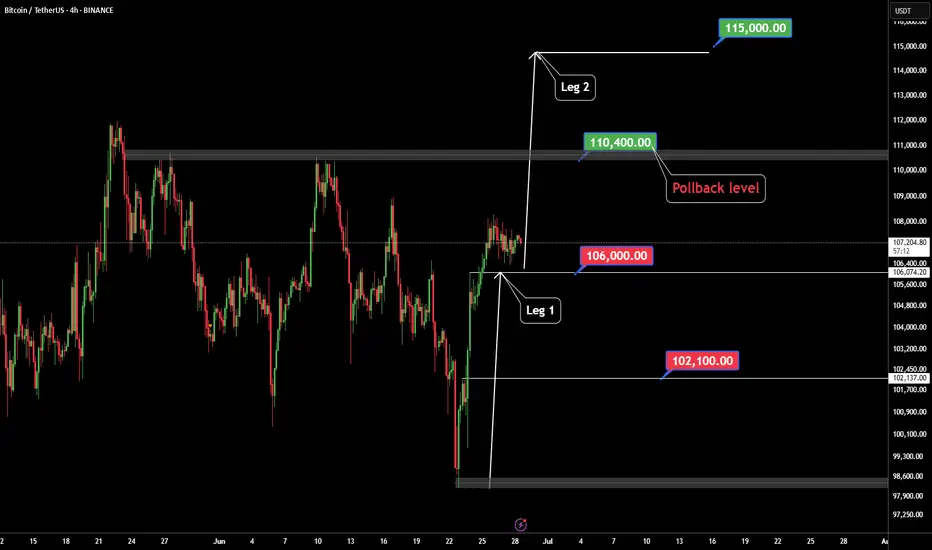
BTC Leg2 115KBINANCE:BTCUSDT major movement from base 98K S to 106K $.BTC want to next movement to 115K $ but in middle of way 110K $ level there are sellers.
Support: 106.000 - 102.000
Resistance: 110.400 - 115.000
⚠️Control Risk Management
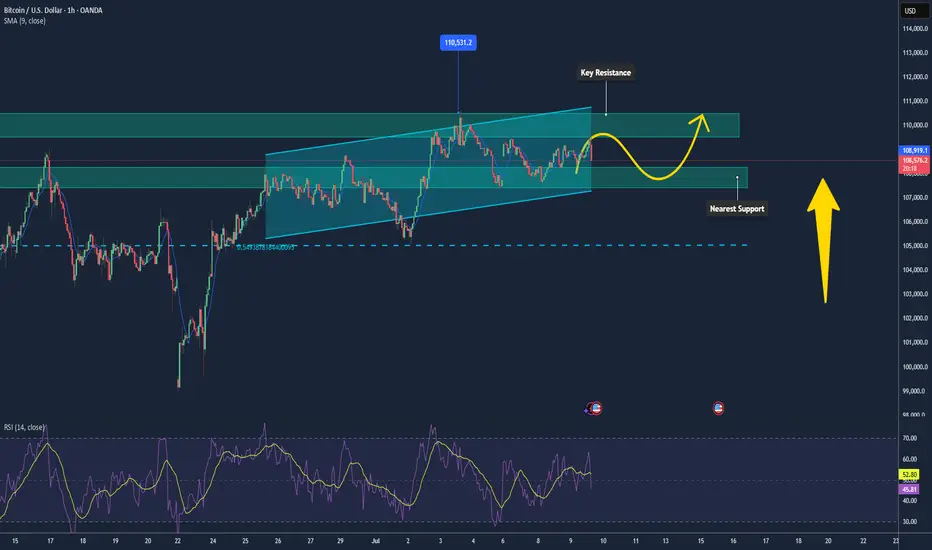
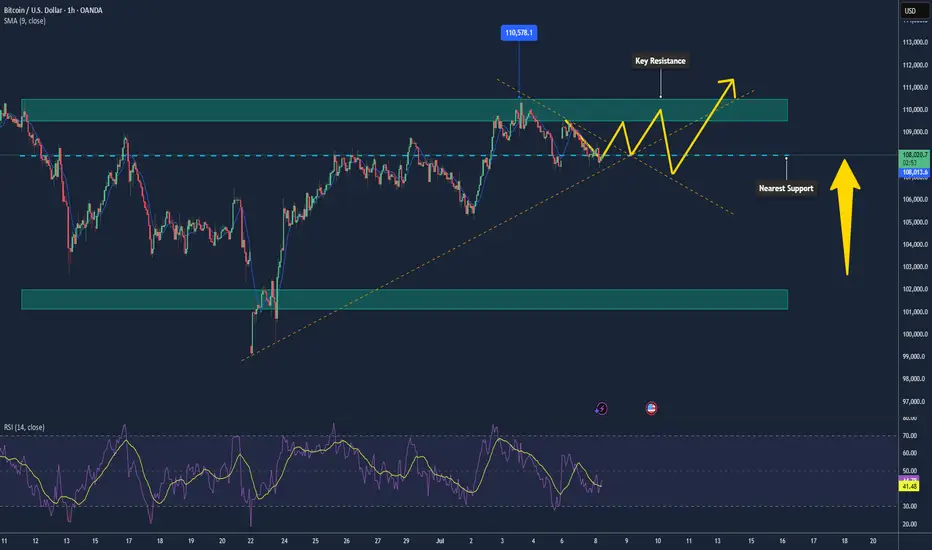
Bitcoin Maintaining Mild Uptrend, Poised Toward $110k📊 Market Overview:
• Strong ETF inflows continue, with over $13.5 billion in YTD flows into BTC, now making up nearly 70% of gold ETF inflows.
• Institutional investors like BlackRock (IBIT currently holds ~700k BTC) are still accumulating. The U.S. is also building a “Strategic Bitcoin Reserve,” reinforcing long-term confidence.
📉 Technical Analysis:
• Key Resistance: $109,000–$110,000, opening the path toward $110,500–$110,600 (Supertrend around $110,174).
• Nearest Support: $108,300 (EMA), followed by $107,800–$108,000; deeper pullback support at $105,000.
• EMA 09: Price is above this EMA → short-term trend remains bullish.
• Candlestick/Volume/Momentum: RSI is neutral around 58; MACD is converging near the zero line, signaling weakening bearish momentum and possible base formation.
📌 Outlook:
Bitcoin may continue its mild upward movement if it holds above $108,300–$108,000 and breaks clearly above $109k–110k with strong volume. Failure to do so could trigger a pullback toward $107,000–$108,000.
💡 Suggested Trading Strategy:
📉 SELL BTC/USD at: 109,500–110,000
🎯 TP: 108,000
❌ SL: 110,400
📈 BUY BTC/USD at: 108,200–108,500
🎯 TP: 109,500–110,000
❌ SL: 107,800
BTCUSD BULLISH MORE all time high again The price may briefly break above the 113,000–114,000 level (first target) to trap long positions, then sharply reverse.
Support Break Warning:
If BTC fails to hold the 110,000–108,000 support zone, it could accelerate a drop to deeper supports:
Support Area 1: 106,000
Support Area 2: 102,000
Extreme Bearish Target: 96,000–94,000
What to Watch:
Bearish divergence on lower timeframes
Volume drop on new highs = possible fakeout
Candle rejection from 113,000–114,000 zone
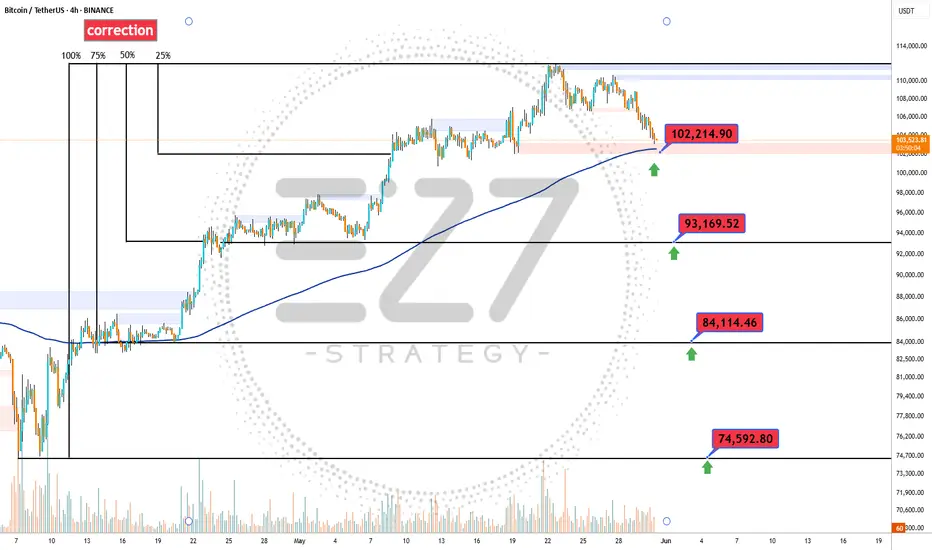
BTC Correction's 📉 Significant Bitcoin Correction During Uptrend
After a strong bullish rally, Bitcoin has entered a correction phase, retracing nearly 25% of its recent gains. Interestingly, this correction aligns exactly with the 200-period moving average on the 4-hour chart, marking a potential key support level.
🔍 Is Bitcoin’s Correction Over or Just Beginning?
The overlap with the 200 MA could signal the end of the correction, but if this zone fails to hold, deeper targets between the 35% and 75% retracement levels may come into play.
🛡️ Potential Support Levels for Bitcoin if the Correction Continues:
First support: 102,200 USD – 25% correction
Second support: 93,200 USD – 35% correction
Third support: 84,100 USD – 50% correction
Fourth support: 74,600 USD – 75% correction
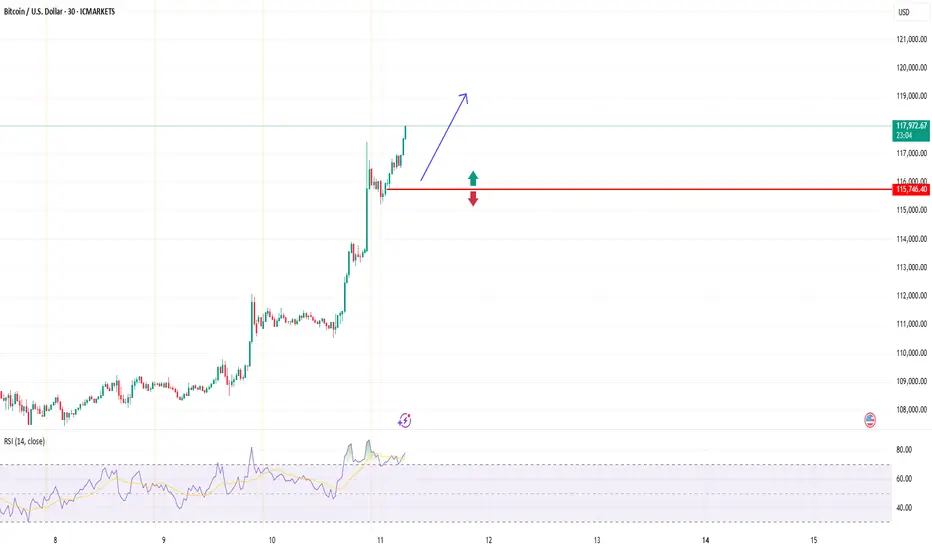
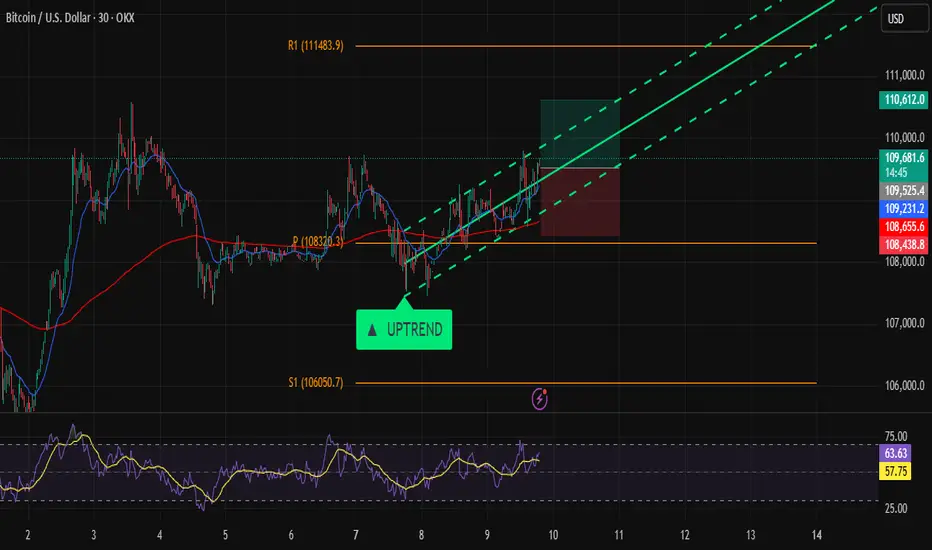
Bitcoin on Fire: Targeting $110K in Relentless Uptrend!Hi traders! , Analyzing BTC/USD on the 30 minute timeframe, price is currently respecting an upward channel and showing consistent higher highs and higher lows. The recent bounce from dynamic support suggests bullish continuation.
🔹 Entry: 109,545
🔹 Take Profit (TP): 110,612
🔹 Stop Loss (SL): 108,438
Price is trading above both the 50 and 200 EMA, confirming bullish momentum. The RSI remains above the midline, indicating buyers are still in control. This long setup offers a favorable risk-reward ratio within the context of the broader uptrend.
A confirmed breakout from the short-term resistance, combined with trendline support and channel structure, adds confluence to this idea. Watch for potential resistance near the 110,612 zone.
⚠️ DISCLAIMER: This is not financial advice. Every trader is responsible for their own decisions and risk management.
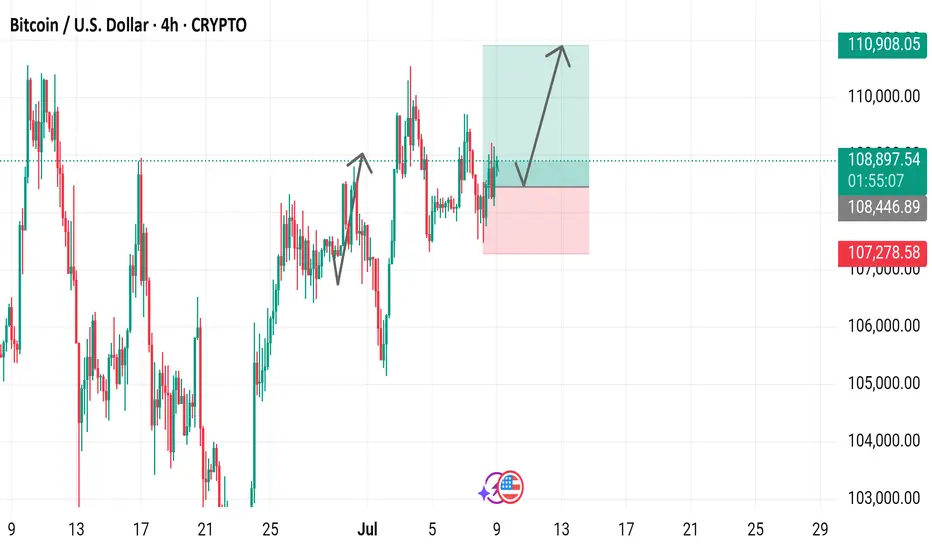
Bitcoin / U.S. Dollar 4-Hour Chart (BTCUSD)4-hour candlestick chart displays the price movement of Bitcoin (BTC) against the U.S. Dollar (USD) from late June to early July 2025. The current price is $108,895.04, with a 24-hour change of +$619.70 (+0.57%). Key levels include a support zone around $107,278.58 and a resistance near $110,908.05. The chart highlights recent price action, including a potential upward trend indicated by a green shaded area, with buy and sell signals marked at $108,895.04.

BTC back to 110K, ATH effortPlan BTC today: 09 July 2025
Related Information:!!!
Cryptocurrencies are trading in a volatile environment driven by tariff-related uncertainties ahead of the release of the Federal Reserve's (Fed) Minutes from the June meeting, scheduled for Wednesday. Bitcoin (BTC) continues to exhibit technical weakness, trading below the key resistance level near $109,000. Trading activity in the spot market remains subdued, with K33 Research reporting a 4% decline in weekly volume to $2.1 billion.
Aside from a few selective rallies, as evidenced by Wednesday’s top-performing tokens, most altcoins are underperforming relative to Bitcoin, reflecting limited engagement from the retail segment. Nonetheless, Ethereum (ETH) is showing early signs of a potential upward move after breaking above the former resistance-turned-support level at $2,600. Ripple (XRP), meanwhile, has extended its recovery above $2.33, posting over 1% in intraday gains.
personal opinion:!!!
Continued efforts by the bulls, breaking ATH above the 110,000 price zone. The time is near for the FED to lower interest rates.
Important price zone to consider :!!!
support zone : 109.200
resistance zone : 109.700
Sustainable trading to beat the market
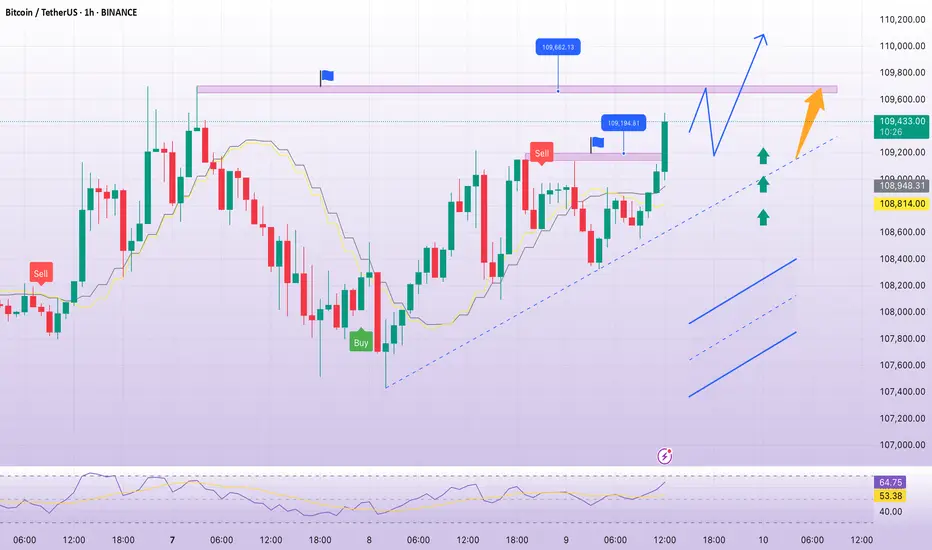
Bitcoin Update – Bullish Falling Wedge in Play?BTC/USD is currently trading near $108.8K, compressing within a falling wedge formation — historically a bullish continuation pattern, especially after a strong uptrend.
Why the Bias Remains Bullish:
Bullish MA Cross: Short-term MAs (9/21) are aligned for upside momentum.
Falling Wedge: Price compressing with lower highs and lows, coiling for a breakout.
RSI Strength: RSI (purple) remains elevated, supporting continued upside pressure.
Fundamental Catalysts:
Trump delays trade war announcements, reducing global uncertainty.
FOMC meeting in late July: Trump pushes for rate cuts, potentially bullish for risk assets like BTC.
If BTC breaks out above the wedge resistance with convincing volume:
Retest likely at ~$110K
Targets : $115K → $120K+
BTC/USD H4 Downfall ⚠️ Disrupted Market Perspective
🟩 False Resistance Zone
The marked resistance area (~109,000) has been breached multiple times with high volatility, suggesting weak resistance strength. Instead of rejecting price, this zone acts more like a liquidity trap — luring in sellers before price spikes higher. Expect fake-outs or bullish traps near this area.
🟨 Questionable Bearish Pattern
The projected zig-zag drop is speculative. The current market structure shows higher lows forming, hinting at potential accumulation rather than breakdown. If price consolidates above 108,000, this setup might flip bullish instead of heading to the 106,000 target.
🟥 Support Area Disruption
The labeled support zone around 106,000 may not hold if broken, but it has been respected multiple times in the past. If bulls defend it again, we might see a sharp rebound rather than a continuation downward. Therefore, the “Target” area could instead become a springboard for upward reversal.
Bitcoin Ranging Below $110k – Poised for a Breakout📊 Market Overview:
Bitcoin is consolidating around $108–109k, reflecting indecision as investors await clearer signals. Institutional ETF inflows remain strong, and recent moves from 2011-era dormant wallets sparked concern but no major sell-off. Positive ETF news or supportive crypto policies could propel the next move upward.
📉 Technical Analysis:
• Major resistance: $109,500 – $110,500
• Nearest support: $108,000; secondary support at $102,000
• EMA09 (1 h): Price is above the 20 EMA and has reclaimed the 200 SMA on the 1 h chart, signaling a technical rebound
• Candlestick / Volume / Momentum: A mild bounce from $108k with low volume; Bollinger Bands show a mid-range price, hinting at sideways action .
📌 Outlook:
Bitcoin may remain range-bound between $108k and $110k. A breakout above $110.5k with strong volume could push toward $112k–115k. Conversely, a break below $108k might trigger a dip toward $102k.
Suggested Trading Strategy
SELL Bitcoin/USD at: 109,000 – 110,000
🎯 TP: 108,000 / 105,000
❌ SL: 110,800
BUY Bitcoin/USD at: 108,000 – 107,500
🎯 TP: 109,500 / 112,000
❌ SL: 107,000
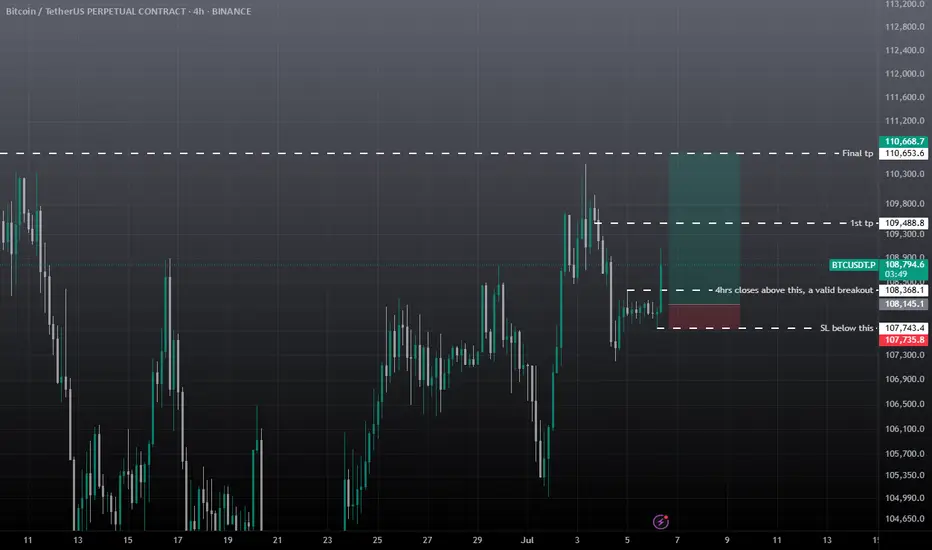
BTC SCALP TRADE / Long Setupwait for the entry, must use SL. If final tp is achieved then trade is not valid, active till final tp. Must use proper risk management. Expecting upside move. If SL hit then take previous trade, It's still valid.
BTC up following H1 trend linePlan BTC today: 07 July 2025
Related Information:!!!
Bitcoin (BTC) trades slightly below $109,000 at the time of writing on Monday, following its highest weekly close on record. Institutional and corporate demand continues to serve as a key catalyst, with Metaplanet acquiring an additional 2,205 BTC on Monday, while US-listed spot Bitcoin Exchange Traded Funds (ETFs) saw over $769 million in net inflows last week.
As market participants assess the latest bullish indicators, focus now shifts to broader macroeconomic developments, including new trade-related headlines and reports suggesting that the administration of US President Donald Trump may extend the current tariff pause until August 1.
personal opinion:!!!
BTC moves sideways in the trend line, trend line support 108,300
Important price zone to consider :!!!
support zone : 108.300
Sustainable trading to beat the market
Bitcoin BTC Trade Plan: Watching for Breakout or Pullback Entry📊 Currently watching BTC (Bitcoin) as price action remains bullish overall, but we're approaching a key decision point 🎯
💹 Price is pushing higher, but with some signs of exhaustion after the recent rally ⚠️ — and with the weekend approaching, we could either see a continuation higher or a healthy pullback
I’m keeping an eye on two potential trade scenarios:
1️⃣ A break and clean retest of the recent high, which could offer a continuation long if momentum follows through 🚀
2️⃣ A retracement into equilibrium — a deeper pullback toward fair value 📉 — which could also present a high-probability long setup if confirmed with structure and reaction 📈
Either way, I’m letting the market reveal its hand and waiting for one of these setups to play out before committing 💡
💬 Not financial advice — always assess your own risk and confirm with your own analysis.

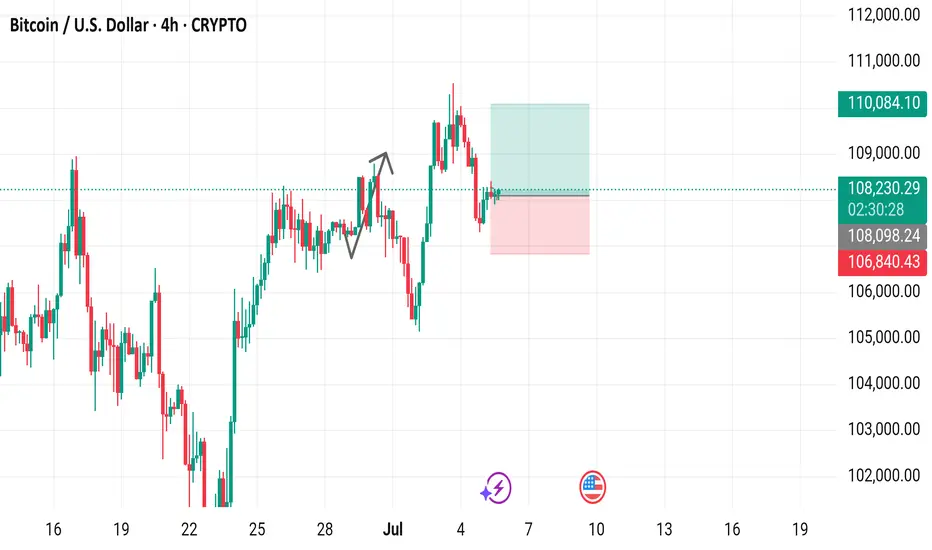
Bitcoin / U.S. Dollar 4-Hour Chart - CRYPTO4-hour candlestick chart displays the Bitcoin (BTC) to U.S. Dollar (USD) price movement, currently at $108,252.17 with a 0.21% increase (+$230.82). The chart highlights a recent upward trend with key price levels marked, including a buy price of $108,252.17 and a sell price at the same level. Support and resistance zones are indicated with a pink shaded area around $106,840.43 to $108,252.17 and a green shaded area near $110,084.10. The chart spans from late June to July 7, 2025, with the latest data point at 06:27 PM PKT on July 5, 2025.
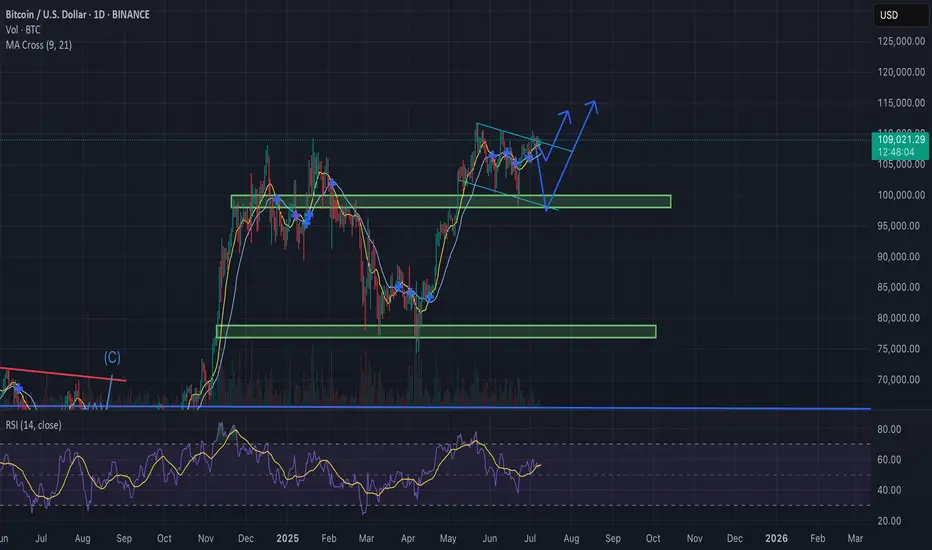
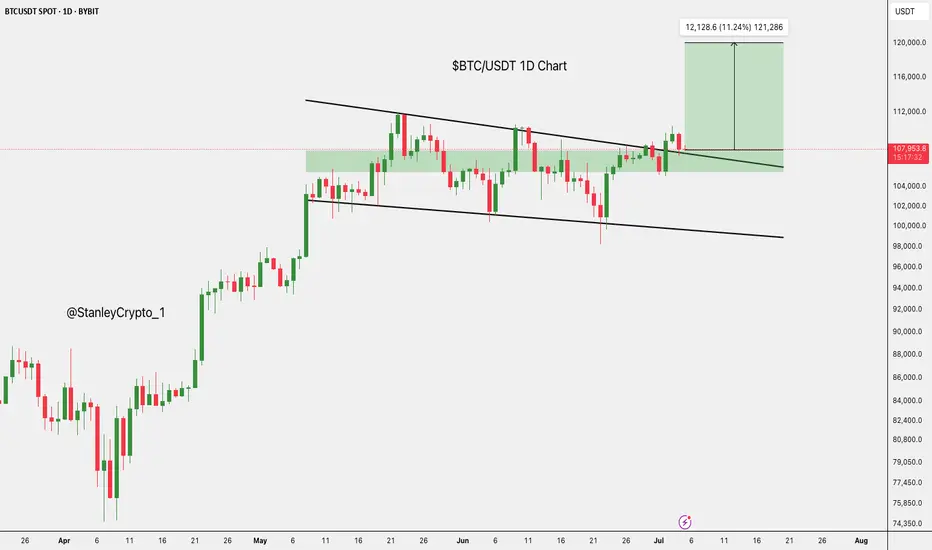
$BTC/USDT daily chart $121K next.CRYPTOCAP:BTC just broke out of a descending wedge on the daily chart, a strong bullish signal.
It’s now holding well above key support and the 50-day moving average, showing buyers are in control.
If BTC stays above $106,400, we could see a move toward $121K next.
DYRO, NFA
BTC: 650 Point Long Trade To 108,650$ (Date: Sat 05 Jul 25)High potential signal as my all signals. Don't miss this opportunity. At least open a trade in demo just to test.
Details:
Entry: Now - 108,100 $
Target Price: 108,650 $
Stop loss: 107,700 $
Trade Ideas:
There is a flag pattern here after a good down trend. So here is possibility for a small pull back till my target price.
Trade Signal:
I provide trade signals here so follow my account and you can check my previous analysis regarding BITCOIN. So don't miss trade opportunity so follow must.
BINANCE:BTCUSDT BINANCE:BTCUSDT.P BYBIT:BTCUSDT.P

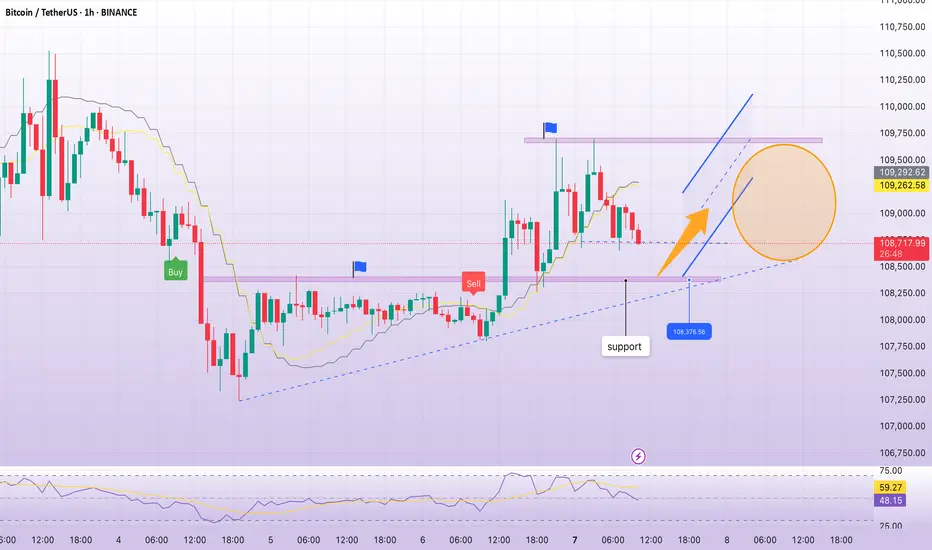
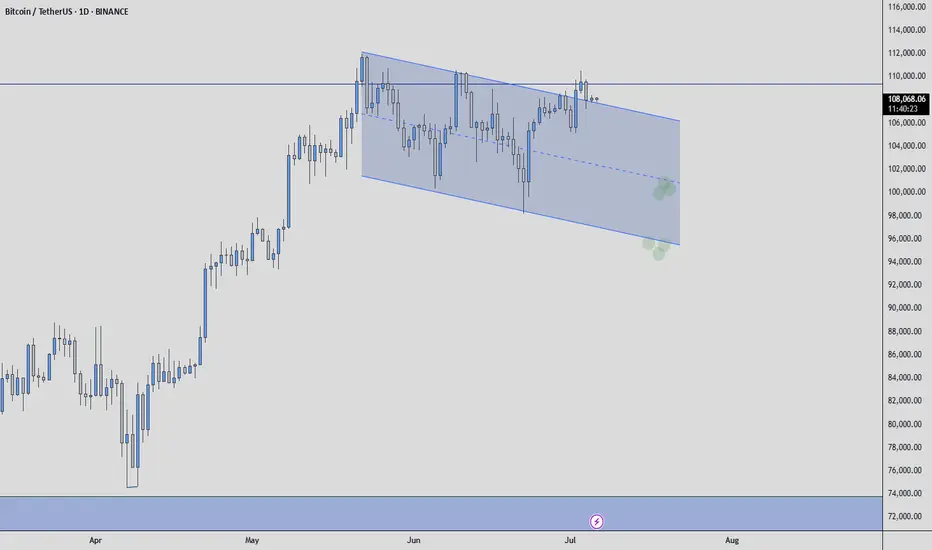
BTC - Channel is Broken, Now What?
We are currently retesting the upper trend line of the channel I gave in this analysis, the most bullish scenario is that it breaks upwards and BTC stages a determined rally. If you cannot catch an entry during this rally, do not worry, we can retest the upper part of the trend again or go to manipulation areas such as green bubbles.
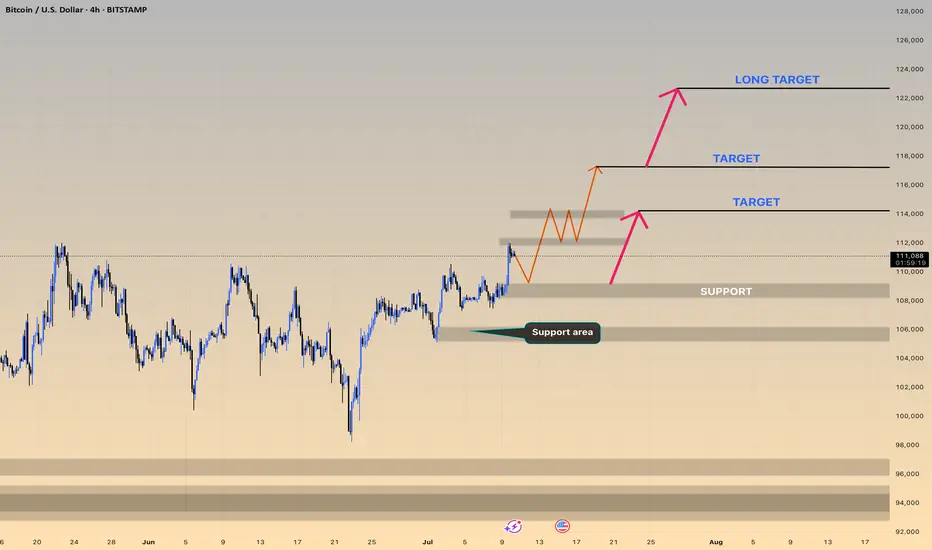
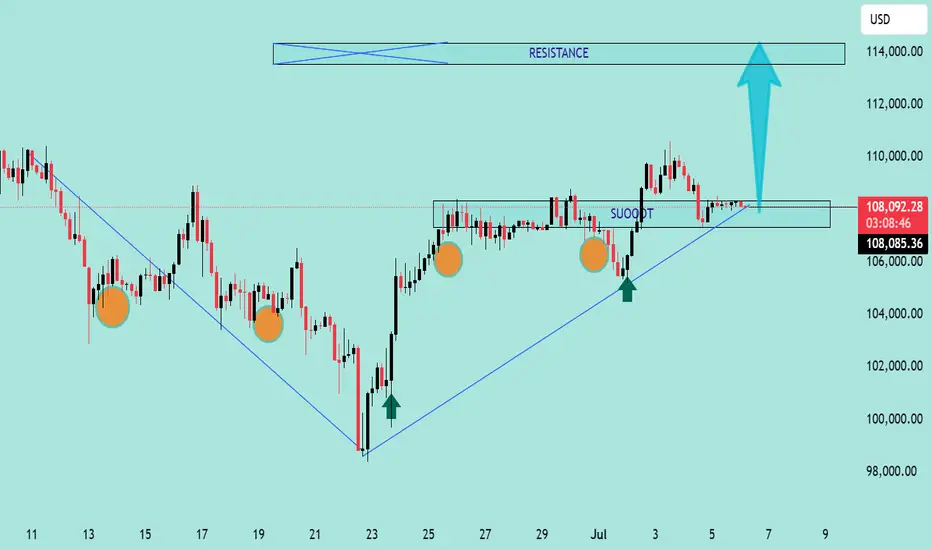
BTC/USD Bullish Reversal Breakout Pattern BTC/USD Bullish Reversal Breakout Pattern 🚀
Technical Analysis:
🔹 Trend Reversal: The chart shows a clear inverse head and shoulders pattern highlighted with orange circles — a strong bullish reversal signal after a downtrend.
🔹 Breakout Zone: The neckline resistance around 108,000 USD has turned into support (marked as “SU00QT” due to a typo, assumed to be “SUPPORT”). Price action is consolidating just above this zone.
🔹 Trendline Support: The upward blue trendline confirms bullish structure, with price forming higher lows. Recent price action is bouncing off this trendline, showing strength.
🔹 Bullish Confirmation: Green arrows indicate strong bullish rejections from key levels, aligning with breakout retests.
🔹 Target Projection: The measured move from the inverse head and shoulders pattern projects a target towards the 114,000 USD resistance zone 📦 highlighted above, suggesting a potential 5-6% upside move 📊.
Conclusion: As long as price holds above the 108,000 support zone and the ascending trendline, BTC/USD remains bullish with potential continuation towards 114,000 USD. A breakout above minor consolidation could trigger a strong bullish rally 💥.
🛑 Invalidation: A sustained break below 106,000 USD would invalidate the bullish structure and may lead to further downside.
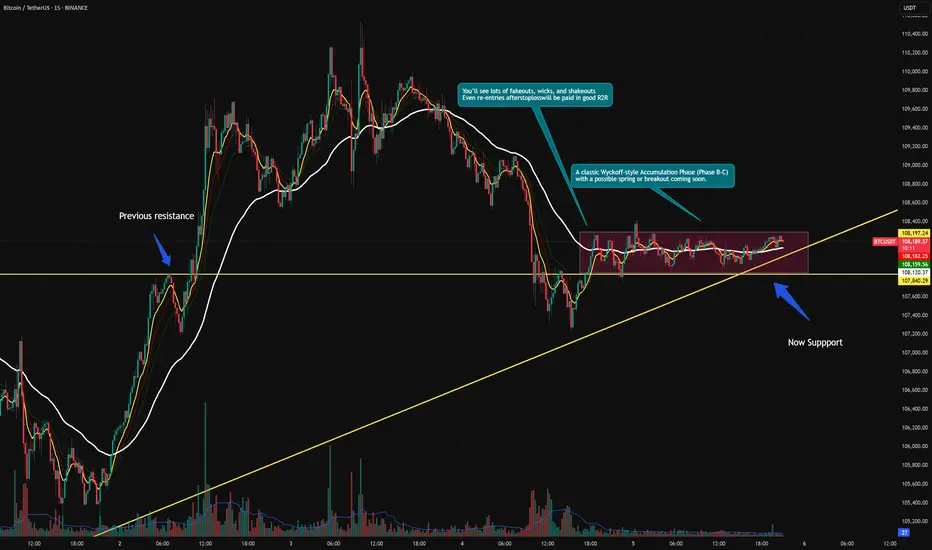
BTCUSDT – Accumulation Confirmed? Wyckoff Blueprint Playing Out Bitcoin continues to compress inside a defined range, resting above both a rising trendline and a former resistance turned support zone. This structure fits cleanly within a Wyckoff-style Accumulation Phase (B-C).
We’re now at a critical moment where smart money may be absorbing supply, preparing for the next phase.
🔍 Key Observations:
Range-bound price action with higher lows and muted volume
Spring-like wick and recovery from the bottom of the range
Support holding at prior breakout zone and ascending trendline
Structure shows signs of stealth accumulation with a possible breakout ahead
Sideways movement with fading volatility
Gradual compression within the range
Strong support defended multiple times (might make the support weaker as well !)
A potential spring/retest event may already be in play
You’ll see fakeouts, wicks, and hesitation in this phase — designed to trap weak hands. But the underlying behavior points to preparation, not distribution.
The quiet before the markup. Let the market reveal its hand. 📈
Weekend BTC Trend Analysis and Trading SuggestionsLet's review this afternoon's market performance. The BTC price, as we anticipated, rebounded to around 109,000 in the afternoon before plummeting sharply. Living up to "Black Friday", this violent drop was well within our expectations. In the afternoon's live trading, we also reminded everyone that as long as there was a rebound to the upper zone, it was a good opportunity to go short. This drop has created a space of nearly 1,500 points. Currently, the BTC price has pulled back to around 107,800.
From the current 4-hour K-line chart, after a strong upward surge, the market encountered significant resistance near the upper track of the Bollinger Bands. As bullish momentum gradually faded, the price started to come under pressure and decline, suggesting that the short-term upward trend may come to a temporary halt. At present, the market has recorded multiple consecutive candlesticks with large bearish bodies. The price has not only effectively broken below the key support level of the Bollinger Bands' middle track but also caused the Bollinger Bands channel to switch from expanding to narrowing, indicating that market volatility is decreasing. In terms of trading volume, it showed a moderate increase during the price pullback, which further confirms the authenticity of the bearish selling pressure.
BTCUSD
sell@108000-1085000
tp:107000-106000
Investment itself is not the source of risk; it is only when investment behavior escapes rational control that risks lie in wait. In the trading process, always bear in mind that restraining impulsiveness is the primary criterion for success. I share trading signals daily, and all signals have been accurate without error for a full month. Regardless of your past profits or losses, with my assistance, you have the hope to achieve a breakthrough in your investment.
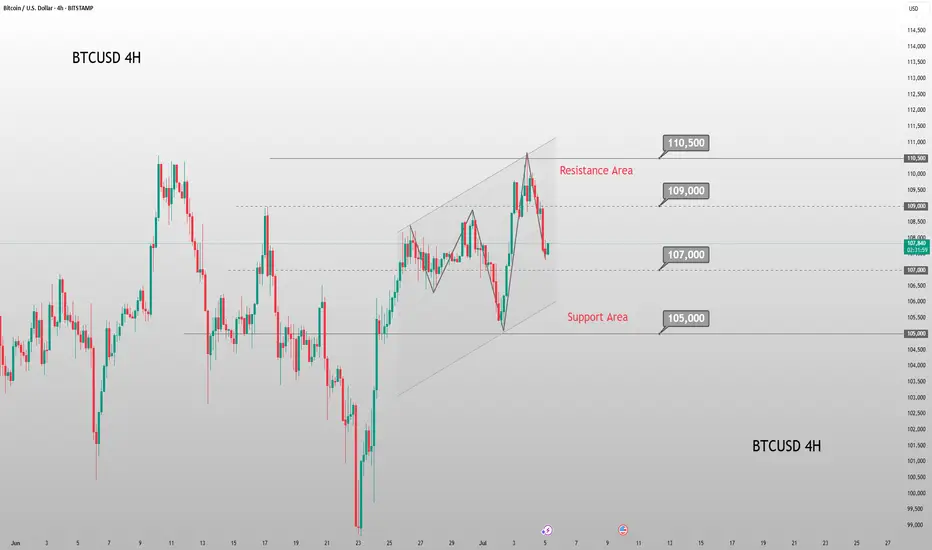
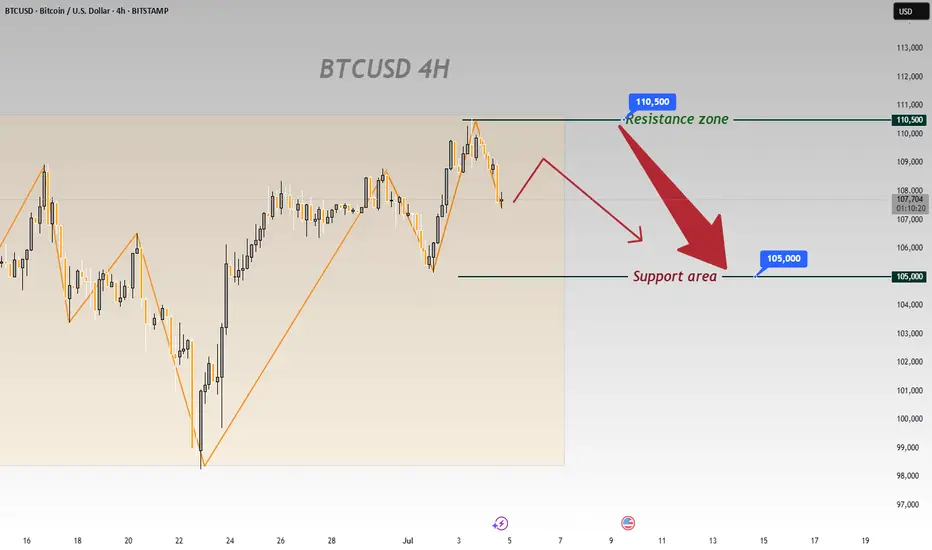
On BTCUSD’s 4 - hour chart, downside risks prevailOn BTCUSD’s 4 - hour chart, downside risks prevail:
Resistance Holds
Price failed to break 110,500, showing strong selling pressure that caps bulls 🚫. A pullback is likely.
Downtrend Signals
Post - resistance, price is retracing. Candlesticks and chart arrows point to a drop toward 105,000 support, fueled by building bearish momentum ⬇️.
Support Test Looms
105,000 is the next key level 🔑. Even if support slows the fall, the setup favors downside—bullish reversals seem unlikely after resistance failure.
Trend Weakness
Orange trendlines show the prior uptrend is fragile 🧊. Failing at 110,500 signals fading bullish force, setting up for a bearish correction.
In short, the 4 - hour chart is bearish. Watch for drops to 105,000; 110,500 will likely block bulls 🛑. Trade cautiously with this bias.
🚀 Sell@108500 - 107500
🚀 TP 106500 - 105500
Accurate signals are updated every day 📈 If you encounter any problems during trading, these signals can serve as your reliable guide 🧭 Feel free to refer to them! I sincerely hope they'll be of great help to you 🌟 👇