Bitcoin Breaches $69,000: Bullish Breakout?Bitcoin Breaches $69,000: A Bullish Breakout or a Fleeting Glimpse?
Bitcoin (BTC) bulls were ecstatic as the world's leading cryptocurrency climbed above $69,000 during early Asian trading on June 3rd. This move marked a significant milestone, breaking a resistance level that has held firm for the past 12 weeks. However, the crucial question remains: is this a decisive breakout or a temporary blip within a prolonged trading range?
The recent surge follows a period of relative stability for Bitcoin. After reaching a new all-time high near $69,000 in early March, the price retreated and consolidated within a range of roughly $60,000 to $67,000. This consolidation phase, while frustrating for some investors hoping for immediate gains, can be a healthy sign for the long-term health of the market.
Several factors are fueling the current optimism surrounding Bitcoin:
• Institutional Adoption: The continued influx of institutional investors into the cryptocurrency space is a major driver of growth. Large investment firms, hedge funds, and even traditional banks are increasingly recognizing Bitcoin's potential as a valuable asset class. This institutional interest provides much-needed stability and legitimacy to the market.
• Positive On-Chain Metrics: Analysis of on-chain data, which tracks the movement of Bitcoin on the blockchain, suggests positive signs for future price movements. Metrics like active addresses and exchange outflows indicate that investors are accumulating Bitcoin and holding onto their assets, which can reduce sell-off pressure and contribute to price appreciation.
However, there are also reasons for caution:
• Resistance at $69,000: The $69,000 level represents a significant point of resistance. Previous attempts to break above this level have been met with selling pressure, pushing the price back down. Successfully flipping this resistance into support will be a crucial step for a sustained bullish run.
• Macroeconomic Concerns: The broader macroeconomic environment remains a source of uncertainty. Rising interest rates, a potential global recession, and ongoing geopolitical tensions could all dampen investor sentiment and negatively impact the cryptocurrency market.
• Regulation: Regulatory scrutiny surrounding cryptocurrency remains a potential hurdle. Government intervention could stifle innovation and limit market growth, although clear regulations could also bring more stability and attract hesitant investors.
So, will Bitcoin's climb above $69,000 be a lasting victory? Experts are divided.
Some analysts believe this is a breakout signal, paving the way for a continued price increase towards new all-time highs. They point to the confluence of positive on-chain metrics, institutional adoption, and increasing scarcity of Bitcoin due to its capped supply.
Others remain cautious. They highlight the strong resistance at $69,000 and the potential for a pullback if bulls fail to maintain momentum. Additionally, they emphasize the unpredictable nature of the cryptocurrency market and the influence of external factors like global economic conditions and regulations.
Ultimately, the future direction of Bitcoin remains uncertain. However, the recent surge above $69,000 signifies a renewed sense of optimism in the market. Whether this translates to a sustained bull run or a temporary blip within a trading range will depend on various factors, including the ability of bulls to overcome resistance levels and the overall health of the global economy.
In the coming weeks, investors should closely monitor key metrics such as trading volume, order book depth, and news surrounding regulations and institutional adoption. These factors will provide valuable insights into the strength of the current uptrend and the potential trajectory of Bitcoin in the near future.
Btcusdbuy
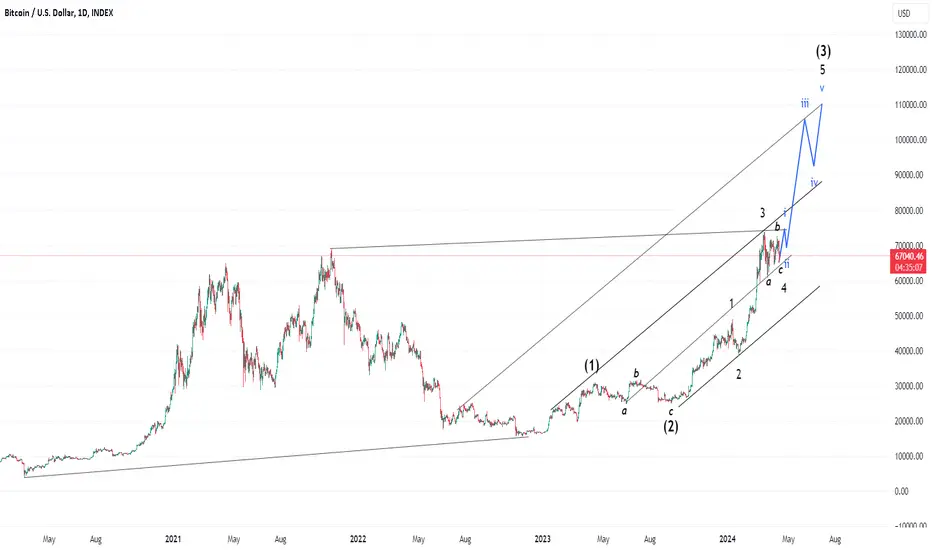
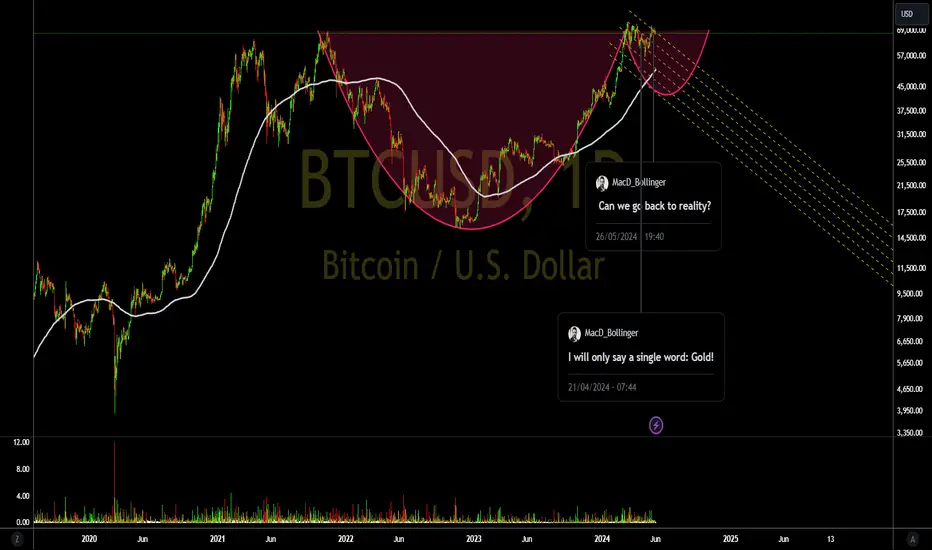
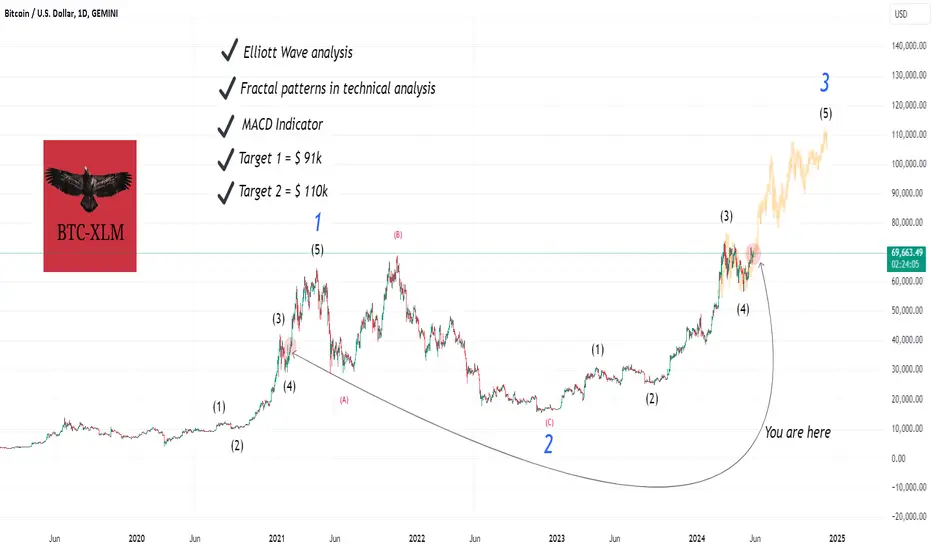
Wave 5 is probably too largeHey guys and girls,
Here is an updated chart from my (Feb 29, 2024) post.
Technical Section:
Wave 3 < 161.8% of wave 1
Wave 4 = 38.2% of wave 3 (Wave a = 38.2% of wave 3, It did)
Wave 5 is probably too large
Extended Wave 5 (Target 2 ) = 100% x length of (beginning of Wave 1 to top of Wave 3)
(Extended Wave 5 = 161.8% x length of (beginning of Wave 1 to top of Wave 3))
Targets:
Target 1 = $ 91k
Target 2 = $ 110k
Take care.
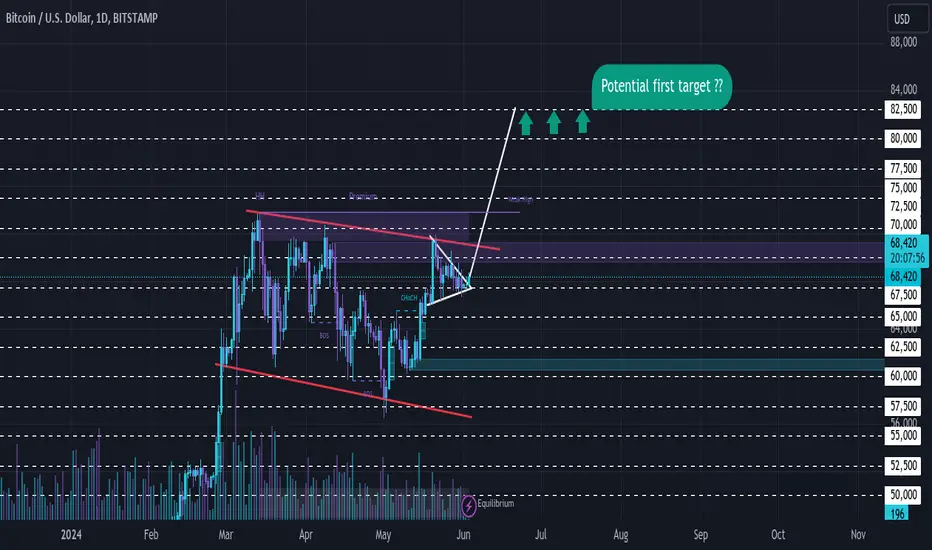
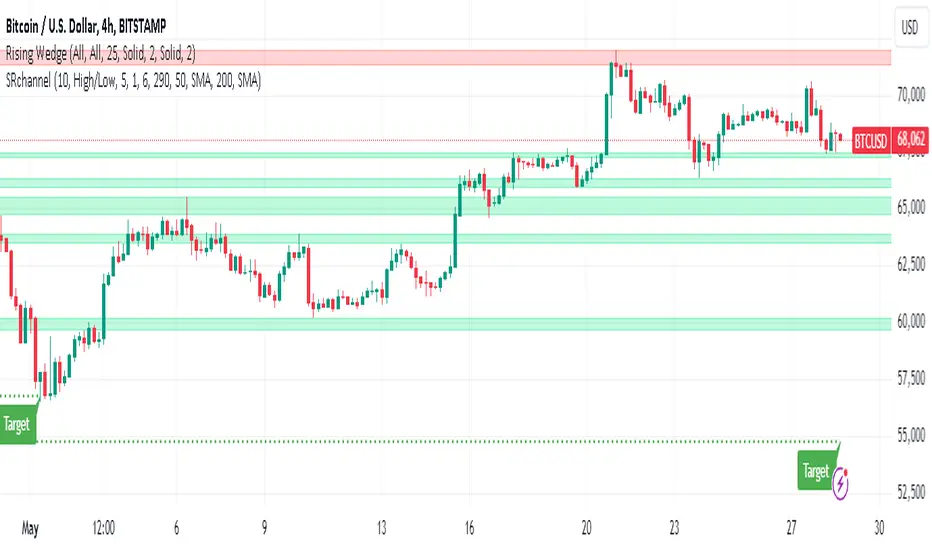
BTC ready for the pump??As I marked out you can see a descending channel followed by a bullish pendent that's breaking out. I've also marked out key levels that price bounces from. As of today price has reacted of the range of 67500 (Each level being marked 2500 apart). I believe we can be seeing prices reaching 82500 pretty soon! Hope everyone is having a successful trading day so far. BTC to the Moon. good luck everyone
BTC – Weekly Perspective – 02/06 to 09/06On the first day of June, the SETUP used indicates a corrective bearish pivot on the long-term chart. Will we have a correction later on, so that the cryptocurrency finally breaks free and reaches new peaks?
When we analyze the impressive rise that the cryptocurrency has had in the last 16 months and trace just one Fibonacci retracement, we will see that the 50% region is around 44.6K.
In my opinion, a correction as soon as possible is completely healthy, as nothing goes up forever in a straight line without there being a correction at some point in the future.
Coming to the daily chart, we have prices on the verge of forming a corrective pivot, with enough strength to reach 44.5K, if prices do not remain above 69.6K.
The most interesting thing is to see that we have a confluence between the values provided by the Fibonacci retracement of the rise, in which 50% of this correction is at 44.6K, with the corrective pivot found on the daily chart, whose final destination has the potential to reach 44 .5K, as shown in the images above.
Can I trust what my eyes have just seen? To know for sure, unfortunately, I will have to live day by day.
Do your analysis and good business.
Be aware, if you buy, use stop loss.
See other graphical analyzes below.
PEPE Vs other memecoins previous ATHDear reader,
Im posting this observation to leave you speculating how much would we will reach with pepe this season. given that, i have put a line where would pepe's price would stand at DOGE and SHIB previous all time highs.
I believe we are still very early and i hope we can see a market cap similar to doge, we are still early.

#Bitcoin Update+ Risk Check, Are you safe?12 days ago, BTC Daily faced rejection, whereas the 6-hour chart appears stable. Currently, the price is hovering at the support level. However, come Monday, the situation could shift, regardless of the direction.
If Bitcoin rallies to the lower support in daily, will your position remain secure?
If not, you may be overexposed!
Many new traders make this mistake routinely, ultimately becoming targets for liquidation engines.
I recognize that these dips, if they occur, present opportunities.
I understand that I might not be able to time the exact bottom perfectly, so I take action by laddering in and increasing my exposure during downturns.
I am holding a few leveraged positions with low leverage, and I plan to do the same.
It's very important to manage risks when the Altcoin market is about to go parabolic!
#bitcoins #AltcoinGems
Do hit the like button if you agree and share your views in the comment section.
Thank you
#PEACE

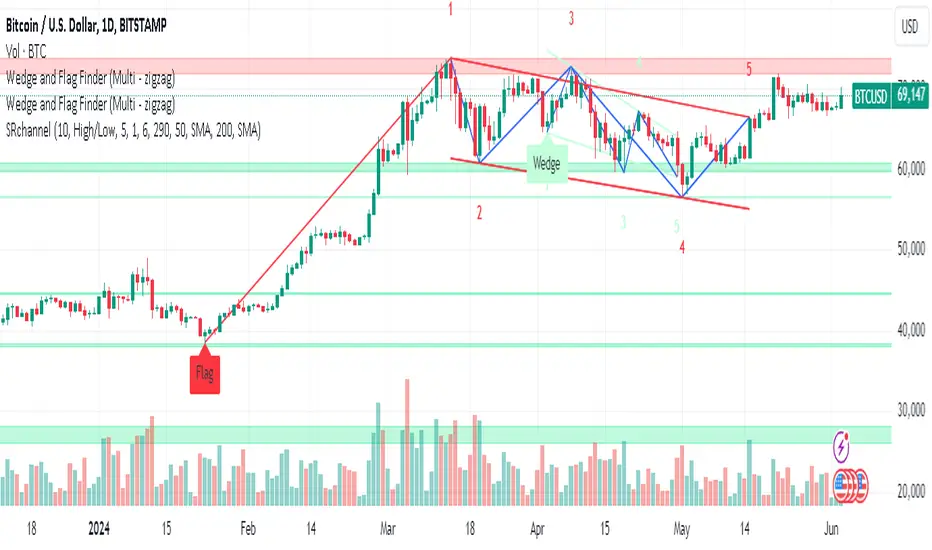
BTCUSDT long ideaThe BTC/USD pair is demonstrating significant bullish potential, driven entirely by technical factors indicating an imminent breakout from a well-defined triangle pattern.
Bitcoin Eyes $70,000 as Strong US Data Weakens Dollar
Bitcoin (BTC) is experiencing a surge in price, defying expectations and climbing towards the $70,000 mark. This bullish momentum comes after the release of positive US economic data, which surprisingly weakened the US dollar. The data, including strong GDP figures and lower-than-anticipated jobless claims, has instilled confidence in riskier assets like Bitcoin across the board.
Breaking Through Resistance
Bitcoin has been battling resistance levels around $60,000 for the past few weeks. However, the recent economic data from the United States appears to have flipped the switch, propelling the cryptocurrency above this key barrier. Analysts believe this breakout could signal a continuation of the upward trend, potentially reaching targets as high as $70,000 or even beyond.
US Dollar Loses Footing
The positive US data, while traditionally seen as positive for the US economy, has had an unexpected consequence for the US dollar. Investors are interpreting the strong economic performance as a sign that the Federal Reserve may slow down its quantitative easing (QE) program sooner than anticipated. This tapering of QE could weaken the dollar's value relative to other assets, including Bitcoin.
Risk Assets on the Rise
The positive sentiment surrounding Bitcoin is spilling over into other risk assets. Stock markets worldwide are experiencing gains, and other cryptocurrencies are also showing signs of bullishness. This broad-based rally suggests that investors are feeling more optimistic about the overall economic outlook, which is translating into increased risk appetite.
Is This a Sustainable Rally?
While the current surge in Bitcoin's price is encouraging, some analysts remain cautious. The long-term sustainability of this rally will depend on several factors, including the future trajectory of US Federal Reserve policy and global macroeconomic conditions.
• Federal Reserve Policy: The Federal Reserve's monetary policy decisions will significantly impact the US dollar and, consequently, Bitcoin's price. If the Fed tapers QE more aggressively than anticipated, it could lead to a sustained weakening of the dollar, benefiting Bitcoin. However, a more hawkish stance from the Fed, including interest rate hikes, could dampen investor enthusiasm for riskier assets like Bitcoin.
• Global Macroeconomic Conditions: Global economic factors, such as geopolitical tensions and inflation levels, will also play a role in shaping Bitcoin's price. If these factors worsen, it could lead to a flight to safety, pushing investors towards traditional assets and away from Bitcoin.
Looking Ahead
The coming weeks and months will be crucial for Bitcoin. The cryptocurrency faces several challenges, but the recent positive momentum suggests that there is still significant upside potential. Investors should closely monitor US Federal Reserve policy decisions and global macroeconomic developments to gauge the sustainability of this rally.
Key Takeaways
• Bitcoin is experiencing a surge in price, breaking through resistance levels around $60,000.
• Strong US economic data has weakened the US dollar, benefiting Bitcoin.
• The rally is likely due to increased risk appetite as investors become more optimistic about the economic outlook.
• The sustainability of the rally hinges on factors like Federal Reserve policy and global macroeconomic conditions.
Disclaimer: This article is for informational purposes only and should not be considered financial advice. It is recommended to conduct your own research before making any investment decisions.

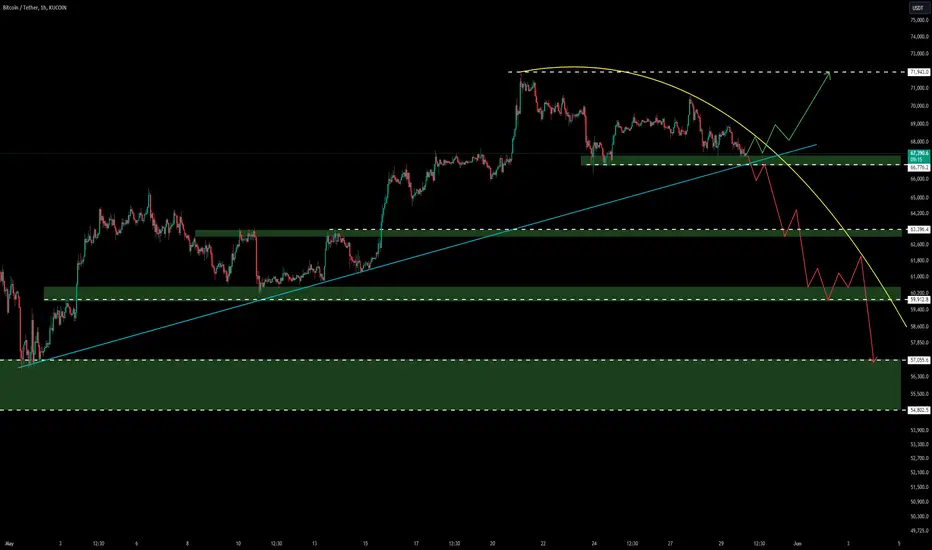
BTC Suprize Or Modification ? !Bitcoin at a Critical Juncture: Correction or Bullish Rebound?
Bitcoin finds itself at a pivotal moment, poised for either a substantial correction or a defiant surge that could defy expectations.
Scenario 1: Modification phase
In this scenario, Bitcoin could embark on a downward trajectory, potentially reaching $63,400 followed by $59,900, and ultimately aiming for a target of $57,000.
As evident from the chart, there are numerous support levels along the way, each with the potential to halt Bitcoin's descent and reverse its direction. However, the ultimate target remains $57,000, where a significant consolidation phase could ensue.
Scenario 2: Bullish Surprise
An alternative scenario presents a bullish surprise, where Bitcoin could consolidate around $66,700, gathering the necessary liquidity before making an unexpected move towards $68,900 and potentially reaching $72,000.
Your Perspective
Based on the current market dynamics and technical analysis, do you anticipate Bitcoin to take a short position or a long position?
Disclaimer:
It is crucial to emphasize that this analysis does not constitute financial advice. Cryptocurrency trading is inherently risky, and individuals should conduct thorough research and exercise due diligence before making any investment decisions.
Expired BTC.USD Weekly outlook. 5th WK MAY 2024Expired BTC.USD Weekly outlook. 5th WK MAY 2024
> BULLISH 📈 CORRECT
Closed Price: 68,547
Target Price: 70,547 | Strike Price: 70,576 MAY27 24'
Upper Range: 77,087
Lower Range: 64,008

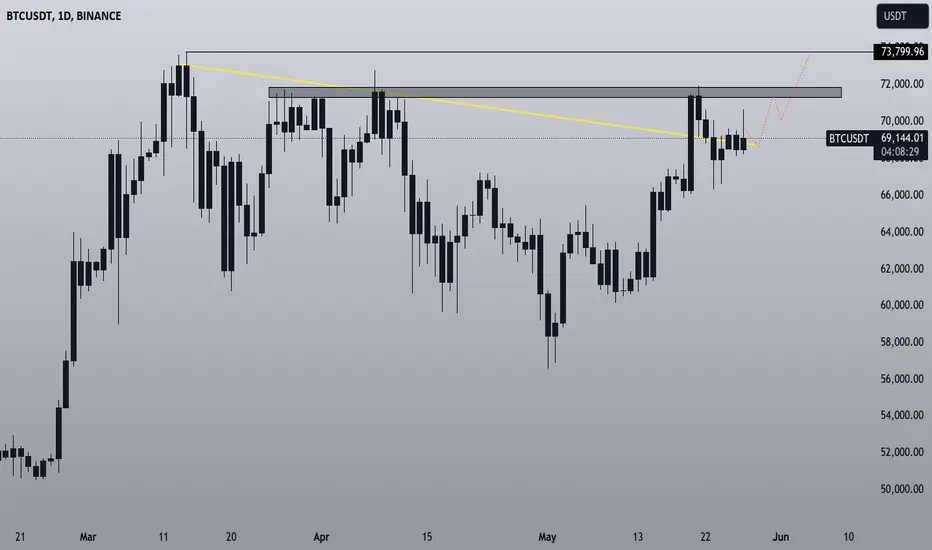
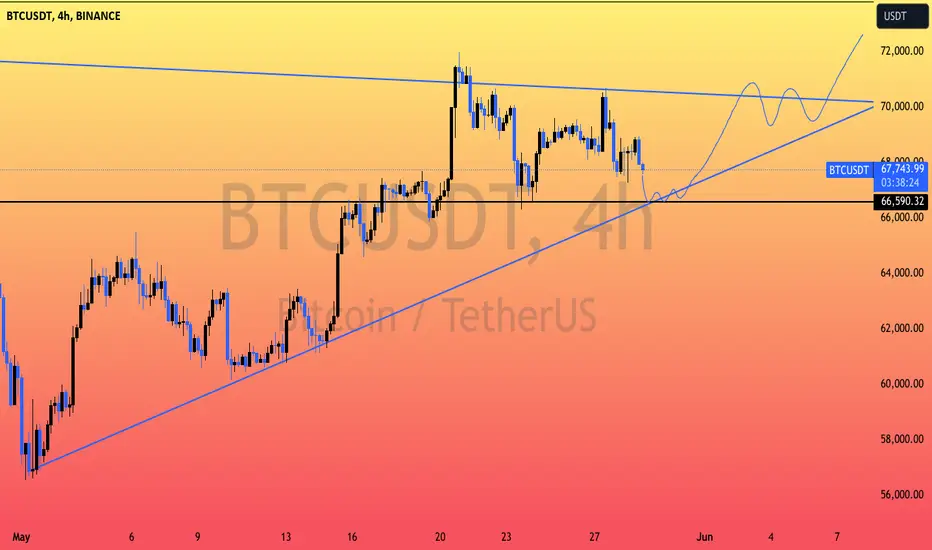
BTC ABOVE $70KTesting different chart colors, so a feedback is really usefull.
Now, let's check BTC chart. Price is moving inside two main trendline that are forming a triangle. I marked an important support level, the area ar $66.500. I think the price will range there before pushing to the upside, targeting the resistance zone above $71.000
#Bitcoin Daily Update!BTC/USDT Technical Analysis!
🔹 Current Price: $68,390
🔹 Strong Support: $62,433
🔹 Resistance: $73,000
BTC closed with a red daily candle at $68398 and is still trading sideways.
It recently broke out of a symmetrical triangle, indicating potential upward momentum. This sideways PA is the reason why Alst are breathing green.
Watch for a break above $73,000 for further gains towards $81,000.
If it falls below $66,400, it may retest $62,433 level.
dyor, nfa
#Crypto CRYPTOCAP:BTC #bitcoinalpha
Please hit the like button to support.
Thank you
#PEACE

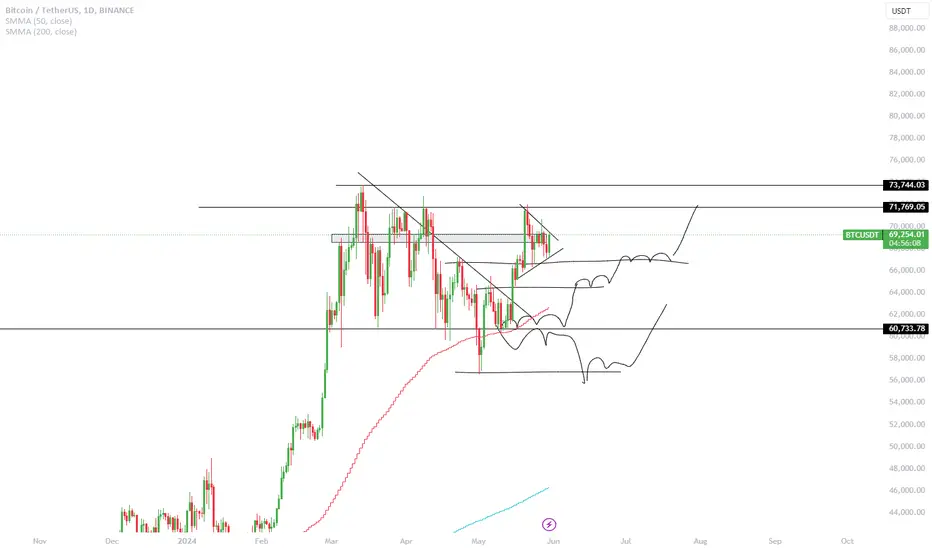
Spotting Bitcoin Bargains: Key Price Levels for Savvy InvestorsThe ever-volatile world of Bitcoin can be daunting for investors, especially when it comes to pinpointing the right moment to buy.
The $66,000 Threshold: A Potential Re-Test and Buying Zone
If the price dips below the $66000 level, it could trigger a further decline, potentially reaching the lower range of its recent consolidation period. This scenario, however, presents a prime opportunity for investors to accumulate Bitcoin at a potentially discounted price.
Beyond $66,000: $61,000 as Another Possible Entry Point
Analysts state Bitcoin could slide further, potentially reaching $61,000. This price point could represent another significant entry point for investors seeking to add Bitcoin to their portfolios.
By closely monitoring these price levels, particularly the potential support zones around $66,000 and $61,000, investors can potentially capitalize on market dips and acquire Bitcoin at a potentially lower cost. However, it's crucial to remember that these are just potential entry points, and the market can be unpredictable.
Dollar-Cost Averaging (DCA): A Sensible Strategy for Volatile Markets
While strategic buying based on price zones can be tempting, analysts advocates for a strategy called Dollar-Cost Averaging (DCA) during volatile periods. DCA involves investing a fixed amount of money into Bitcoin at regular intervals, regardless of the current price. This approach aims to average out the cost per Bitcoin over time, mitigating the risk of buying at a peak.
DCA is a prudent strategy, especially for those new to the cryptocurrency market or those who prefer a less hands-on approach. It removes the emotional element from investing and encourages a disciplined, long-term perspective.
Beyond Price Points: Additional Considerations for Bitcoin Investors
While price levels are a significant factor, they shouldn't be the sole consideration when buying Bitcoin. Investors should also consider the following:
• Overall market trends: Analyze the broader market sentiment and identify any potential bullish or bearish signals.
• Technical analysis: Utilize technical indicators to gain insights into potential support and resistance levels.
• Fundamental analysis: Evaluate the underlying factors driving the value of Bitcoin, such as adoption rate, regulations, and upcoming developments.
• Risk tolerance: Be honest about your risk tolerance and invest only what you can afford to lose.
The Final Word: Strategic Buying and a Long-Term Vision
Strategic buying based on price zones can be a valuable tool for investors seeking to maximize their returns on Bitcoin. However, it's crucial to combine this approach with a well-rounded investment strategy that considers market trends, technical analysis, and fundamental factors. Additionally, adopting a Dollar-Cost Averaging strategy can be a sensible way to navigate volatility and build a Bitcoin position over time.
Remember, Bitcoin is a highly volatile asset, and there's no guaranteed path to success. By combining strategic buying with a long-term vision and a well-defined risk management plan, investors can potentially increase their chances of profiting in the dynamic world of Bitcoin.
Mt.Gox Moves $7B BTC for Repayment Plans, Sparking BTC PlungeMt. Gox, the defunct Bitcoin exchange, has transferred over 107,000 CRYPTOCAP:BTC worth around $7 billion to an unknown address in thirteen transactions, possibly as part of a plan to repay creditors by October 31, 2024. The market reacted bearishly to these movements, with Bitcoin ( CRYPTOCAP:BTC ) dropping by 1.7% to as low as $67,680 after reaching a high of over $70,000 on Monday.
The first movement of assets from Mt. Gox's cold wallets in over five years and is likely a part of a plan to distribute the assets back to creditors before October 31, 2024. CryptoQuant head of research Julio Moreno said all coins have been transferred to a new address “1JbezDVd9VsK9o1Ga9UqLydeuEvhKLAPs6.” Alex Thorn, head of research at Galaxy, said most of the transferred bitcoin ( CRYPTOCAP:BTC ) would be held by creditors, instead of being sold on the open market.
Technically, Bitcoin ( CRYPTOCAP:BTC ) is in a consolidation zone as buyers are reacting to Mt. Gox repayments plans to the once defunct BTC Exchange. The Relative Strength Index (RSI) of 55.68 signifies CRYPTOCAP:BTC is poised for trend reversal in the long term.

Bitcoin is heading towards the moon
To the best of my understanding, I think
BTC is completing the fifth wave of the third wave of a five-wave rally (Wave 3 is still not complete).
MACD: Buy signal
HOLDING LIKE A PRO BTCBitcoin is holdin the price above a strong daily trendline, and this is extremely bullish. In my previous weekly setup, we longed BTC around $65.000, and i think we will go up more. The black rectangle i drawed is the last step to break before the new ATH, and i think we can see a retest of it probably next week. I am not sure we will break it so fast, we will probably range in the $71.000-67.000 area for a while before another leg up. Till $65.000 hold, we are safe