Bitcoin - Structure in Compression, Silence Before Expansion?⊣
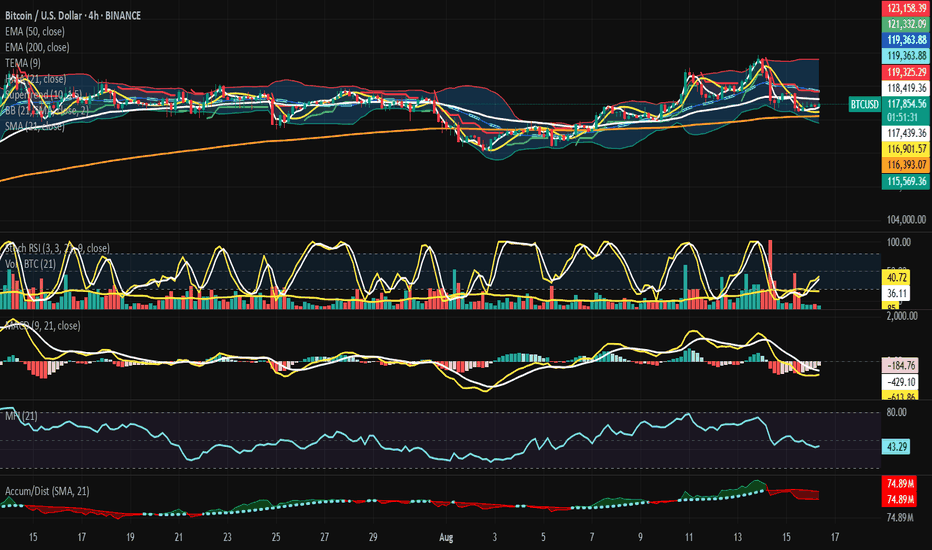
⟁ BTC/USD - BINANCE - (CHART: H4) - (Aug 16, 2025).
◇ Analysis Price: $118,020.60.
⊣
⨀ I. Temporal Axis - Strategic Interval - (H4):
▦ EMA50 - $118,425.87:
∴ The EMA50 is currently positioned slightly above the active trading price - ($118,020.60), establishing a localized resistance zone, showing that the market is struggling to sustain momentum above this median dynamic level;
∴ In recent sessions, price action fluctuated around EMA50, but failed to reclaim it as stable support, indicating weakness in short-term recovery attempts;
∴ The slope of EMA50 remains almost flat, not strongly ascending, suggesting market indecision and lack of directional strength.
✴️ Conclusion: EMA50 is a resistance barrier, neutral-to-bearish unless reclaimed decisively.
⊢
▦ EMA200 - $116,394.72:
∴ The EMA200, being a long-term stability reference, is below the current market price, acting as structural support for the mid-term;
∴ The wide gap between EMA200 and EMA50 indicates a neutral compression phase — price oscillating between medium and long horizons;
∴ If the market falls back toward EMA200, buyers may attempt defense; a breach would confirm broader weakness in market structure.
✴️ Conclusion: EMA200 is a strong support anchor, still intact, but tested boundaries are plausible.
⊢
▦ TEMA9 - $117,520.39:
∴ TEMA9 is below the current price, serving as immediate dynamic support, often used by short-term traders;
∴ Market bounces in the last sessions respected this fast-moving indicator, giving temporary confidence to bulls;
∴ However, repeated retests weaken its authority, showing fragility in momentum if volume does not sustain.
✴️ Conclusion: TEMA9 is immediate support, fragile, requiring reinforcement by volume.
⊢
▦ HMA21 - $116,919.69:
∴ The HMA21 lies under market value, acting as secondary support, confirming alignment with EMA200 as part of the supportive axis;
∴ Its curve is slightly ascending, signaling a faint bullish rebound in the short horizon;
∴ Alignment below price confirms resilience but also dependency - if price collapses, this level could break swiftly.
✴️ Conclusion: HMA21 is secondary support, dynamic yet vulnerable to volatility.
⊢
▦ SMA21 - $119,371.78:
∴ SMA21 sits above current price, working as resistance, in opposition to the supports listed (HMA21/TEMA9);
∴ This creates a compression corridor: TEMA9 + HMA21 (support) vs SMA21 (resistance);
∴ Market structure indicates stagnation inside a tight channel, waiting for breakout or breakdown.
✴️ Conclusion: SMA21 is resistance, framing the price in a boxed range.
⊢
▦ SuperTrend (10, 1.5) - $119,325.29:
∴ The SuperTrend remains above the actual price, signaling a bearish bias;
∴ Market action is still below its trigger, rejecting short-term bullish confirmation;
∴ Only a sustained breakout above this level could alter the bearish sentiment.
✴️ Conclusion: SuperTrend = Bearish stance remains active.
⊢
▦ BB (21, 2) - Upper: $123,154.36 / Basis: $119,371.78 / Lower: $115,589.21:
∴ Price is compressed between the midline (basis) and lower band, showing weakness;
∴ Recent volatility spikes touched the upper band but were rejected, confirming lack of strength;
∴ The narrowing of bands signals imminent expansion - market preparing for stronger volatility move.
✴️ Conclusion: Bollinger = Compression near lower range, potential breakout ahead.
⊢
▦ StochRSI (3, 3, 21, 9) - K: 44.11 / D: 37.23:
∴ Both K and D lines are mid-range, neither oversold nor overbought, reflecting indecision;
∴ The slight upward crossing indicates a possible rebound attempt, but weak until confirmed by momentum;
∴ Position in neutral zone diminishes conviction - signal could reverse quickly.
✴️ Conclusion: StochRSI suggests fragile recovery, neutral-to-bullish bias.
⊢
▦ Volume (21) - 9 / 85:
∴ Current volume is extremely weak compared to the SMA21, showing low conviction;
∴ This volume drought reduces the probability of sustainable breakouts;
∴ Whales or institutions are not actively engaged at this moment.
✴️ Conclusion: Volume shows lack of strength; market drifting without strong participation.
⊢
▦ MACD (9, 21, 9) - MACD: -170.26 / Signal: -425.48 / Histogram: -595.74:
∴ MACD remains negative, showing bearish underlying pressure;
∴ Histogram is contracting, indicating that bearish momentum is slowing down, but not reversed;
∴ A bullish crossover is still distant, weakening bullish recovery chances in near term.
✴️ Conclusion: MACD = Bearish pressure moderating, no reversal confirmed yet.
⊢
▦ RSI (21, 9) - 43.19:
∴ RSI is below 50, confirming bearish bias;
∴ Position not yet oversold, showing market retains room for further downside;
∴ The flat slope reflects indecision - neither strong selling panic nor buying force.
✴️ Conclusion: RSI = Bearish-neutral, momentum still under equilibrium.
⊢
▦ MFI (21) - 43.19:
∴ MFI mirrors RSI levels, confirming lack of strong inflow or outflow;
∴ Volume-weighted money flow confirms market neutrality, slightly leaning bearish;
∴ No divergence spotted to suggest imminent reversal.
✴️ Conclusion: MFI = Neutral, aligned with RSI weakness.
⊢
▦ OBV (21) - 74.89M:
∴ OBV is flat, not rising in accordance with recent small price upticks, showing lack of buyer confirmation;
∴ Absence of strong accumulation suggests price is rising on weak grounds;
∴ If OBV fails to climb, rallies will likely fail at resistance points.
✴️ Conclusion: OBV confirms weak demand, neutral-bearish stance.
⊢
🜎 Strategic Insight - Technical Oracle:
∴ The H4 structure reveals a compressed battlefield: dynamic supports (TEMA9, HMA21, EMA200) try to sustain price above $116K–117K, while layered resistances (EMA50, SMA21, SuperTrend, BB basis) weigh down overhead near $118K–119K;
∴ Volume collapse and flat OBV expose the fragility of bullish attempts, showing lack of participation. RSI and MFI align at ~43, signaling neutrality with bearish tilt. MACD remains negative, albeit moderating, hinting bearish exhaustion rather than reversal;
∴ Thus, BTC/USD stands in tense equilibrium: support corridor anchored near $116K, resistance dome at $119K;
∴ Market awaits volatility ignition, and the Bollinger Band squeeze warns a breakout is imminent;
∴ Without volume, upward attempts risk collapse; with momentum reactivation, resistance layers may fracture.
⊢
𓂀 Stoic-Structural Interpretation:
∴ The chart reveals not strength, but suspension - Bitcoin hovers between its moving average guardians, caught within corridors of compression where price neither collapses nor ascends with conviction;
∴ EMA50 denies passage above, while EMA200 anchors from below - structure is preserved not by will, but by inertia;
∴ Indicators whisper the same tale: RSI and MFI linger at 43, momentum without fire, money without decisive flow;
∴ MACD stays in the shadows, still negative, showing the bear’s hand loosening but not releasing;
∴ OBV remains flat, silence of accumulation, a desert where no buyer’s army marches;
∴ Bollinger Bands coil tighter, warning of the coming storm - when silence stretches, force prepares.
✴️ Stoic Arcane Conclusion: The market does not yield to hope nor despair, it waits - stillness before expansion. To the disciplined observer, this is not chaos, but structure: a narrowing gate where patience is the true weapon.
⊢
✦ Structure:
∴ The H4 battlefield is confined within a narrow dominion - ($116,000 to $119,500) - where supports (TEMA9, HMA21, EMA200) forge the lower bulwark, and resistances (EMA50, SMA21, SuperTrend, BB Basis) construct the ceiling;
∴ Momentum oscillators (RSI, MFI, StochRSI) hover in neutrality, neither signaling exhaustion nor ignition, mirroring the market’s stoic posture;
∴ MACD remains submerged in negative territory, its histogram contracting, a sign of fading bearish strength but absent bullish conquest;
∴ Volume and OBV betray the truth: demand is hollow, accumulation is absent, and rallies lack the blood of conviction;
∴ Bollinger compression seals the chamber, a tightening coil foretelling release - structure bends, not breaks, awaiting its destined expansion.
✴️ Structural Seal: The architecture is one of suspended energy, a locked formation where silence is not weakness, but the breath before eruption.
⊢
· Cryptorvm Dominvs · MAGISTER ARCANVM · Vox Primordialis ·
· Dominivm Cardo Gyratio Omnivm · Silence precedes the next force. Structure is sacred ·
⊢
Btcusdneutral
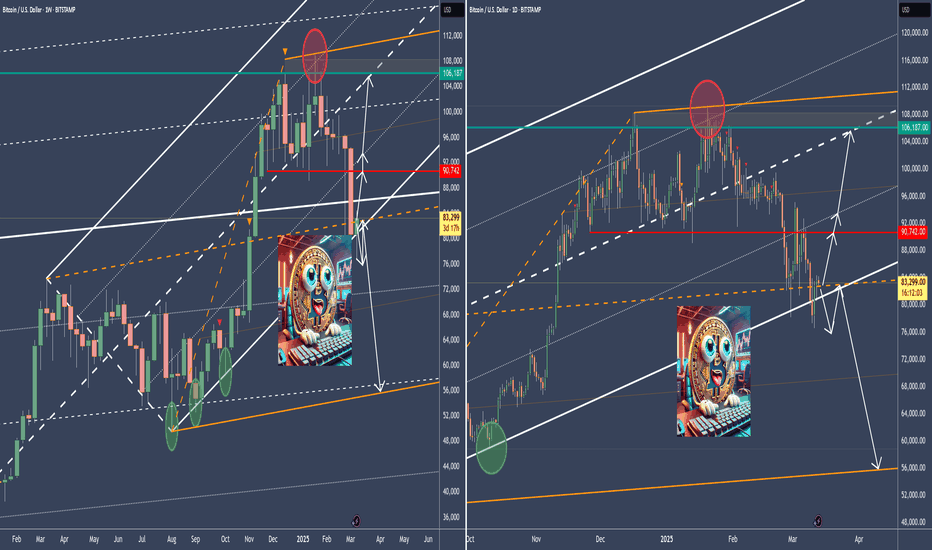
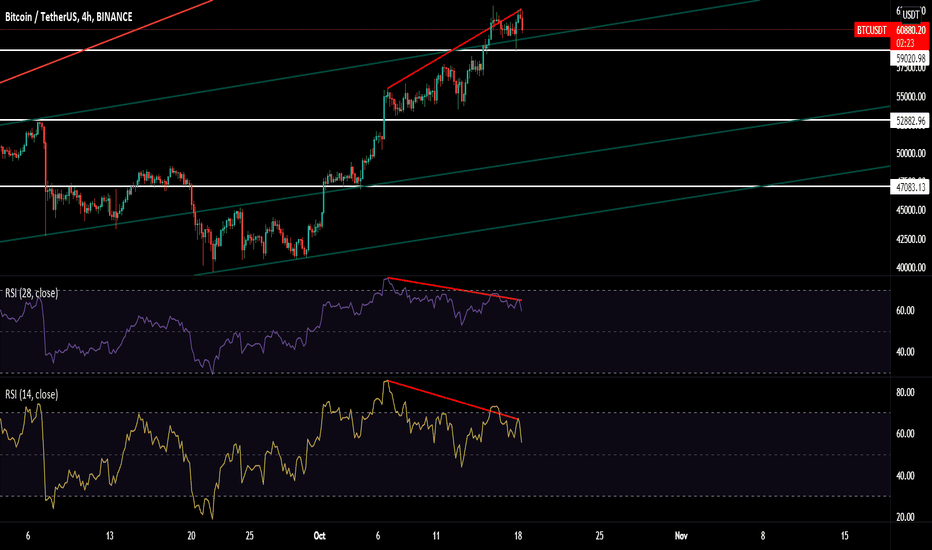
BTCUSD - Decision Time.As we see, price is at the white L-MLH.
This is a critical level.
On one hand, price showed weakness.
On the other hand, price is stretched to the downside, bearing the possibility to shoot upwards from here.
How can we find out what's happening?
By observation and NOT ACTING!
Just watch, observe, and a good entry Long or Short will uncover. FOMO is your greatest Enemy!
Calm down, wait for the sweet Fruits that will be given to you. §8-)
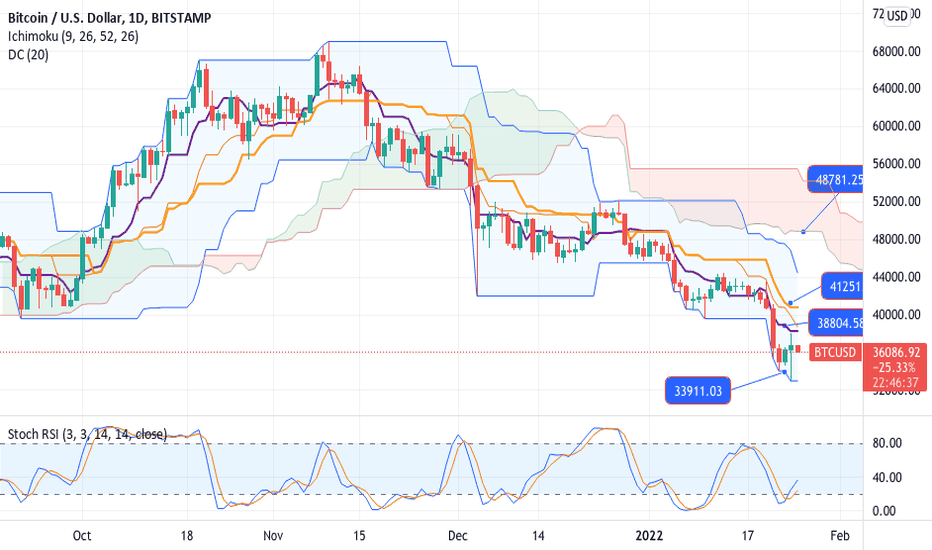
BTCUSD-NEUTRAL downside biasI am not committing to any crypto. The idea of it being a safe heaven conflicts with what it is.
The reason it is up here, that stories are stating that Russia has invested in it to safeguard themselves. Maybe true so let's see.
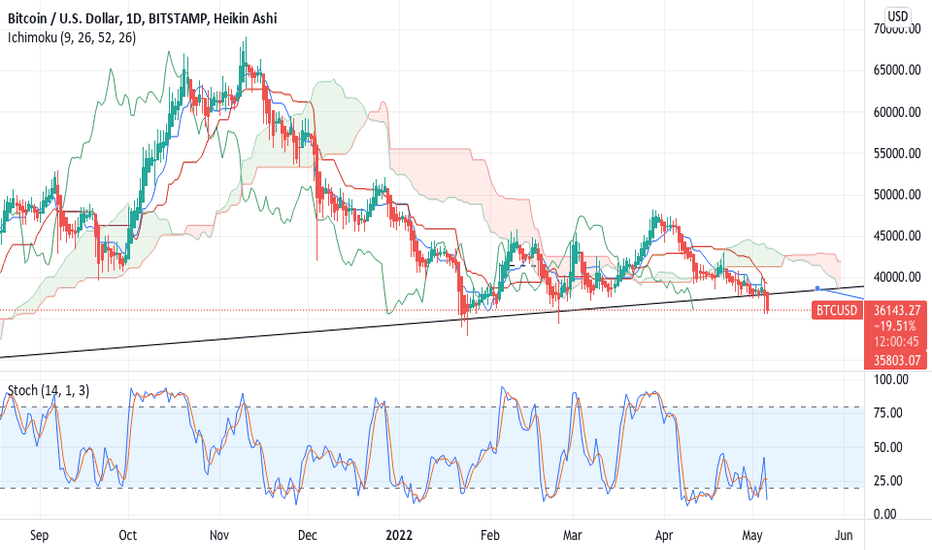
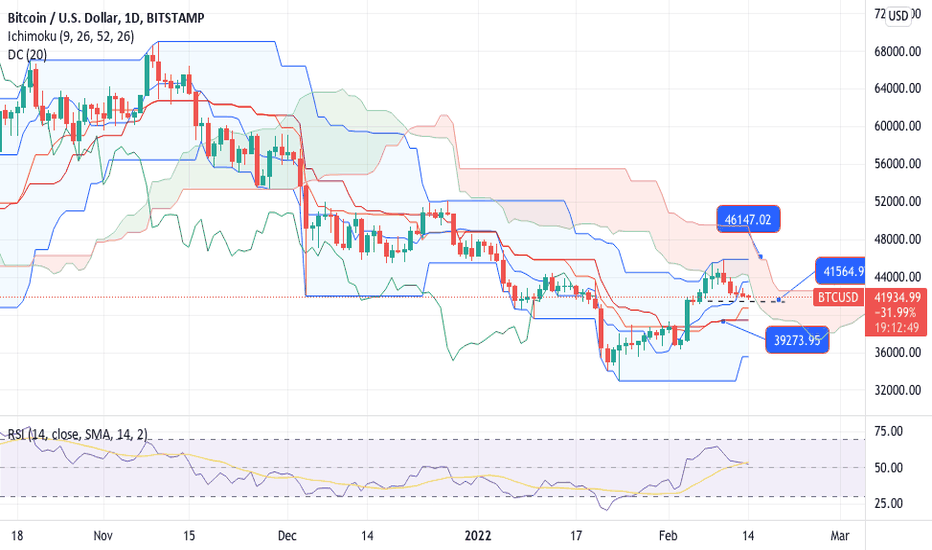
For now I feel the strategy is SELL current for a move back to $ 32,500. the stochastic is high up and RSI is high, but not extreme though. I feel more confident being short then long to be honest. The supp0rt is $ 42,500 right now.
BTCUSD-NEUTRAL We got a rounded top forming, and neckline around $ 41,500. It feels we may see much lower again, perhaps $ 32,000 again, but for now prefer neutral stance and watch it. After all, we were short before and took back, and now sit back.
Once I feel it makes sense will make a new update.
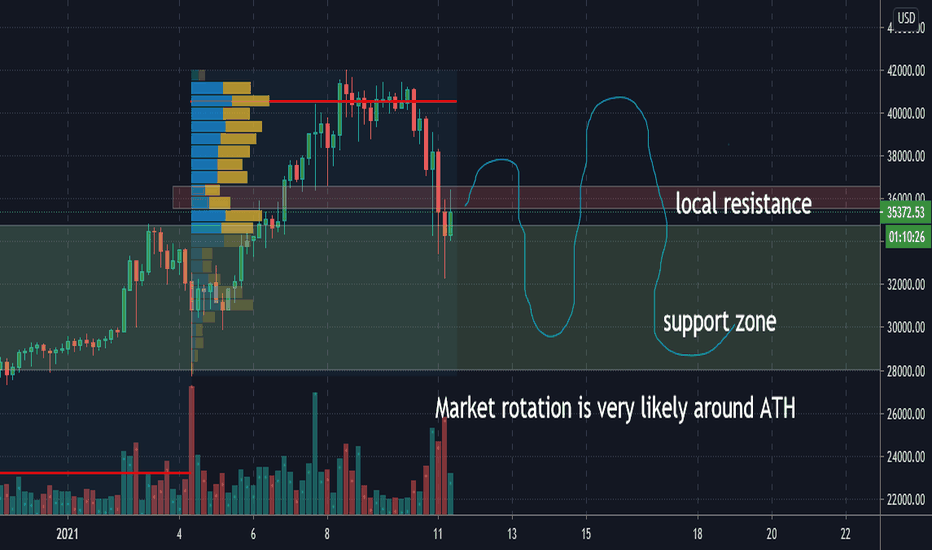
BTCUSD-NEUTRAL likely going higherUp to now am not committed to a view to trade. The issue is the wide ranges, and also the deep pockets needed associated with creating profitable trades.
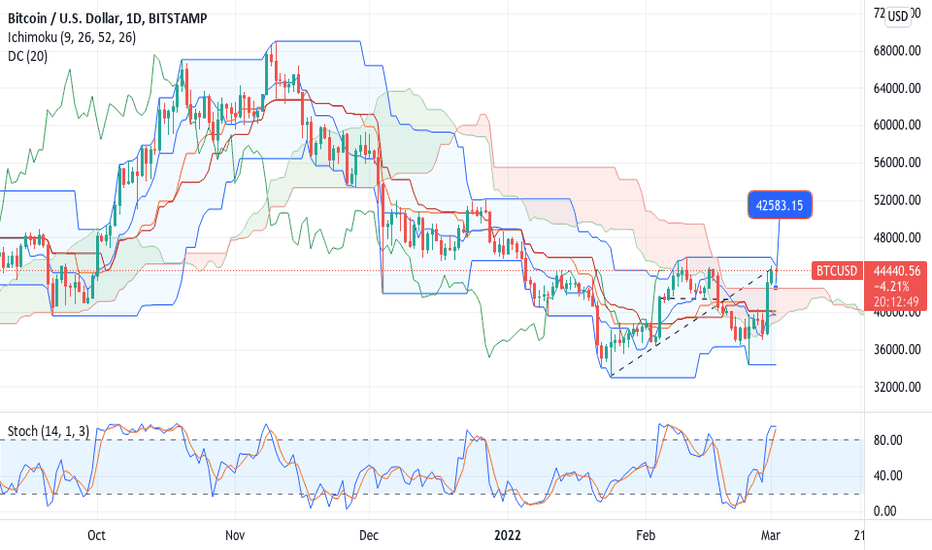
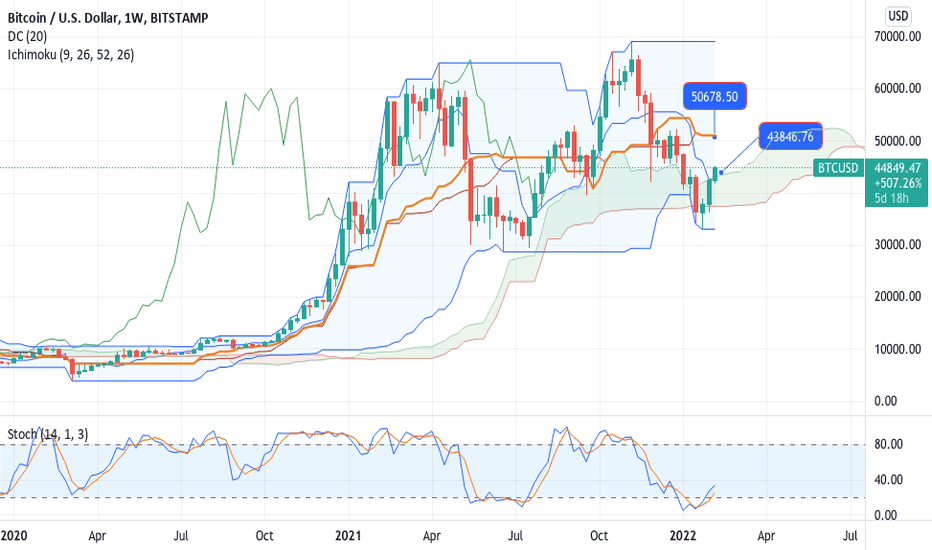
Currently we are break above $ 43,900 weekly chart cloud resistance, and this may ignite further buying towards $ 50,000. Once we are reaching those levels I would start feeling confident in selling it again.
The $ 42,500 - 43,500 suggestion to sell was for those venturing, and as mentioned I was not one of them expressing only my opinion. The market is lack of liquidity and not much volume may cause it to swing either way. Even when it starts looking positive, as it is now, it may turn again due to liquidations.
The medium-term picture is rather SELL much higher and an eventual move to $ 5,000 ($ 10,000) area, which most people will not agree being possible. Anyway, it is a technical forecast and anything can happen in the real world.
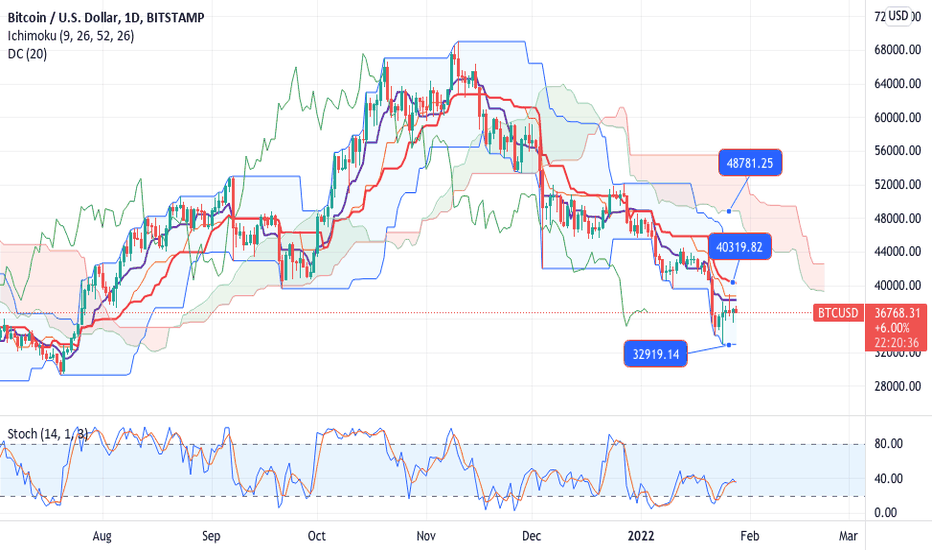
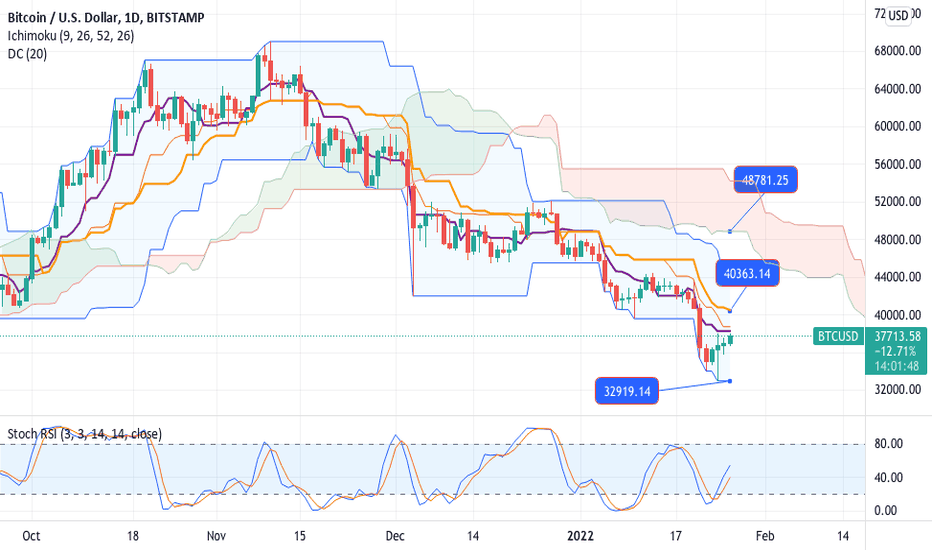
BTCUSD-Neutral buy at lower levelsI ave liquidated at $ 36,300 and will re-establish lower buy between $ 33,500-34,500 once again.
Right now, we have climbed back nicely and it had the benefit sought for.
The stochastic is positive and still feel we may have a run up higher, but the $ 3,000 up move from the lows is enough for now in terms of corrective action.
will update once I see further developments.
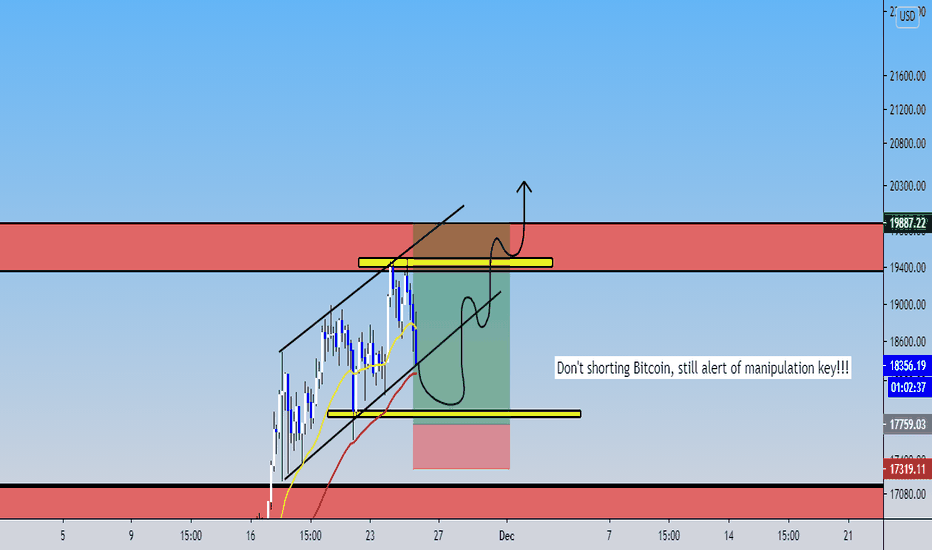
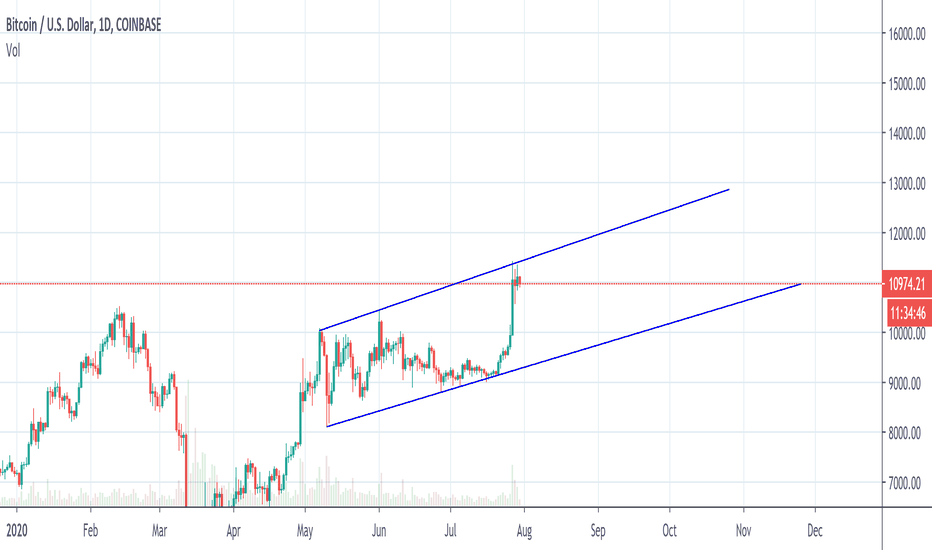
Bitcoin into this bearish flag; How to trade this charist?So, in this analysis, we see in H4 that Bitcoin it's still in range, but maybe we could see any manipulation zone that we can't to entry in short position. Beware of the market trap and hunters manipulation if you short Bitcoin, until Bitcoin doesn't break down the $17,900 USD, I can't to shorting Bitcoin, but in that case if Bitcoin make successful to break down the $17,900 USD. We can to trade it. At the moment, the market is lateral, and to trade it, we would need to know how the manipulation occur.
So, the most important it's to take any plan to be prepared, so, I following the trend on Bitcoin and it's bullish. So, in case that Bitcoin break up the $19,500 USD approximately, we can to entry in long position in that position.
So, the most inteligent it's to awaiting that Bitcoin goes to the $17,900 USD to open up a long position or still consolidate in this range!!!
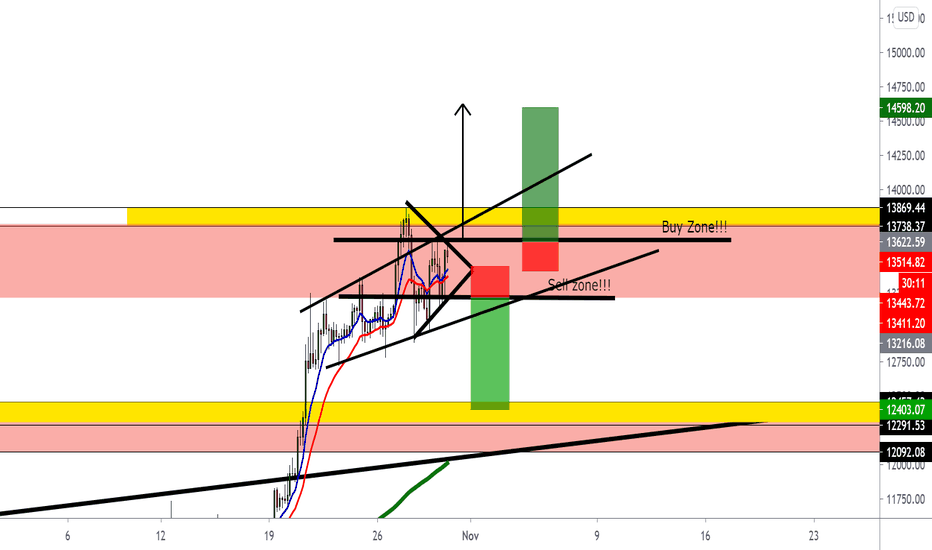
Bitcoin still neutral into this simetric triangle; but like bearSo, I consider that Bitcoin is in the volatile and warning zone that Bitcoin still it above of $13,000 USD.
But, if you're not prepare, we would need to see in weekly timeframe and right now, we see in the highly zone that obviously we would need to make a correction toward the $12,400 USD as I say you. Once that Bitcoin it's going with the parabolic up, Bitcoin would need a descense of the price to steady between the supply and demand!!!
I do not trade Bitcoin until I see a movement, so Bitcoin is neutral!!!. But in weekly, I hope that pass it in my model of my chart.
We could see a possible correction, in Daily we see a bearsh candlestick and the yesterday, the candlestick closed up with a indecision form. That could be a possible correction, also that in 2 ocassion we see a drop!!!
BTCUSD First option !ANALYTICS
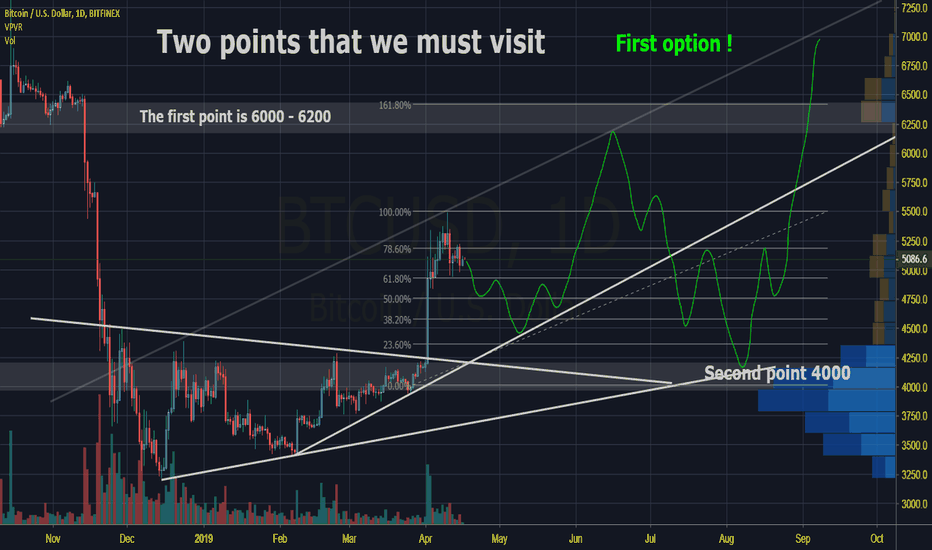
Bitcoin billionaire Zhao Dong predicts stagnation around $ 4,000 and $ 6,000
The famous Chinese bitcoin billionaire and trader Zhao Dong shared with Weibo his thoughts on the current state of the crypto market. Zhao is sure that the bear market has not ended, and that the recent Bitcoin rally does not say anything.
According to Zhao, bitcoin is likely to trade in a relatively narrow range, between $ 4,000 and $ 6,000 for several months, although many view this as a “take-off” for the main cryptocurrency. He predicts that there will hardly be low minimums, and that the market will remain unchanged for six months, although recovery may begin in October. It is not the first time when Zhao declares that cryptographic games will be relatively calm, and that almost all of 2019 will be like “cryptozyme.”
It is also noteworthy that Zhao Dong predicts a “crypto-summer” in 2021, when, according to him, Bitcoin will rise to $ 50,000.
BTCUSD BTCUSD
- BTCUSD broke down in a failed setup, buy orders were not triggered
- Had a small hedge short that was triggered when structure was invalidated but sold at 7k
- BTCUSD could now trade within the range of a previous funnel
- hopefully will lead to another setup with a probable bear bias
All in all, reiterates to me the importance of getting into trades using pre set orders as last few setups have gone against me but no money lost because of it.
The hedge against BTC on the other hand, was more of a gamble on that if the setup failed 7k would be a likely target.
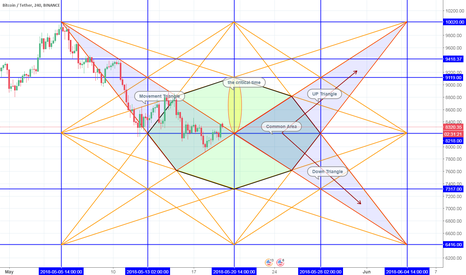
BTC will go to 10K or 6.4K !! Current Price 8350In times like now there is no indication the market is up or down. " I can expect that the probability of going down is about 70% "
I will share with you another pattern that i always consider it as a very important indication for me.
this will be the second secret i share in this community.
First secret was about the killing point. You can see it in my last posts
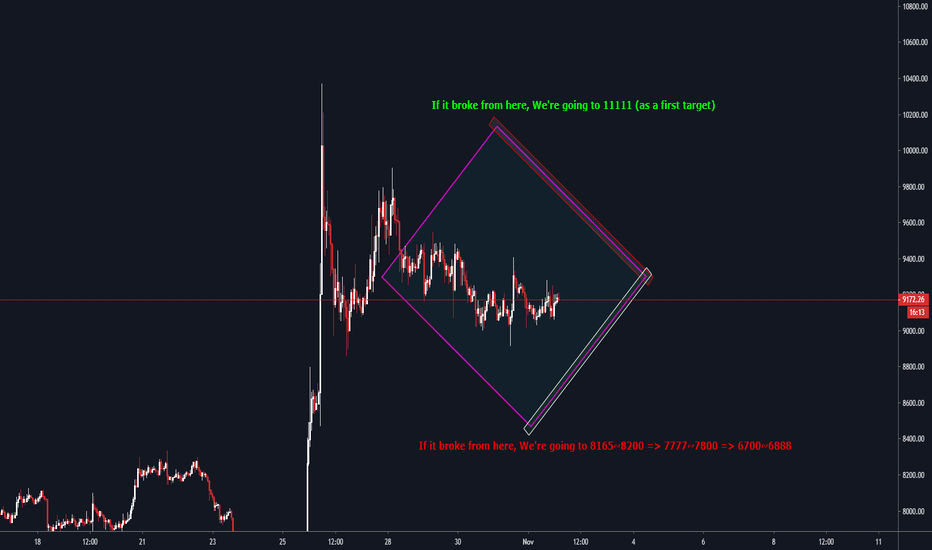
Can you see the left Movement triangle that has just broken ?
I can expect that the right side will form the same pattern and the triangle from left will be reflected in the right side.
The problem is that, it will take the upper triangle and move up to 9.1K then 10K or will move down to 7.3K then 6.4k ?
For me i have added @ 8200 and 7950 as per my last post and i will get out @ the mentioned critical time "or before it by one or two hours"
the problem is about the common Area between the 2 triangles, you couldn't define it will go up or down until you see a specific pattern.
So after the price enter the common area we have to monitor the price behavior,
If price is going in the up triangle then we are going to 10Ks
If price is going down in the down triangle then we are going to 6.4K
the problem if the price will go from the middle zone then you couldn't know the behavior until you make another analysis, but most probably it will fluctuate between 7300 and 9120 until it breaks up or down.
_______________________
In conclusion, I will close my positions at the critical time and watch the pattern and decide the direction before and at 28/5.
Till now i'm neutral and i have to watch the price closely in next days.
Stay tuned for updates
_______________________
Questions are welcome
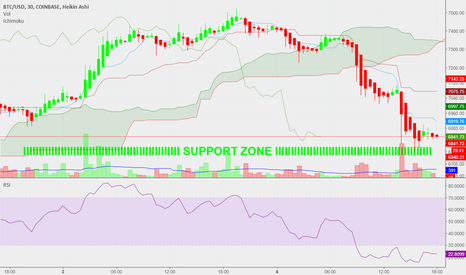
BTCUSD Neutral ShortNew support zone for BTCUSD @ 6800. If the support breaks, new support @ 6400 ( see ).
BTCUSD is clearly bearish but the immediate trend could go either way.
I can see a sea of whales.
Never underestimate the ability for a bear to turn into a bull and the other way around.
One wave at a time.
DON'T APPLY ANYTHING I WRITE.
