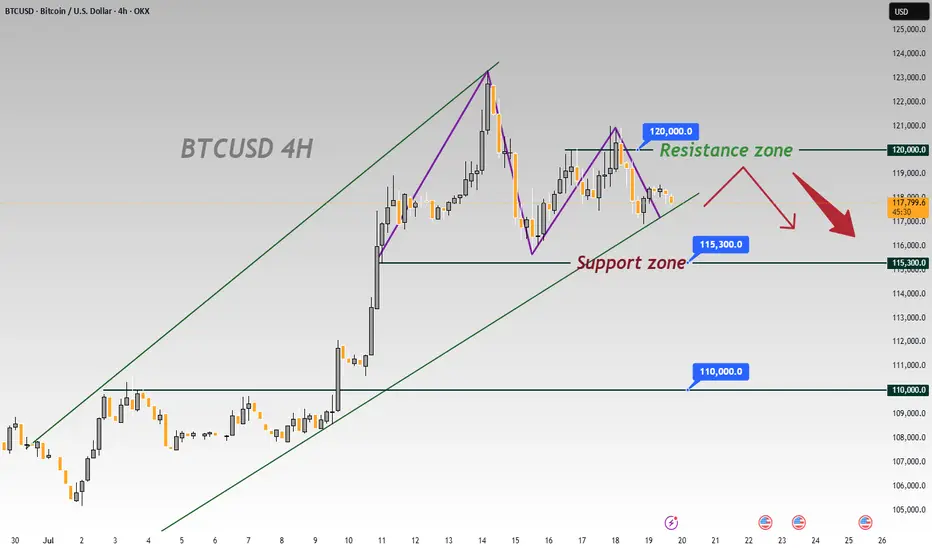
BTCUSD 4-Hour Chart Analysis: Range-Bound Trends & Key LevelsFrom the 4-hour chart of BTCUSD, the recent price movement shows obvious range-bound characteristics 📊. The upper zone around 120000 forms a key resistance level 🛑, where the bullish momentum has waned after encountering resistance 💨.
The lower level of 115300 is a significant support zone 🛡️. Previously, there was some buying support when the price retraced to this zone 👀. However, as the current price is pulling back from the resistance zone ↘️, if the bearish force takes the lead subsequently 🐻, the possibility of breaking below the 115300 support will increase ⬆️. Once it breaks below effectively 💥, the next key support level of 110000 will most likely become the target for the price to decline towards 🎯.
In terms of the short-term trend 📈, due to the obvious suppression from the resistance zone 🚧, the price will most likely continue the rhythm of testing the support downwards 🔽. In operation, one can pay attention to the breakdown situation of the support zone and layout trades accordingly 📝. Meanwhile, be alert to the possibility of a rebound after the price finds support in the support zone 🚀, and further confirmation of the direction needs to be combined with real-time K-line patterns 📊, trading volume 📈
🚀 Sell @119500 - 118500
🚀 TP 116500 - 115500
Accurate signals are updated every day 📈 If you encounter any problems during trading, these signals can serve as your reliable guide 🧭 Feel free to refer to them! I sincerely hope they'll be of great help to you 🌟 👇
Btcusdsell
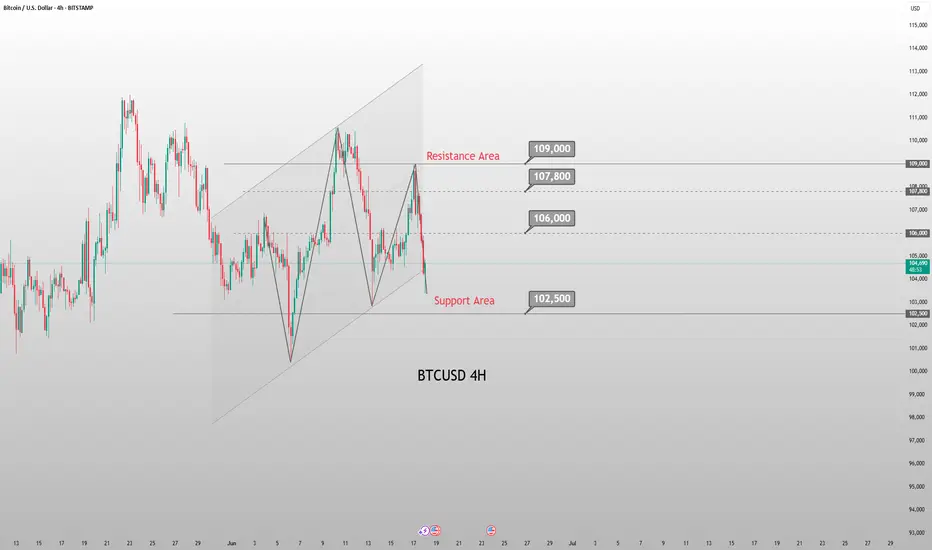
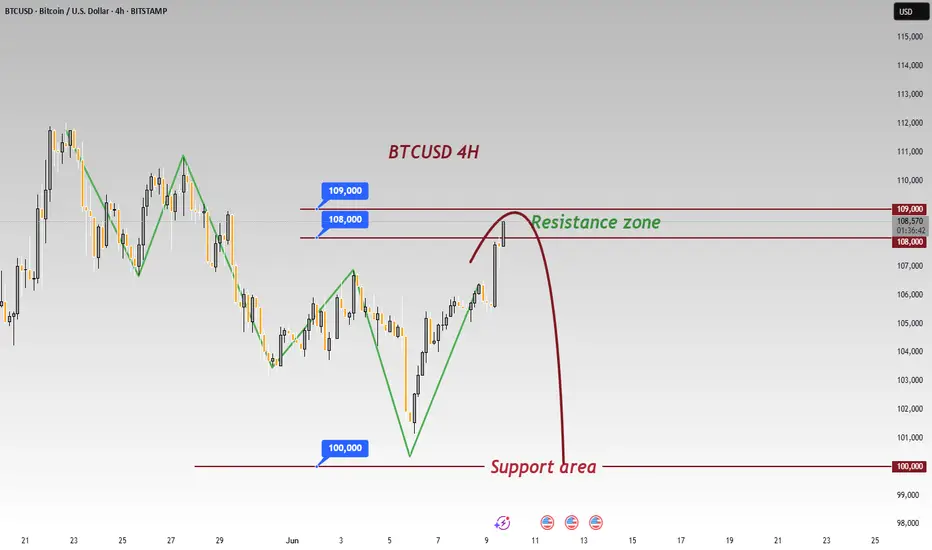
Weekend BTC Trend Analysis and Trading SuggestionsLet's review this afternoon's market performance. The BTC price, as we anticipated, rebounded to around 109,000 in the afternoon before plummeting sharply. Living up to "Black Friday", this violent drop was well within our expectations. In the afternoon's live trading, we also reminded everyone that as long as there was a rebound to the upper zone, it was a good opportunity to go short. This drop has created a space of nearly 1,500 points. Currently, the BTC price has pulled back to around 107,800.
From the current 4-hour K-line chart, after a strong upward surge, the market encountered significant resistance near the upper track of the Bollinger Bands. As bullish momentum gradually faded, the price started to come under pressure and decline, suggesting that the short-term upward trend may come to a temporary halt. At present, the market has recorded multiple consecutive candlesticks with large bearish bodies. The price has not only effectively broken below the key support level of the Bollinger Bands' middle track but also caused the Bollinger Bands channel to switch from expanding to narrowing, indicating that market volatility is decreasing. In terms of trading volume, it showed a moderate increase during the price pullback, which further confirms the authenticity of the bearish selling pressure.
BTCUSD
sell@108000-1085000
tp:107000-106000
Investment itself is not the source of risk; it is only when investment behavior escapes rational control that risks lie in wait. In the trading process, always bear in mind that restraining impulsiveness is the primary criterion for success. I share trading signals daily, and all signals have been accurate without error for a full month. Regardless of your past profits or losses, with my assistance, you have the hope to achieve a breakthrough in your investment.
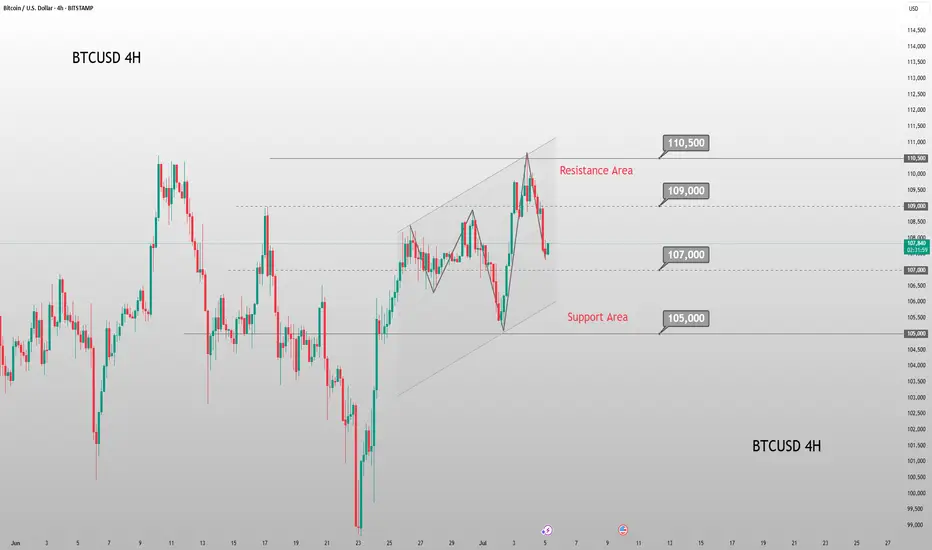
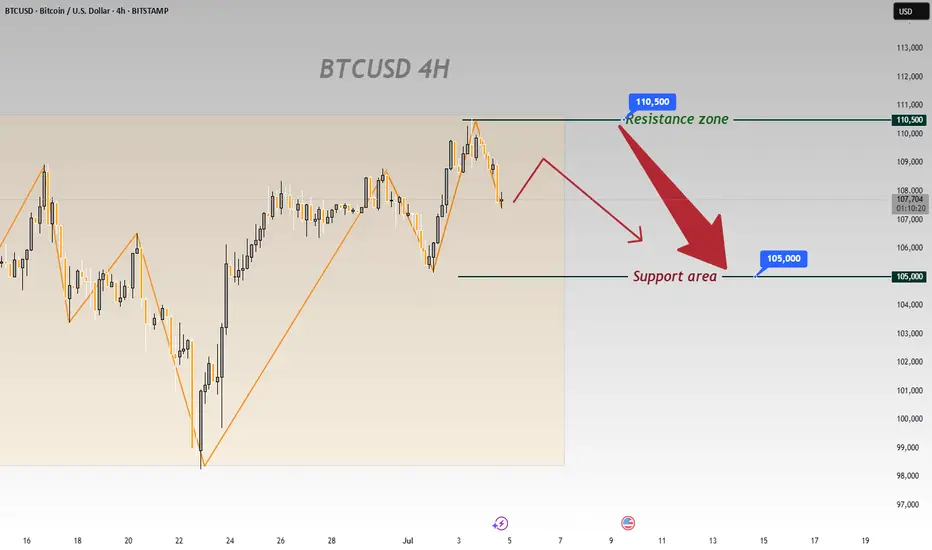
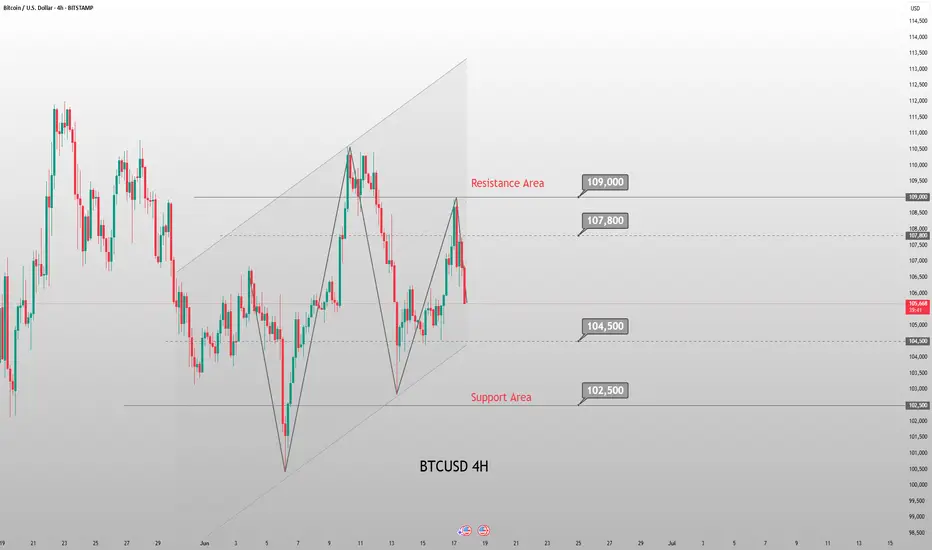
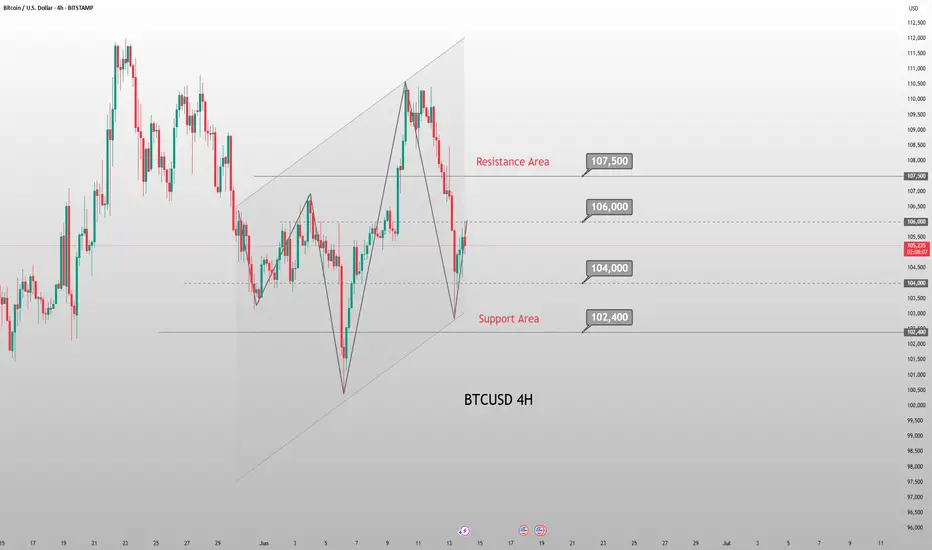
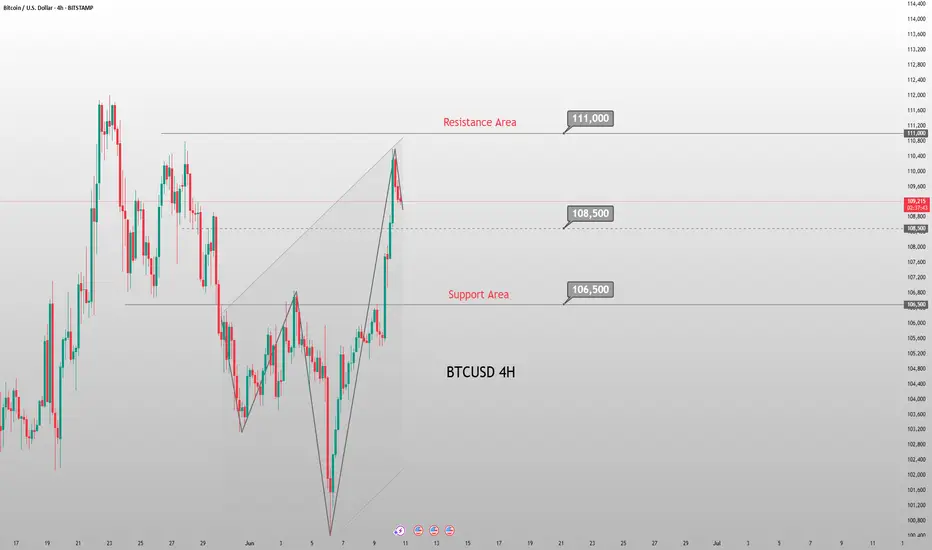
On BTCUSD’s 4 - hour chart, downside risks prevailOn BTCUSD’s 4 - hour chart, downside risks prevail:
Resistance Holds
Price failed to break 110,500, showing strong selling pressure that caps bulls 🚫. A pullback is likely.
Downtrend Signals
Post - resistance, price is retracing. Candlesticks and chart arrows point to a drop toward 105,000 support, fueled by building bearish momentum ⬇️.
Support Test Looms
105,000 is the next key level 🔑. Even if support slows the fall, the setup favors downside—bullish reversals seem unlikely after resistance failure.
Trend Weakness
Orange trendlines show the prior uptrend is fragile 🧊. Failing at 110,500 signals fading bullish force, setting up for a bearish correction.
In short, the 4 - hour chart is bearish. Watch for drops to 105,000; 110,500 will likely block bulls 🛑. Trade cautiously with this bias.
🚀 Sell@108500 - 107500
🚀 TP 106500 - 105500
Accurate signals are updated every day 📈 If you encounter any problems during trading, these signals can serve as your reliable guide 🧭 Feel free to refer to them! I sincerely hope they'll be of great help to you 🌟 👇
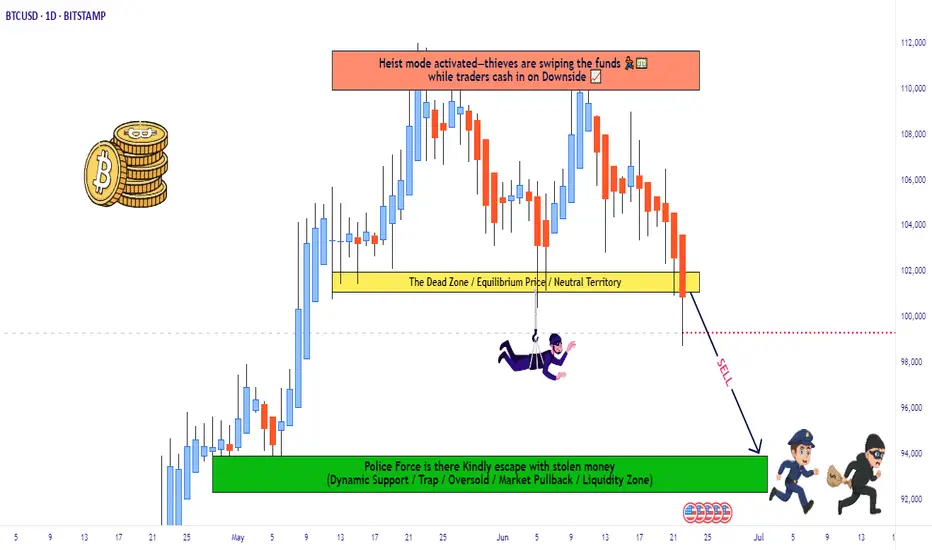
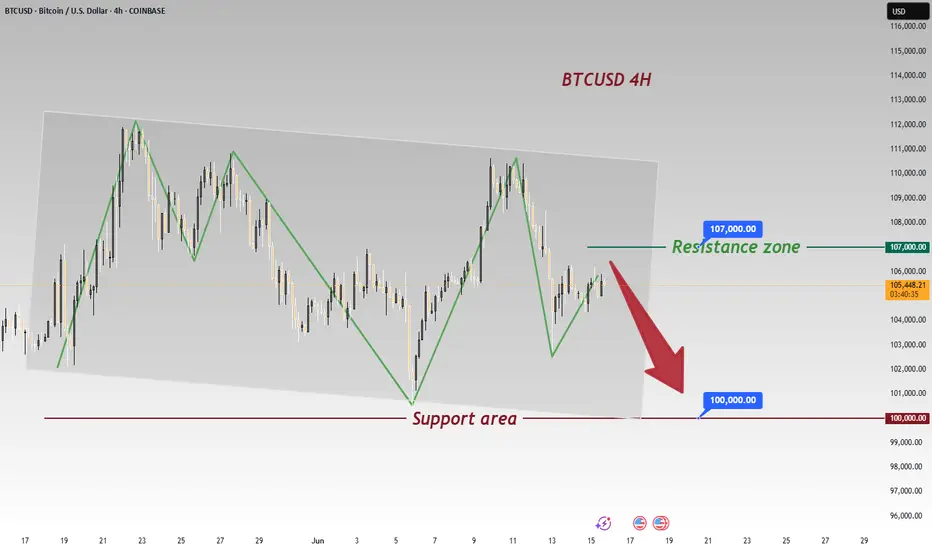
Thief Trader Setup: Robbing the BTC/USD Market Reversal🏴☠️💰 Bitcoin Heist Blueprint: BTC/USD Robbery Plan by the Thief Trader Crew 💰🏴☠️
(Swing & Day Trade Outlook – Clean Entry, Clean Exit, No Fingerprints Left Behind)
🌟 Hi! Hola! Ola! Bonjour! Hallo! Marhaba! 🌟
To All Market Raiders & Silent Money Makers 🤑💸💰✈️
This isn't your average BTC/USD analysis — this is a strategic market heist, crafted from the Thief Trading Playbook.
We're planning a clean operation based on both technical setups and fundamental awareness.
Let’s enter smart, exit faster, and leave no trace — just profit. 🏆
🎯 THE GAME PLAN: Unlocking the BTC/USD Vault
📈 Entry – “The Vault’s Cracked Open!”
The plan kicks off with retest entries on the 15 or 30-minute chart.
Sell limits should be placed around recent highs or lows where market momentum pulls back.
Precision and patience are your tools.
🛑 Stop Loss – Backup Escape Route
Use the 1D swing high/low (e.g., 104.500) as your SL zone.
Position size smartly, factoring in risk %, lot size, and number of active orders.
🏁 Target – 94.000 (Or Bail Out Before It Gets Hot)
Don’t stick around too long — cash out near the zone or before if price slows or traps emerge.
Secure the bag, vanish before resistance bites back.
🧲 Scalpers – Quick In, Quick Out!
Stick to the short side only — short the bounces, trail your SL, and move with stealth.
Big players can strike straight; others can shadow the swing crew and trail behind with protection.
🧠 Why This Works – Market Pulse
BTC/USD is facing overbought pressure, consolidation traps, and is nearing a critical MA Zone where reversals tend to form.
Momentum shows signs of weakening, and the bears are regrouping — that’s where we slip in and out.
Supporting Factors Include:
Macro trends
Fundamental sentiment
COT positioning
On-Chain signals
Intermarket flow
Key psychological levels
🔍 All these build the narrative behind this bearish setup. This is more than just price action — it's a calculated move.
⚠️ Trading Risk Alert: Stay Off the Radar During News Drops 📰🚨
Avoid new entries during major news events — increased volatility = increased risk.
Use trailing stop-losses to lock in profits while staying protected during spikes.
❤️ Like the Plan? Power the Crew!
If this setup helped you see the market differently, hit the 💥Boost Button💥.
Every like supports the effort and helps sharpen our future plans.
Trade with style, move with purpose — Thief Trader Style.
🚀 Stay tuned for the next setup from the shadows. Until then — stay sharp, stay strategic, and always protect your profits. 🐱👤💰📉📈
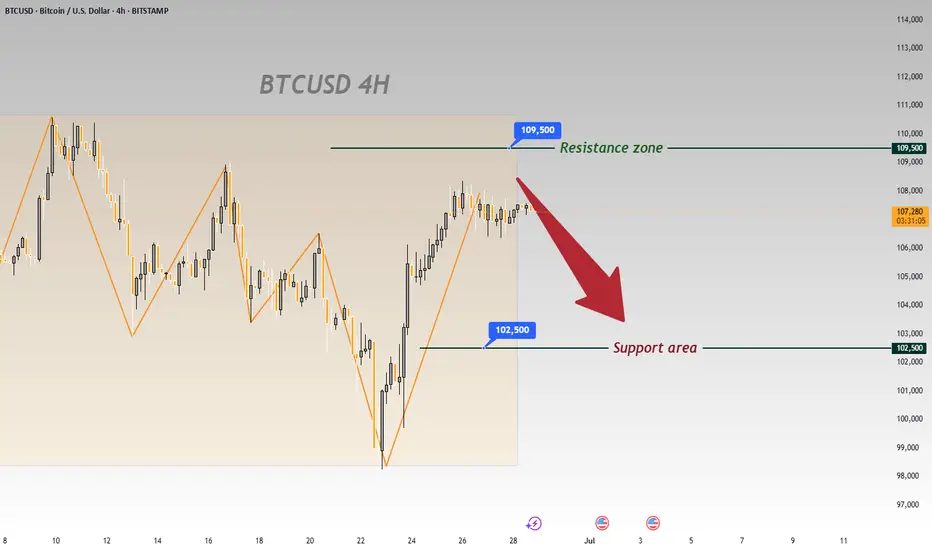
BTC Slumps Below 100000, Rebounds to Test 109500 Short Zone💎 BTC Rebounds After 100000 Drop, Eyes Short at 109500 Resistance 📊
BTC dipped below the 100000 threshold 🔻 before rebounding near 98000 🔺—a move tied to DXY weakness and easing geopolitical tensions. Now challenging the 110000 mark 🔼, it faces stiff resistance at 109500. First-time 110000 tests often spark pullbacks, making shorts the favored play here 📉.
🚀 Sell@108500 - 107500
🚀 TP 106500 - 105500
Accurate signals are updated every day 📈 If you encounter any problems during trading, these signals can serve as your reliable guide 🧭 Feel free to refer to them! I sincerely hope they'll be of great help to you 🌟 👇
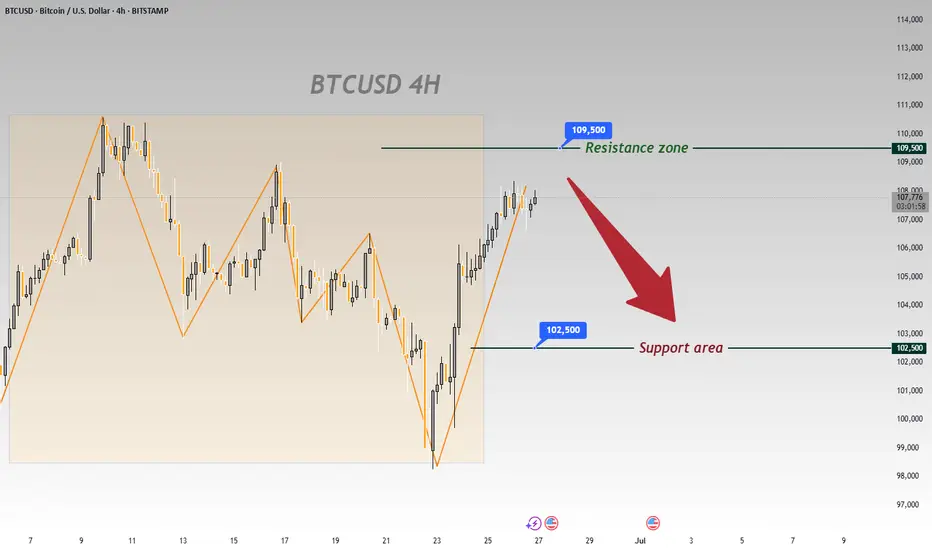
BTC Rebounds After 100000 Drop, Eyeing Short at 109500 Resistanc📈 BTC Rebounds After 100000 Drop, Eyeing Short at 109500 Resistance
BTC dropped below the 100000 threshold 🔻 and then rebounded near 98000 🔺. This movement is related to the decline of DXY and the reduction of geopolitical risks. Now, BTC is challenging the 110000 level 🔼. The overhead resistance is around 109500. First - time tests of the 110000 level typically trigger pullbacks, so we favor short positions here 📉
🚀 Sell@109500 - 108500
🚀 TP 107500 - 106500 - 105500
Accurate signals are updated every day 📈 If you encounter any problems during trading, these signals can serve as your reliable guide 🧭 Feel free to refer to them! I sincerely hope they'll be of great help to you 🌟 👇
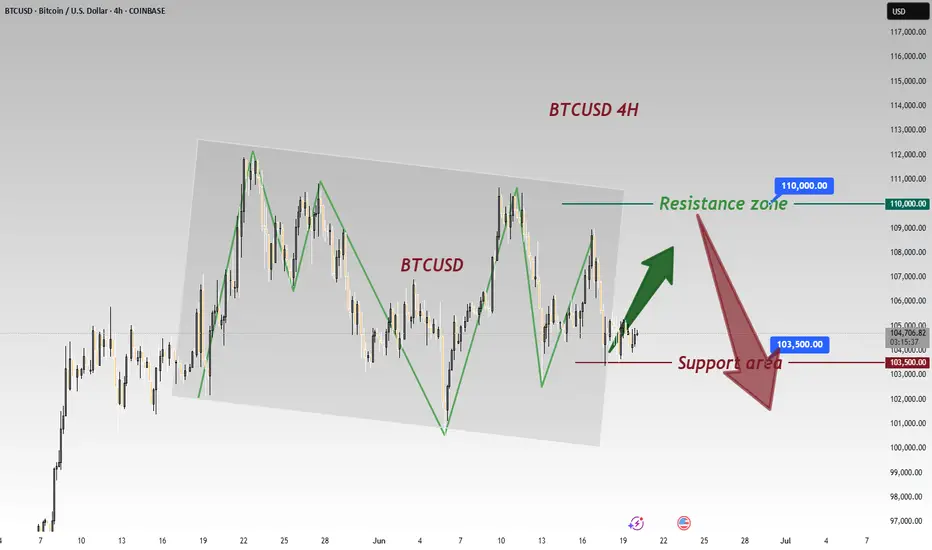
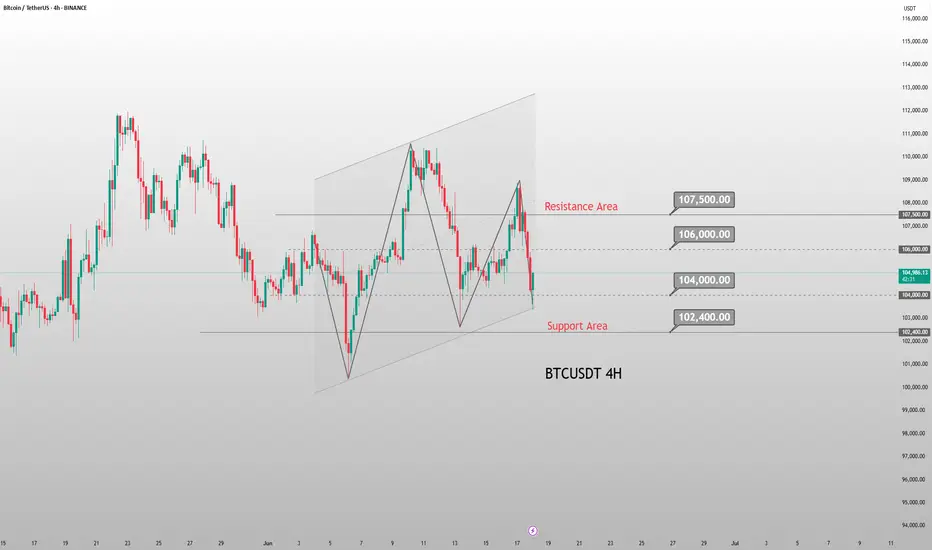
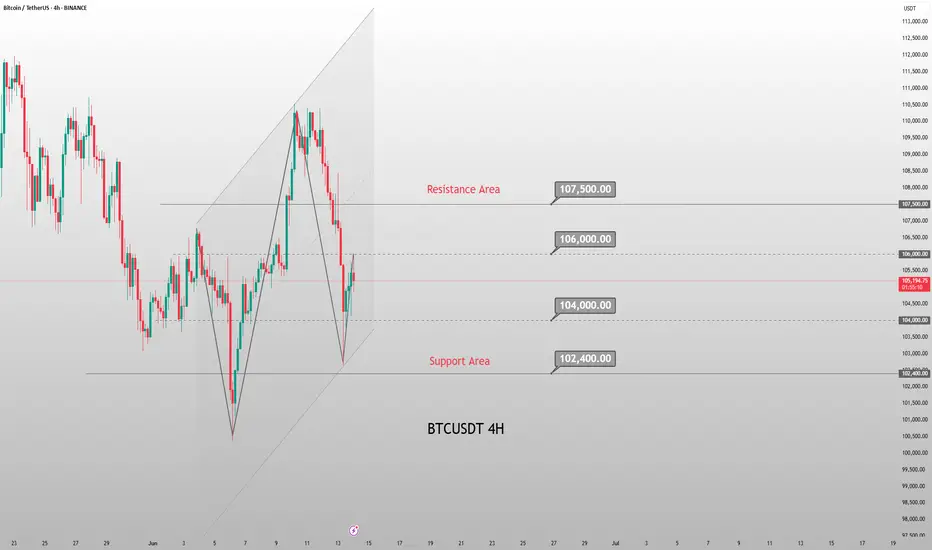
BTCUSD 4-Hour Chart Analysis: Range Bound with Bearish BiasFrom the 4 - hour chart of BTCUSD, the price movement shows obvious range - bound fluctuation characteristics 📊.
Currently, it is necessary to focus on the key resistance and support zones 🎯:
From a technical perspective, BTC is likely to oscillate repeatedly within the range in the near term 🔄, yet the overall trend leans bearish 🐻.
In the short term, opportunities for buying low and selling high within the range can be monitored 📈📉
⚡️⚡️⚡️ BTCUSD ⚡️⚡️⚡️
🚀 Sell@106500 - 105500
🚀 TP 104500 - 103500
🚀 Buy@102500 - 103500
🚀 TP 104500 - 105500
Accurate signals are updated every day 📈 If you encounter any problems during trading, these signals can serve as your reliable guide 🧭 Feel free to refer to them! I sincerely hope they'll be of great help to you 🌟 👇

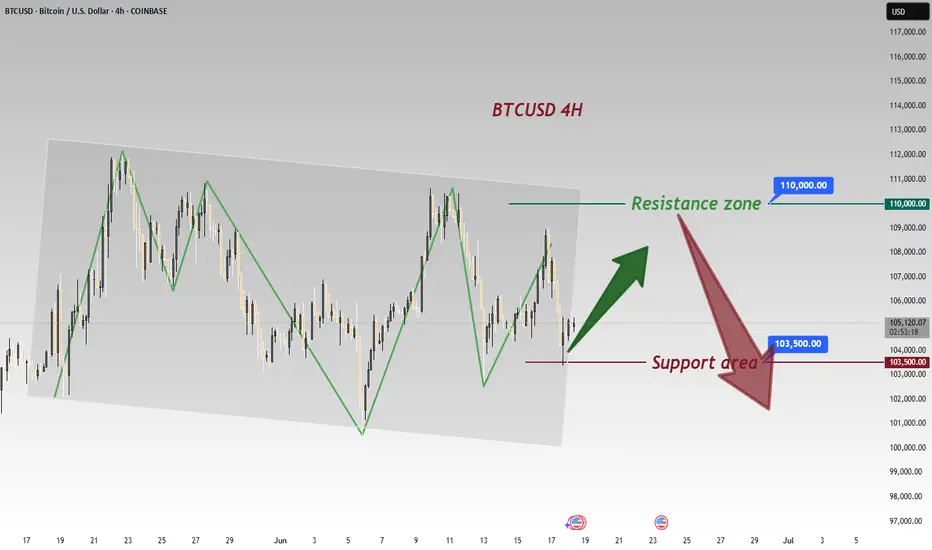
BTC Consolidates 104000-105000: Bearish Breakdown Looming?BTC Technical Update: Bitcoin has been consolidating within the 104000-105000 range for an extended period, with the overall trend showing a downward bias. With the overall trend tilting bearish, traders should watch for a break below 103500 to confirm the next leg down. 📉
⚡️⚡️⚡️ BTCUSD ⚡️⚡️⚡️
🚀 Sell@ 105000 - 104500
🚀 TP 102500 - 101500
Accurate signals are updated every day 📈 If you encounter any problems during trading, these signals can serve as your reliable guide 🧭 Feel free to refer to them! I sincerely hope they'll be of great help to you 🌟 👇
Current BTC Trend Analysis and Trading RecommendationsToday, U.S. markets are closed, leading to light trading activity and relatively limited overall market volatility. From a technical analysis perspective, the 4-hour K-line chart currently shows prices trading below the middle band of the Bollinger Bands, exhibiting a classic range-bound consolidation pattern. Bulls and bears are locked in a tug-of-war between key support and resistance levels, with K-line formations alternating between bullish and bearish patterns.
In terms of chart structure, the lower support zone has demonstrated strong buying conviction, while the upper resistance level has exerted clear restrictive force. Multiple failed upward breakouts have formed a short-term top. This box consolidation—characterized by resistance above and support below—is expected to sustain sideways trading through Friday.
Against the backdrop of no major positive catalysts, bearish momentum may gradually dominate if no substantial bullish triggers emerge. Maintain a trading strategy of selling into strength.
BTCUSD
105000-105500
tp:104000-103000
Investment itself is not the source of risk; it is only when investment behavior escapes rational control that risks lie in wait. In the trading process, always bear in mind that restraining impulsiveness is the primary criterion for success. I share trading signals daily, and all signals have been accurate without error for a full month. Regardless of your past profits or losses, with my assistance, you have the hope to achieve a breakthrough in your investment.

BTCUSD Analysis UpdateBTC/USD Analysis Update 📈
Bitcoin has rebounded successfully after touching the 103500 support level and is currently trading around 105500. However, the ongoing correction may continue to test the psychological support at the 100000 round number in the short term ⚠️.
Key Points:
Support Bounce 🎯: BTC found buying interest at 103500, in line with our previous strategic analysis.
Immediate Resistance 📉: The current rebound faces direct resistance near 106000 (200-hour moving average).
Downside Risk 📉: Failure to hold above 105000 could trigger another decline toward 100000.
Risk Management:
Long positions should set stop-loss below 103000 ⛔️.
Short entries may consider the 106000–107000 range, targeting 102500 and 100000
⚡️⚡️⚡️ BTCUSD ⚡️⚡️⚡️
🚀 Buy@ 102500 - 103500
🚀 TP 106000 - 106500
🚀 Sell@ 106000 - 106500
🚀 TP 103500 - 101500
Accurate signals are updated every day 📈 If you encounter any problems during trading, these signals can serve as your reliable guide 🧭 Feel free to refer to them! I sincerely hope they'll be of great help to you 🌟 👇
Current BTC Trend Analysis and Trading RecommendationsThe daily candlestick chart of BTC shows a three - day consecutive bearish retracement, having fallen back to the vicinity of the starting point of the previous pinbar rebound and currently remaining in a recent low - level sideways consolidation zone. However, the 4 - hour trend is pressured by the middle band of the Bollinger Bands, staying within a downward channel and forming a rebound - retracement wave pattern.
For short - term strategies, anticipate a further retracement first. Long positions should be initiated only after the support level is confirmed valid. This retracement represents a necessary consolidation phase before the bullish trend continues, and the current adjustment range does not pose a substantial threat of trend reversal to the overall uptrend. With the core upward trend intact and the direction remaining clear, BTC is expected to resume its upward momentum after a brief consolidation. The operational approach remains to go long on retracements.
BTCUSD
buy@103500-104000
tp:105500-106500
Investment itself is not the source of risk; it is only when investment behavior escapes rational control that risks lie in wait. In the trading process, always bear in mind that restraining impulsiveness is the primary criterion for success. I share trading signals daily, and all signals have been accurate without error for a full month. Regardless of your past profits or losses, with my assistance, you have the hope to achieve a breakthrough in your investment.
BTC Trend Analysis and Trading Recommendations for TodayThe BTC market continues its sideways-down trend, with notably insufficient rebound momentum during the session. Although there were brief signs of stabilization in the early trading, bearish forces continued to exert pressure during the European session, and the index showed a staircase decline.
From the 4-hour chart analysis, the price once fell to touch the middle Bollinger Band support during the Asian session, followed by a technical rebound. However, the rebound strength was obviously weak, encountering strong resistance near the middle band. The current candlestick pattern presents a typical Dark Cloud Cover, the MACD indicator continues to release volume below the zero axis, with fast and slow lines in bearish alignment.
Technically, the price remains significantly pressured near the middle band, and the US session is likely to extend the existing downtrend. Investors are advised to maintain a bearish stance. If the price effectively breaks below the middle band support, the next target is targeted at the lower Bollinger Band. Strategically, fading rallies remains the preferred approach.
BTCUSD
sell@106500-106000
tp:105000-104000
Middle East Tensions Drive Capital Shift: BTC May Test 100K SupCurrently, we can clearly see that BTC is in a downward trend 🔻. Due to the tense situation in the Middle East 😰, a large amount of capital has flowed into gold and crude oil markets. BTCUSD is likely to continue its downward movement on Monday ⬇️. Let's focus on the support level at 100,000. If it breaks below 100,000, it may continue to decline ⚠️.
⚡️⚡️⚡️ BTCUSD ⚡️⚡️⚡️
🚀 Sell@ 106500 - 105500
🚀 TP 102000 - 101000
Accurate signals are updated every day 📈 If you encounter any problems during trading, these signals can serve as your reliable guide 🧭 Feel free to refer to them! I sincerely hope they'll be of great help to you 🌟 👇
BTCUSDT Trend Analysis and Trading RecommendationsToday's overall BTC market rebounded after hitting a low of 102,614 in the early trading session, with Bitcoin's price maintaining a slow upward trend throughout the day. The intraday high reached 105,912 but encountered resistance. As the weekend approaches, historical market data shows limited volatility during weekends, so range-bound fluctuations are expected for the weekend.
From the current overall market rhythm, the price has rebounded slightly today after the previous decline. The hourly chart shows consecutive upward candles, though the price movement remains relatively slow. As time progresses, the price is expected to sustain an upward trend after pullbacks, and breaking through the short-term resistance level is only a matter of time. In terms of short-term structure and pattern, despite slight resistance and minor pullbacks, the downward momentum has weakened. We can still focus on long positions at lower levels, paying attention to the 106,000 resistance level.
BTCUSD
buy@104000-104500
tp:106000-107000
Investment itself is not the source of risk; it is only when investment behavior escapes rational control that risks lie in wait. In the trading process, always bear in mind that restraining impulsiveness is the primary criterion for success. I share trading signals daily, and all signals have been accurate without error for a full month. Regardless of your past profits or losses, with my assistance, you have the hope to achieve a breakthrough in your investment.
Current BTC Trend Analysis and Trading RecommendationsToday's overall BTC market rebounded after hitting a low of 102,614 in the early trading session, with Bitcoin's price maintaining a slow upward trend throughout the day. The intraday high reached 105,912 but encountered resistance. As the weekend approaches, historical market data shows limited volatility during weekends, so range-bound fluctuations are expected for the weekend.
From the current overall market rhythm, the price has rebounded slightly today after the previous decline. The hourly chart shows consecutive upward candles, though the price movement remains relatively slow. As time progresses, the price is expected to sustain an upward trend after pullbacks, and breaking through the short-term resistance level is only a matter of time. In terms of short-term structure and pattern, despite slight resistance and minor pullbacks, the downward momentum has weakened. We can still focus on long positions at lower levels, paying attention to the 106,000 resistance level.
BTCUSD
buy@104000-104500
tp:106000-107000
Investment itself is not the source of risk; it is only when investment behavior escapes rational control that risks lie in wait. In the trading process, always bear in mind that restraining impulsiveness is the primary criterion for success. I share trading signals daily, and all signals have been accurate without error for a full month. Regardless of your past profits or losses, with my assistance, you have the hope to achieve a breakthrough in your investment.
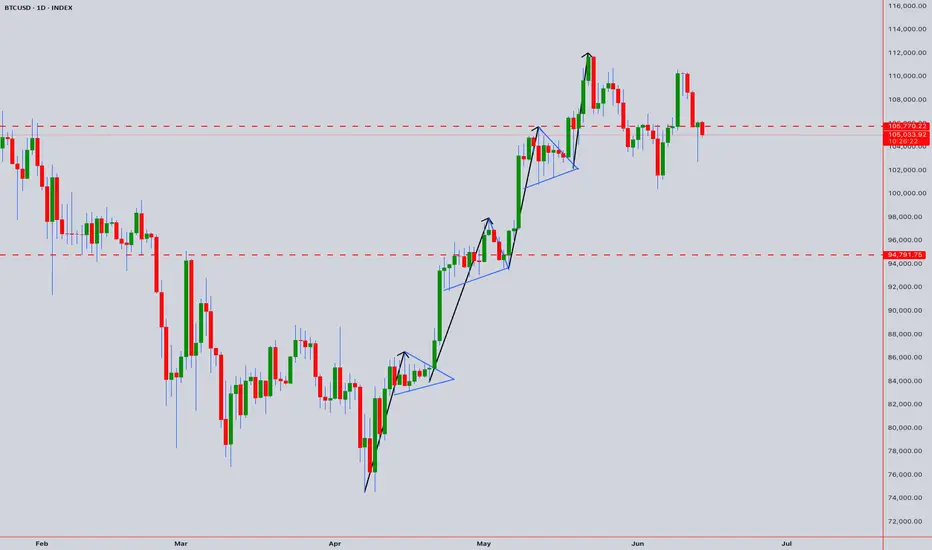
BTCUSD: Decoding the Price Action Through "Tape Reading"🚀 BTCUSD: Decoding the Price Action Through "Tape Reading" 🚀
Hey Traders,
Let's dive into a "tape reading" analysis of BTCUSD, breaking down the recent price movements and looking ahead. We've seen some fascinating patterns emerge, and understanding them could be key to our next moves.
🔍 A Look Back: The Bullish Flag Formations 🔍
Our journey begins on April 7th, 2025, with the establishment of a strong "Flag Pole" at $74,489.00. This was supported by a robust double bottom, setting the stage for what was to come.
First "Flag" Confirmation: We saw the first "Flag" form, confirmed by a powerful "Hammer" candle on April 20th, 2025. This Hammer, with its unique "bottom-less Marubozu" body, signaled significant underlying strength.
Second "Flag" Confirmation: Another "Flag" emerged, solidified by strong multi-day bottom support around $94,791.00. This resilience suggested continued upward momentum.
The Breakout: On May 8th, 2025, BTCUSD surged, breaking out of its previous patterns and entering a new "flag pole" formation.
Third "Flag" & All-Time High: May 15th, 2025, brought the third "Flag" formation, again supported by a "Hammer" and a bullish Marubozu. This momentum culminated in a breach of the $105,770.00 multi-month price level on May 20th, 2025, breaking the previous all-time high from December 17th, 2024! We then rocketed to a new all-time high of $112,000.
📉 Recent Developments: The Downtrend and Key Levels 📉
Since the all-time high, we've started to experience a shift:
Downtrend Begins: A downtrend initiated around May 22nd, 2025.
High-Low Formations: We observed a second high-low formation on May 27th, 2025, followed by another on June 9th, 2025.
Double Top & Hanging Man: A clear double top formation emerged, further supported by a "Hanging Man" candle on June 10th, 2025.
🔮 What's Next? The Critical Close 🔮
Today's candle close is absolutely paramount! As of now, the candle is still forming, but my current read suggests a potential move to fill the wick of the June 13th, 2025, "Hammer" candle.
The direction BTCUSD takes – North or South – will largely be dictated by how today's candle closes. This will be our prime dominant signal.
Monthly Candle Perspective:
Interestingly, the Monthly candle is showing similar "Flag" patterns. Check out the chart here for a broader perspective:
Let me know your thoughts in the comments below! Are you seeing the same patterns?
Trade safe!
_________________________________________________________________________________
⚠️ Disclaimer: This post is educational content and does not constitute investment advice, financial advice, or trading recommendations. The views expressed here are based on technical analysis and are shared solely for informational purposes. The stock market is subject to risks, including capital loss, and readers should exercise due diligence before investing. We do not take responsibility for decisions made based on this content. Consult a certified financial advisor for personalized guidance.
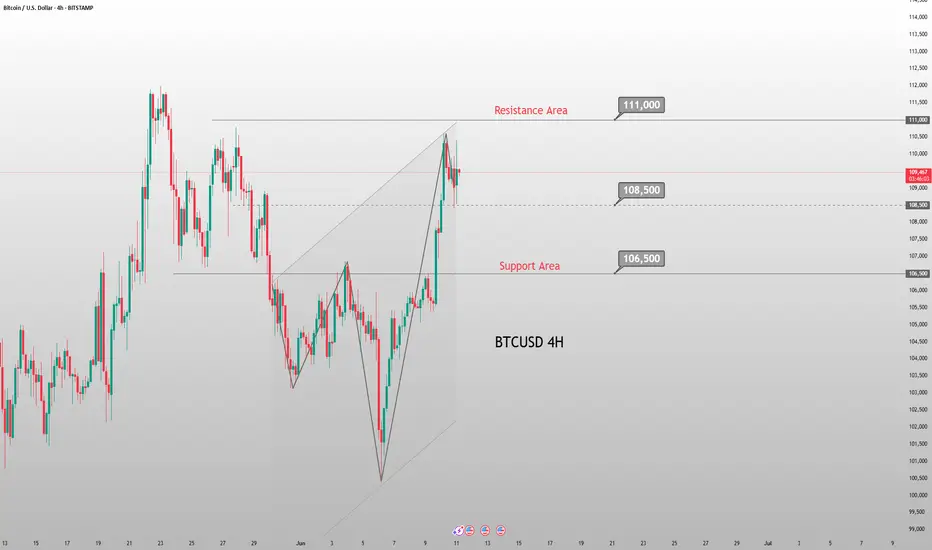
Evening BTC Trend Analysis and Trading RecommendationsDuring the morning session, the Bitcoin price continued its upward momentum from the previous night, surging to an intraday high of 110,653. Subsequently, as bullish momentum gradually waned, the price entered a volatile downward channel. Consecutive bearish candles triggered a significant retracement of earlier gains. In the afternoon, supported by the hourly moving average, Bitcoin saw a brief rebound, climbing to 109,852 as U.S. stocks opened. However, bears quickly regained control, pushing the price down to 108,282 before stabilizing, after which it entered horizontal consolidation. The current price remains around 109,000. Notably, our previous short strategy at 109,800 precisely aligned with the trend, successfully realizing the expected profit.
Current trading advice: Consider light short positions within 109,400–109,700, targeting around 108,500. If the price effectively holds support and stabilizes at 108,500, you may attempt light long positions to speculate on a rebound.
BTCUSD
sell@109400-109700
tp:108500-107500
Analysis of the Current BTCUSD Trend and Trading RecommendationsFrom a technical perspective, the bearish trend in BTC is temporarily dominant. On the four-hour chart, the price has trended downward with consecutive negative candles after being pressured, clearly indicating a bearish trend. Although small lower shadows suggest that bulls and bears are still locked in a tug-of-war, the RSI indicator is near the overbought zone at 70, and while the MACD remains positive, its momentum continues to weaken—both signals imply insufficient upward momentum and lingering adjustment pressure.
On the hourly chart, BTC has entered a consolidation phase with alternating positive and negative candles after a unilateral downward move. Currently, the Bollinger Bands are narrowing and moving sideways, indicating that future volatility may be limited. The price is now hovering near the upper band of the range, facing technical resistance.
In terms of the afternoon trading strategy, given the bearish dominance and fading upward momentum, the focus should remain on shorting at highs. Aggressive traders can lightly position for short-term rebounds but must use small positions and set strict stop-losses; prudent traders should wait patiently for higher levels to initiate short positions.
BTCUSD
sell@109800-110300
tp:108500-107500
Investment itself is not the source of risk; it is only when investment behavior escapes rational control that risks lie in wait. In the trading process, always bear in mind that restraining impulsiveness is the primary criterion for success. I share trading signals daily, and all signals have been accurate without error for a full month. Regardless of your past profits or losses, with my assistance, you have the hope to achieve a breakthrough in your investment.
Shorting Opportunity EmergesBTC has seen significant volatility recently. 📊 After failing to break below 100,000 yesterday, it rebounded sharply to 108,500 immediately. ⚡ Now is precisely the opportunity to go short. 📉
⚡️⚡️⚡️ BTCUSD ⚡️⚡️⚡️
🚀 Sell@ 109000 - 108500
🚀 TP 105000 - 103000
Accurate signals are updated every day 📈 If you encounter any problems during trading, these signals can serve as your reliable guide 🧭 Feel free to refer to them! I sincerely hope they'll be of great help to you 🌟 👇
Gold Surges, Euro Plunges, BTC at RiskOn May 23rd's U.S. session, Trump's EU/Apple tariff plans sparked market chaos:
Gold surged 💥 as a safe haven.
The euro plunged on EU tariff fears.
If tariffs persist, capital may flood into gold/forex, likely triggering a BTC crash.
⚡⚡⚡ BTCUSD ⚡⚡⚡
🚀 Sell@109500 - 108500
🚀 T P 106500 - 104500
👇Accurate signals are updated every day 📈 If you encounter any problems during trading, these signals can serve as your reliable guide 🧭 Feel free to refer to them! I sincerely hope they'll be of great help to you 👇
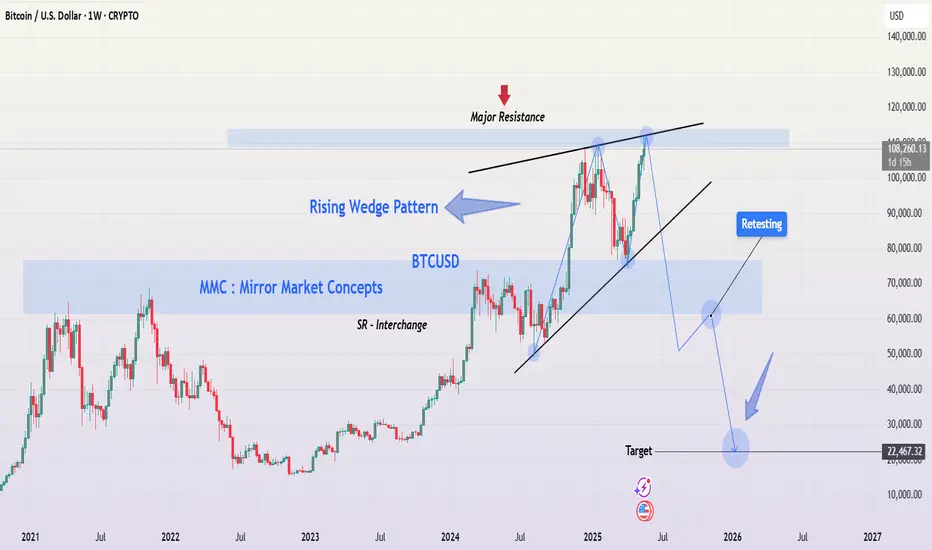
Bitcoin (BTC/USD) – Rising Wedge Pattern Signals & BreakdownThis chart illustrates a Rising Wedge Pattern on the weekly timeframe for Bitcoin (BTC/USD), which is generally considered a bearish reversal pattern in technical analysis. The pattern appears after a strong upward move and typically signals that the price is losing momentum and may be preparing for a significant correction.
📐 What is a Rising Wedge Pattern?
A rising wedge is a chart pattern formed when the price consolidates between two upward-sloping trendlines – the support line (bottom) and the resistance line (top) – with the two lines converging toward each other.
As price climbs higher, it forms higher highs and higher lows.
However, the slope of the highs is less steep than the slope of the lows, showing a loss of bullish strength.
Eventually, the price breaks below the support line, often leading to a sharp move downward.
🔍 Key Highlights from the Chart:
📌 1. Major Resistance Zone (~$110K–$120K):
BTC is currently facing heavy resistance in this area.
This zone has historically acted as a supply zone where bulls have struggled to break through.
Multiple rejection wicks indicate strong selling pressure.
📌 2. Pattern Touchpoints:
BTC has now formed multiple touchpoints on both the support and resistance lines of the wedge, confirming the structure.
This gives the pattern higher validity from a technical analysis perspective.
📌 3. SR Interchange Zone (~$65K–$70K):
This is a key horizontal zone where past resistance could act as future support.
A successful breakdown may first test this level before continuation.
📌 4. Retesting After Breakdown:
After breaking the wedge support, a retest of the broken trendline is often seen.
If the retest is rejected, it confirms the breakdown and opens the door to deeper bearish movement.
🎯 Target Projection:
If the wedge breaks down and the bearish scenario plays out, we could see Bitcoin fall to the $22,000–$25,000 region – marked as the final target zone on the chart. This level aligns with:
Previous macro-support zones from 2021
Fibonacci retracement levels
Psychological price levels where buyers may re-enter
⚠️ Bearish Factors to Watch:
Bearish divergence on indicators like RSI or MACD (not shown on chart but worth checking)
Volume decreasing as price rises – a classic wedge behavior
Macroeconomic headwinds or Bitcoin halving-related exhaustion
Rejection from major resistance with strong bearish candles
🕒 Timeframe & Patience:
This is a weekly chart, which means the pattern will play out over weeks or months, not days. Patience is key. A clear break, retest, and rejection would be the most reliable confirmation to expect further downside.
✅ Invalidation Scenario:
If BTC breaks above the wedge resistance line with strong bullish volume and holds above the $120K level, this bearish thesis becomes invalid.
In that case, BTC could enter price discovery mode, making new all-time highs.
💬 Final Thoughts:
This analysis is a technical outlook, not financial advice. Always use stop-loss strategies and manage your risk carefully. Market sentiment, news, and macro factors can quickly shift the scenario. However, from a purely technical standpoint, the rising wedge pattern is a powerful signal that should not be ignored.
Trump Tariffs Risk Triggering BTC Crash as Capital Flows to GoldOn May 23rd's U.S. session, Trump's EU/Apple tariff plans sparked market chaos:
Gold surged 💥 as a safe haven.
The euro plunged on EU tariff fears.
If tariffs persist, capital may flood into gold/forex, likely triggering a BTC crash.
⚡⚡⚡ BTCUSD ⚡⚡⚡
🚀 Sell@110000 - 109000
🚀 TP 106500 - 104500
👇Accurate signals are updated every day 📈 If you encounter any problems during trading, these signals can serve as your reliable guide 🧭 Feel free to refer to them! I sincerely hope they'll be of great help to you 👇
