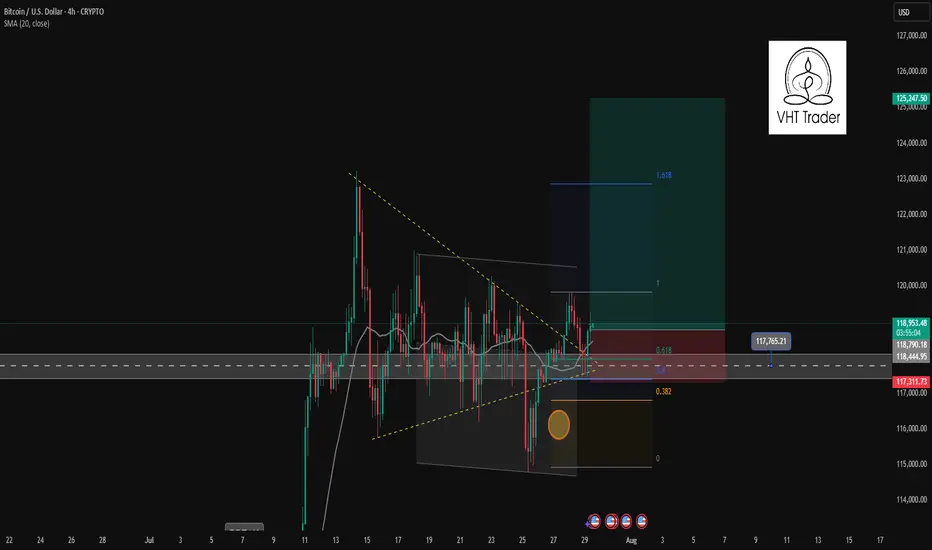
BTC HUGE DROP TO 113,400$ - BIG CRASH !*Sorry for posting to late as I am between a trip in Malaysia.*
Details:
Entry: Now - 117,000 $
Target Price: 113,410 $
Stop loss: 119,460 $
Trade Ideas:
Market creating a flag pattern here. Though its not only the logic we have some secret logics here and indicators which I shared in the VIP.
What is required to Join VIP?
- Nothing just you have to share 10% of your profit with us at the end of the month which you earned from our signals. Yeah this is just the requirement, trade where ever you like your favorite broker or else you don't need to pay fees first or create account thru our link.
Trade Signal:
I provide trade signals here so follow my account and you can check my previous analysis regarding BITCOIN. So don't miss trade opportunity so follow must.
BINANCE:BTCUSDT BINANCE:BTCUSDT.P BINANCE:BTCUSD
Btcusdshort

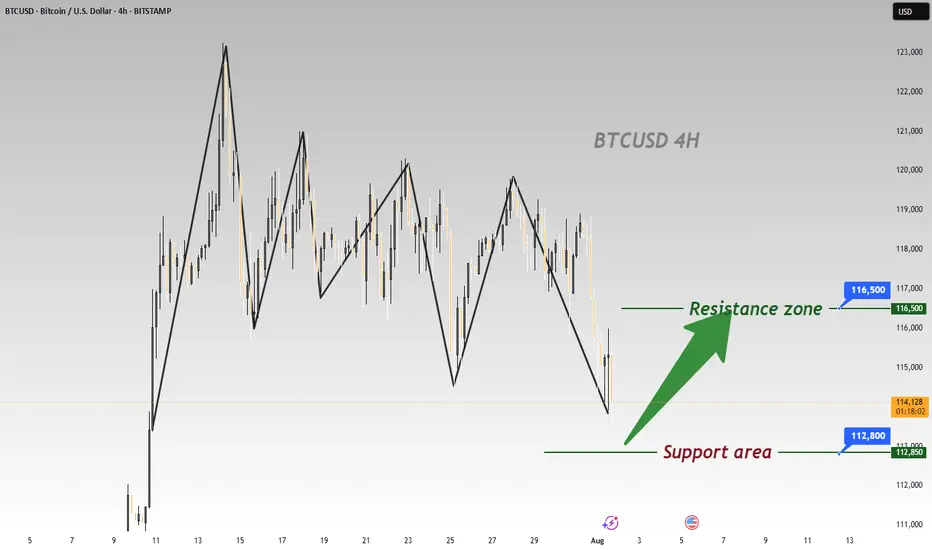
BTC Plummets Post-NFP; Go Long for Rebound to 116500BTC has plummeted significantly under the influence of the non-farm payroll data 📉, and now is an excellent opportunity to go long. Its Support level is around 112800, and according to the current trend, we can wait for a rebound to around 116500.
⚡️⚡️⚡️ BTCUSD ⚡️⚡️⚡️
🚀 Buy@ 113000 - 113800
🚀 TP 114500 - 115500 - 116500
Daily updates bring you precise trading signals 📊 When you hit a snag in trading, these signals stand as your trustworthy compass 🧭 Don’t hesitate to take a look—sincerely hoping they’ll be a huge help to you 🌟 👇
BTC/USD – 4H Short Setup AnalysisBitcoin is currently trading within a defined range under macro resistance. The chart shows price stalling below a key supply zone, with rejection from the upper Keltner Channel and diagonal resistance (yellow trendline). A local bearish divergence appears to be playing out as momentum fades.
📉 Short Position Setup:
Entry: $119,275 (supply retest)
Stop Loss: Above local high / top channel boundary
Targets:
TP1: $117,163 (38.2% Fib)
TP2: $115,858 (61.8% Fib)
TP3: $113,746 (full measured move)
Confluence:
Bearish rejection near multi-touch trendline resistance
Lower high formation after extended consolidation
Heikin Ashi candles showing loss of bullish momentum
Watch for: Breakdown of the white trendline support to confirm momentum shift. Invalidation if BTC closes strongly above $120,000.
Timeframe: 4H | Strategy: Range Reversal + Fib Confluence

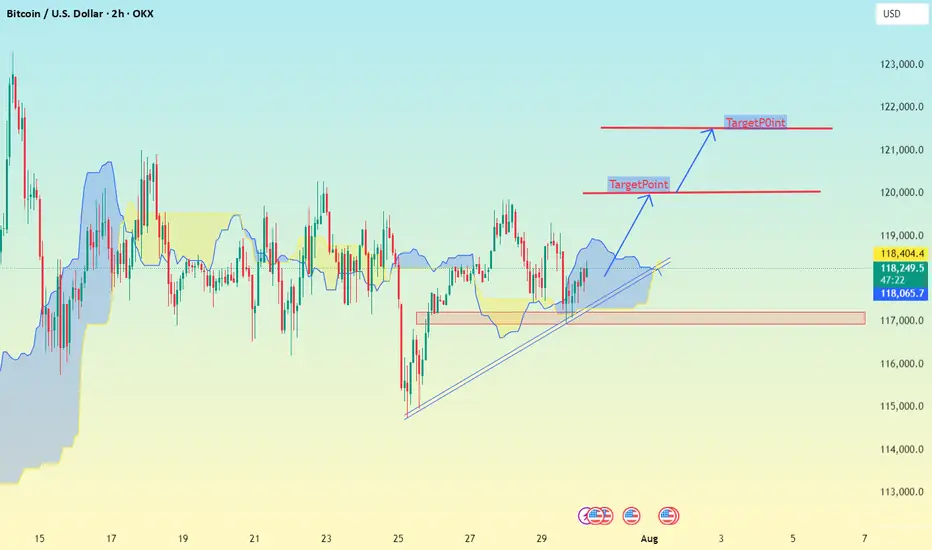
Chart Analysis (2h Timeframe)✅ Chart Analysis (2h Timeframe)
MY using Ichimoku Cloud, support/resistance zones, and trend lines.
Price is currently around 118,319 USD.
It has broken out of the Ichimoku cloud and is respecting the trendline support, indicating bullish momentum.
---
🎯 Upside Target Levels
🔵 Target 1:
Level: ~120,000 USD
Reason: Horizontal resistance (clearly marked)
Action: Minor profit-taking or partial exit
🔵 Target 2 (Main):
Level: ~122,000 USD
Reason: Second resistance zone & projected move from breakout
Action: Ideal full target zone
---
🔻 Support & Invalidations
🟡 Immediate Support Zone:
Levels:
118,404
118,296
118,065
These are dynamic Ichimoku & short-term support levels
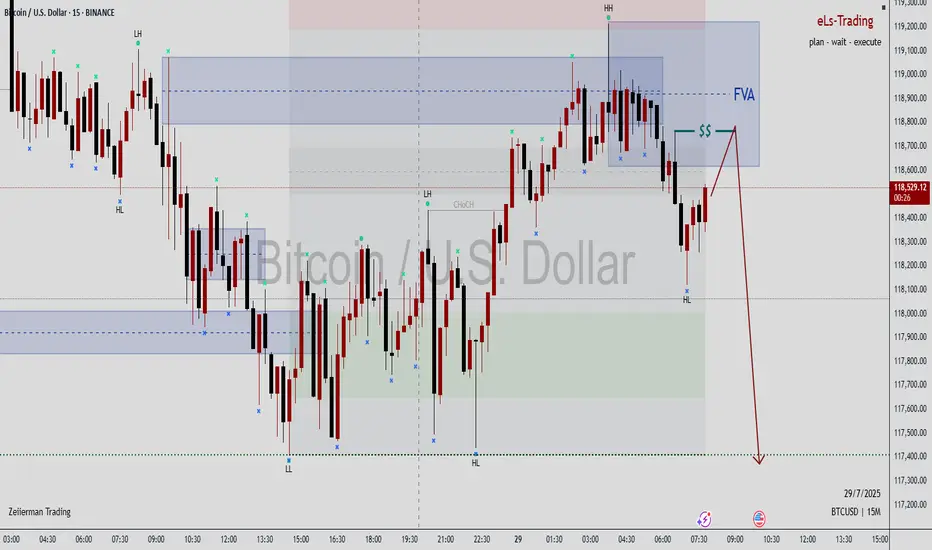
BTCUSD IdeaWe are waiting for our asset to reach our action zone, and based on the reaction, we’ll decide on our next moves.ALWAYS WAIT FOR A CONFIRMATION TO SEE IF THE PRICE VALIDATES THE ZONE.and you what is your vision of the EURUSD its interests me! i wait you in the commentary
BTCUSD trading signal. False break of bottom line✏️ CRYPTO:BTCUSD just False Break the lower band and is establishing a bullish wave structure in the H4 time frame. 119700 will be the top of wave 1 if the current bullish wave exceeds the top it will form a bullish DOW pattern heading towards a new ATH.
📉 Key Levels
BUY Now BTCUSD: Confirmation of candle when retesting Fibonacci 0.5
Target 127000
Leave your comments on the idea. I am happy to read your views.
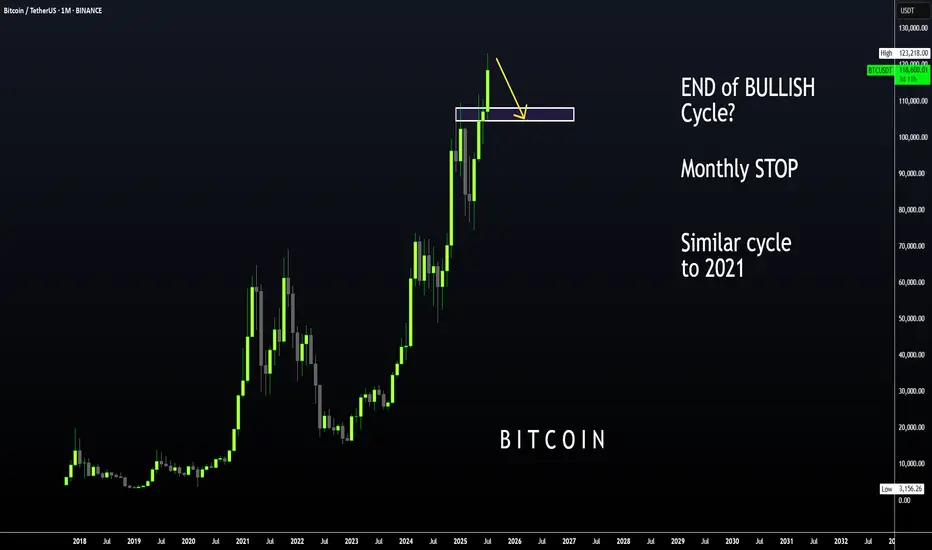
BTC | ALT Season, then BEARISH CYCLE BeginsBitcoin is likely moving in to the beginning of a bearish cycle.
I'm not saying this is immediate, we first need to see altseason - however, if BTC increases it may not go any higher than the last high of $123k. We could easily see the price hover around this zone with a few small increases and decreases for the next few weeks as alts make their respective moves.
I have been talking about the 2021 fractal for a couple of months, where BTC took its time to correct and then made another ATH which was only slightly higher.
We already see a similar pattern playing out in the monthly timeframe if we overlay bars pattern from 2021:
Although Bonce zone 3 may only be in several months, these are the major support zones where BTC could bounce from. Ideal for a swing:
____________________
BINANCE:BTCUSDT
BTCUSDT analysis – 1H & 4H OB setups✅ The overall market trend is still bullish on the 1H and 4H timeframes. However, we’re watching the red 4H supply zone (around 122,000) closely for a possible short-term sell setup.
🟥 If price reaches this red OB, we’ll look for a light short position only with confirmation on the 5M or 3M timeframe.
🟩 On the downside, we are mainly interested in buy setups from the following key green OB zones:
🔹 OB 1H around 115,000
🔹 OB 4H around 111,000
🔹 OB 4H around 108,000
📌 Possible scenarios:
1️⃣ Price reaches the red OB → short with confirmation
2️⃣ Price pulls back to lower green OB zones → long with confirmation
3️⃣ Market bias remains bullish unless proven otherwise.
❌ No entry without confirmation.

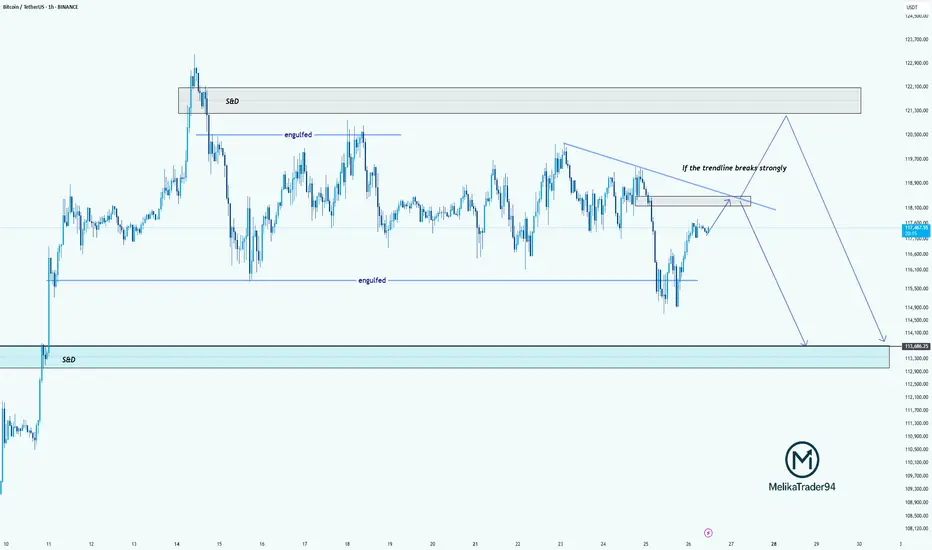
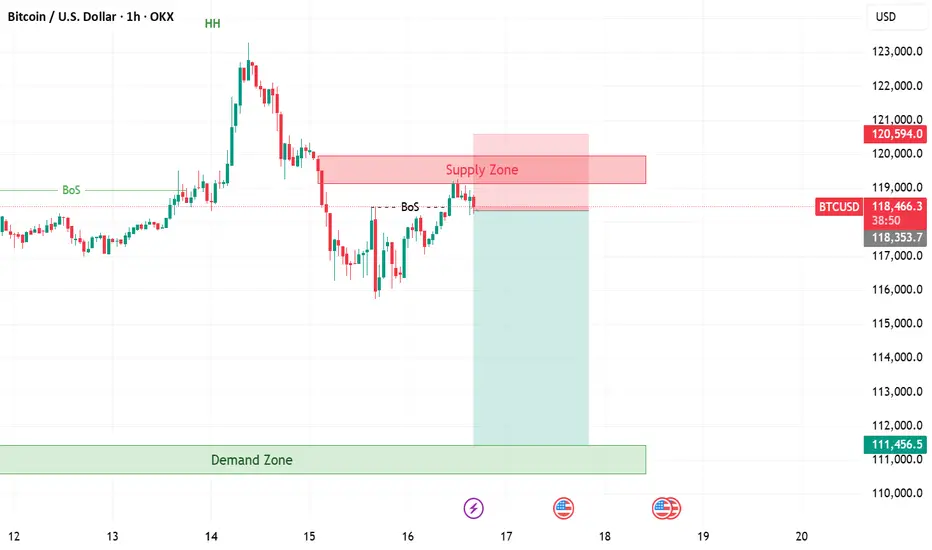
TC Analysis – Watching That Trendline Closely!Hello guys!
Bitcoin is currently approaching a key decision point. As highlighted on the chart, we’ve got a descending trendline acting as strong resistance. If this trendline breaks with strength, we may see price push up into the supply & demand zone around 121,000–122,000 before potentially reversing.
However, if the trendline holds, this current move could be a retest, setting up for another drop. The engulfed level at 114,000 has already been tested once, and if we break below that again, the price could slide down into the S&D demand zone around 113,000–112,000.
summry:
Trendline resistance is critical right now
Watch for a strong breakout or a fakeout & rejection
Possible bearish continuation if we fail to reclaim above 118,500
Let’s see how BTC reacts around this zone.
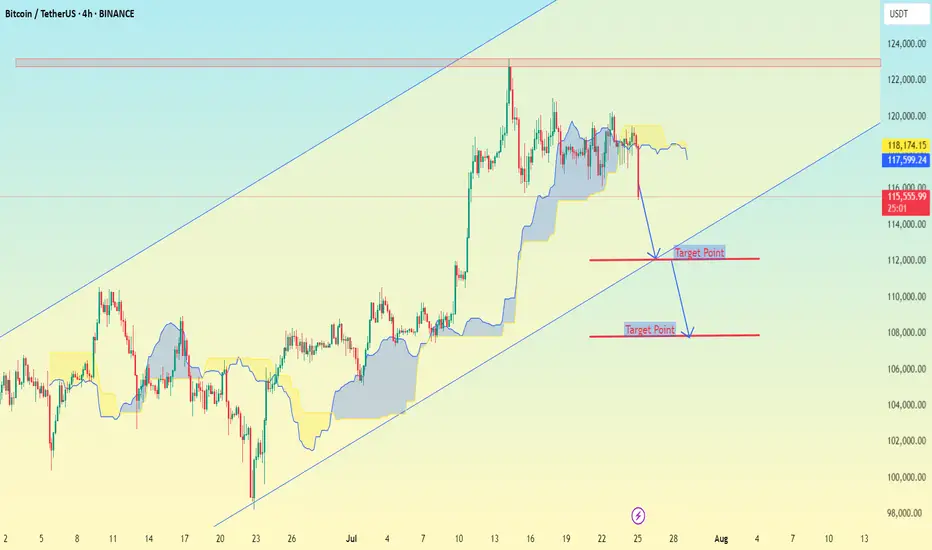
SHORT TERM BEARISH TARGETS ON THE H4 TIMEFRAME on THE BTCUSD, here are the downside target levels (short-term bearish targets) for BTC/USDT:
🎯 Target Levels:
1. Target Point 1:
112,000 USDT
This is a minor support zone where a temporary bounce or consolidation could occur.
It aligns with previous price action support and is near the lower Ichimoku edge.
2. Target Point 2:
106,000 USDT
This is a major support level near the lower boundary of the ascending channel.
If price breaks below Target 1 decisively, this becomes the high-probability target.
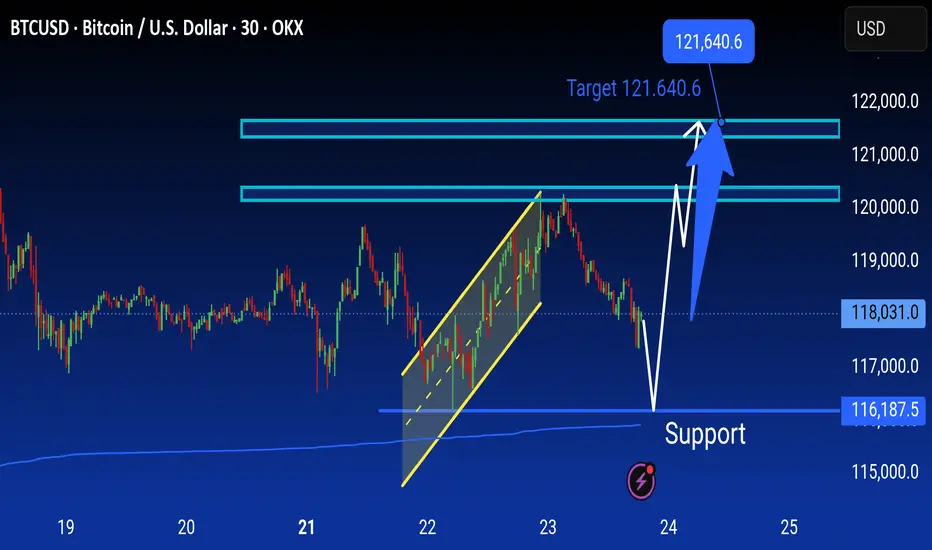
BTCUSD Analysis is Ready BTC/USD 30-min chart shows a potential bounce from the support zone around 116,187.5, aiming for a bullish move toward the target at 121,640.6. Price may retrace before pushing upward.
Btcusd:Huge trading opportunities and ideasBTCUSD's rebound after touching the position near 116180 this time is fast. From the trend observation. BTCUSD is still in a high consolidation stage. It has not broken the oscillation range for the time being. It can maintain selling near 120k. Buying near 11600 for range trading. It is expected that there will not be many trading opportunities in the London market. It will take until the New York market opens to see better trading opportunities.
BTCUSDBTCUSD also fell from a high level, reaching a high of around 119700, only 300 points away from the target of 120k. The price after the decline is now around 118600. Buying at a low level is the main focus. The reference buying point is 118500-118000. The target is above 120k. Stop loss 117300
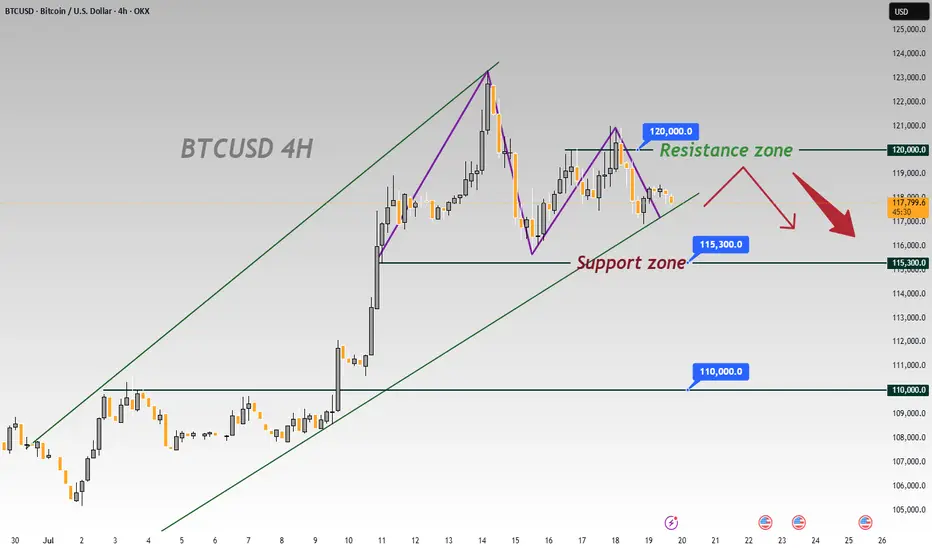
BTCUSD 4-Hour Chart Analysis: Range-Bound Trends & Key LevelsFrom the 4-hour chart of BTCUSD, the recent price movement shows obvious range-bound characteristics 📊. The upper zone around 120000 forms a key resistance level 🛑, where the bullish momentum has waned after encountering resistance 💨.
The lower level of 115300 is a significant support zone 🛡️. Previously, there was some buying support when the price retraced to this zone 👀. However, as the current price is pulling back from the resistance zone ↘️, if the bearish force takes the lead subsequently 🐻, the possibility of breaking below the 115300 support will increase ⬆️. Once it breaks below effectively 💥, the next key support level of 110000 will most likely become the target for the price to decline towards 🎯.
In terms of the short-term trend 📈, due to the obvious suppression from the resistance zone 🚧, the price will most likely continue the rhythm of testing the support downwards 🔽. In operation, one can pay attention to the breakdown situation of the support zone and layout trades accordingly 📝. Meanwhile, be alert to the possibility of a rebound after the price finds support in the support zone 🚀, and further confirmation of the direction needs to be combined with real-time K-line patterns 📊, trading volume 📈
🚀 Sell @119500 - 118500
🚀 TP 116500 - 115500
Accurate signals are updated every day 📈 If you encounter any problems during trading, these signals can serve as your reliable guide 🧭 Feel free to refer to them! I sincerely hope they'll be of great help to you 🌟 👇
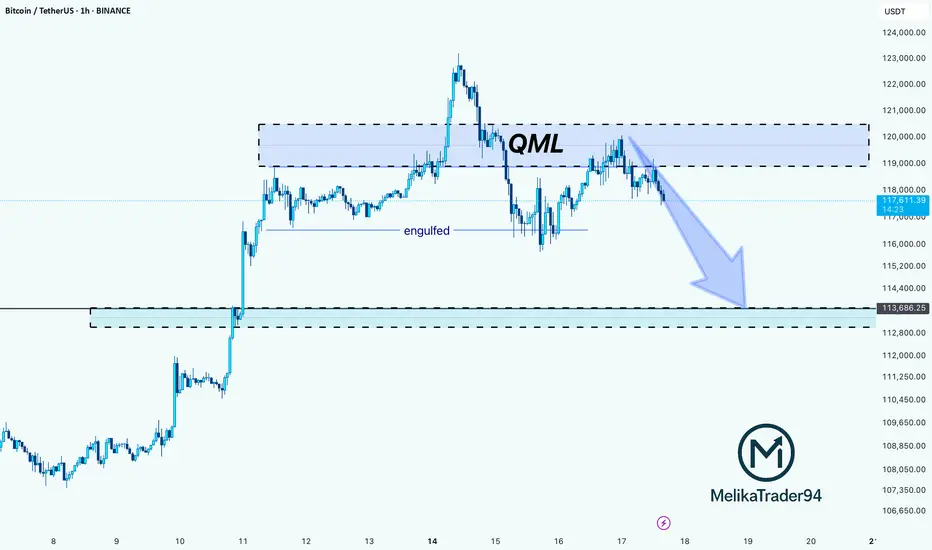
BTC Rejection from QML Zone: Towards on 113,600 SupportHello guys!
This chart shows a QML (Quasimodo Level) setup in play on Bitcoin. After price created a new high and engulfed the previous structure, it returned to the QML zone (around $119K–$121K) and reacted exactly as expected: strong rejection.
The sharp selloff from the QML area confirms a bearish shift in structure, and now the momentum is tilted to the downside.
The next key level to watch is the 113,600 demand zone, where the price may either bounce or consolidate.
As long as the price stays below the QML zone, bears have control.
You should consider that the main trend is bullish, and the stop loss may be hit, so please manage your risk!
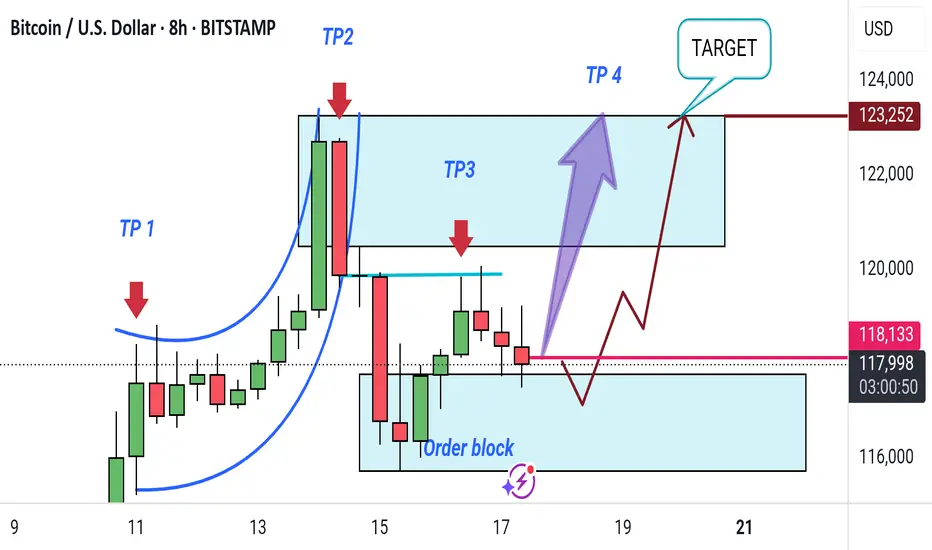
"Bitcoin Bullish Reversal Setup with Target Zones (8H Chart)"This 8-hour Bitcoin/USD chart shows a potential bullish setup. Key takeaways include:
Order Block: Identified support zone for possible reversal.
TP1 to TP4: Target points for profit-taking as price moves upward.
Target Zone: Final target area near $123,252.
Expected move: A short-term dip into the order block, followed by a rally toward the target zone.
BTCUSD - Exhausted? Second time rejected, now down.BTCUSD got rejected at the Centerline the second time. This is super bearish. If it's closing below yesterdays low, that's a clear short signal to me.
Taking 50% gains off the table is never bad. Because then you still have 50% if it's going up further. Otherwise, you got 50% booked.
Don't let gree eat your brain §8-)

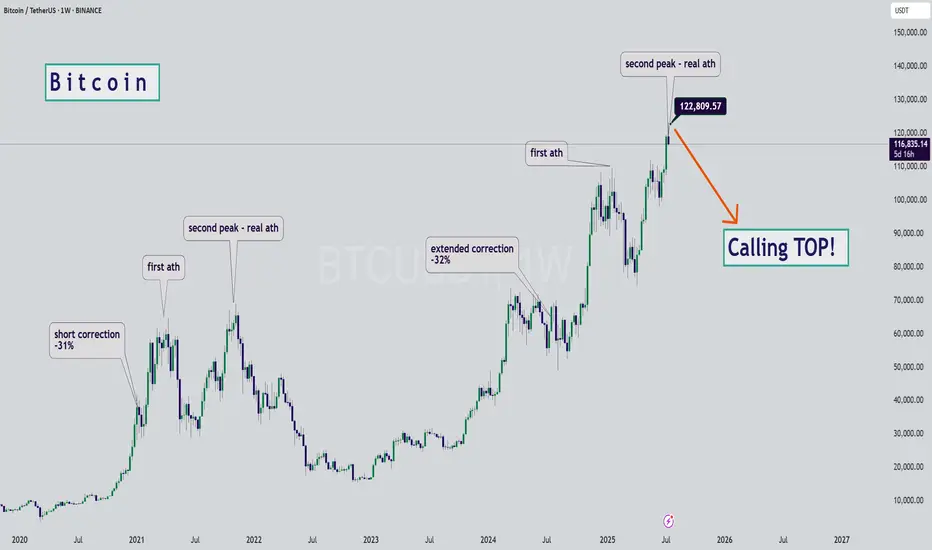
BTC - Calling the Start of the Bearish SeasonHello Watchers ☕
This was my previous Bitcoin update where I had a target of $116K, and also then closed all open positions at $122K:
I'm calling the top here mainly because of the way the chart looks, it really is classic Wyckoff if you look at the duration of the current bullish cycle, which has lasted a whole 973 Days with a 564% increase. What goes up, must come down!
Just for interest sake, the previous bullish cycle ran for 600 days with a 700% increase.
#btc #btcusd #elliottwave short sell setup wave 4 16Jul24This count is based on my assumptions so anything can happen not a trading or financial advice just for educational purposes only kindly do your own ta thanks trade with care good luck.
Bitcoin | BTCUSD | SELLSell Bitcoin.
Price reached supply level on 1H, we got confirmation of rejection from 15m.
Take Profit: 111,430
Stop Loss: 120600
Bitcoin Prediction that will blow your mind (warning for bulls) I am showing you that BTC made new ATH only in the USD pair and not in other pairs like EUR, and why, and what you can anticipate and what to watch out for from #Bitcoin next.

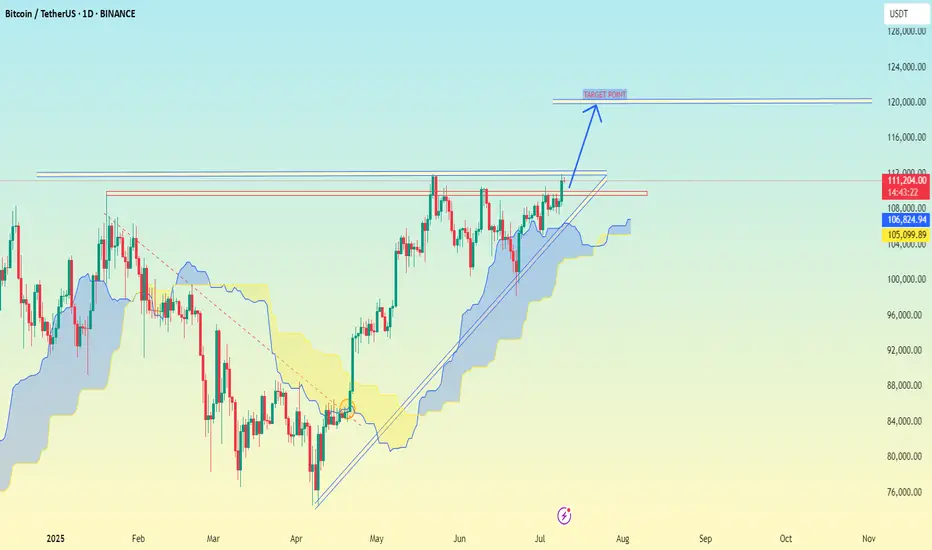
(BTC/USDT) appears to be around $120,000.(BTC/USDT) appears to be around $120,000.
Here's a quick analysis of what the chart suggests:
Timeframe: 1D (Daily)
Current price: ~$111,150
Technical Indicators:
Ascending triangle breakout is indicated.
Ichimoku Cloud shows bullish momentum (price above the cloud).
The breakout is targeting a horizontal resistance zone around $120,000.
✅ Target Zone:
Target Point (based on breakout projection): $120,000 – $124,000
This target aligns with previous resistance levels and technical breakout patterns.
Let me know if you want a more detailed technical breakdown (e.g., support/resistance zones, volume analysis, RSI, etc.).