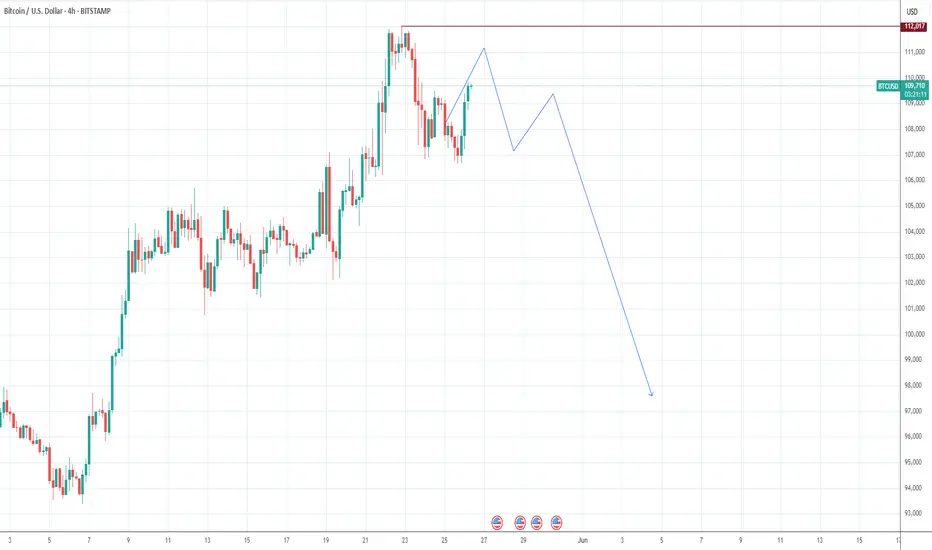
BTC/USD: Today's Strategic AnalysisBTC has continued the analyzed upward trend. After testing the resistance area above 110,000, it began to decline. A small-scale decline is expected during the day, and short-term traders can try shorting.
BTC/USD
Sell@110000-111000
tp:108000-107000
I am committed to sharing trading signals every day. Among them, real-time signals will be flexibly pushed according to market dynamics. All the signals sent out last week accurately matched the market trends, helping numerous traders achieve substantial profits. Regardless of your previous investment performance, I believe that with the support of my professional strategies and timely signals, I will surely be able to assist you in breaking through investment bottlenecks and achieving new breakthroughs in the trading field.
Btcusdshort

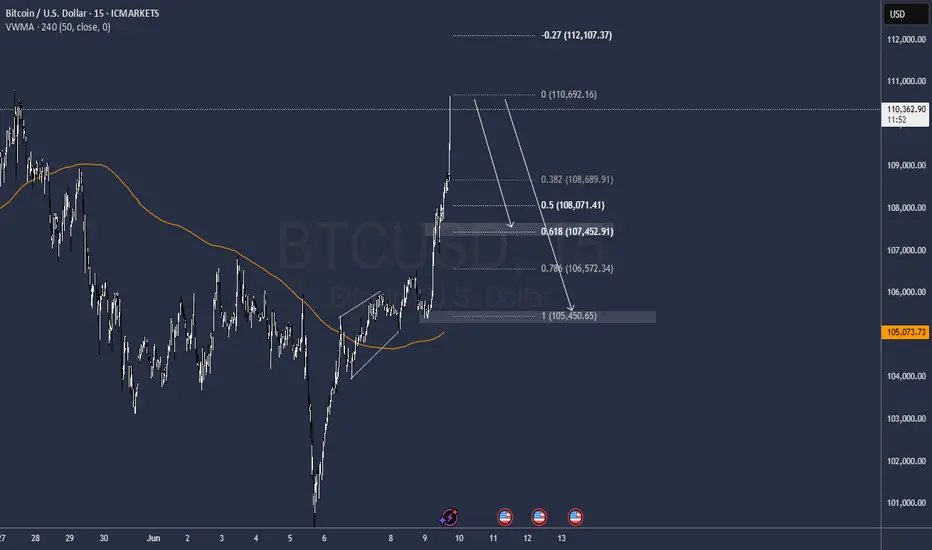
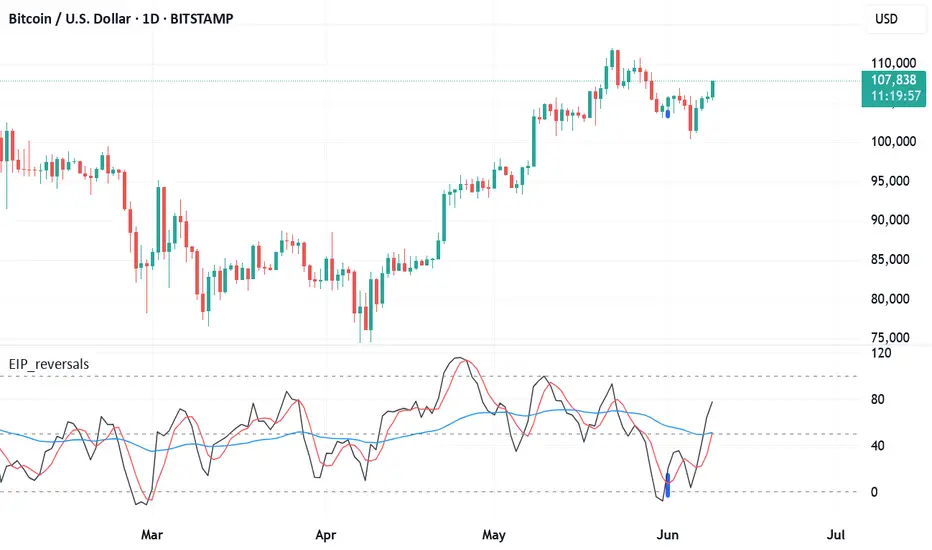
BTCUSD: Short-Term Range Trading as Bulls and Bears StalemateOn the weekly timeframe, prices retreated under pressure after hitting a high of 112,000, forming consecutive bearish candles. Despite this, prices remain at elevated levels, intensifying overall market volatility. Prior to Friday, the daily chart showed a sideways-downward trend, but yesterday’s data-driven rally appeared to disrupt this pattern, creating conflicting signals. Technical indicators on the 4-hour and hourly charts are shifting rapidly, with no clear signals for medium-to-long-term trends.
The current trend is likely to remain range-bound, with resistance at 107,000 and support at 101,000.
BTC/USD
sell@106000-107000
tp:102000-101000
I am committed to sharing trading signals every day. Among them, real-time signals will be flexibly pushed according to market dynamics. All the signals sent out last week accurately matched the market trends, helping numerous traders achieve substantial profits. Regardless of your previous investment performance, I believe that with the support of my professional strategies and timely signals, I will surely be able to assist you in breaking through investment bottlenecks and achieving new breakthroughs in the trading field.

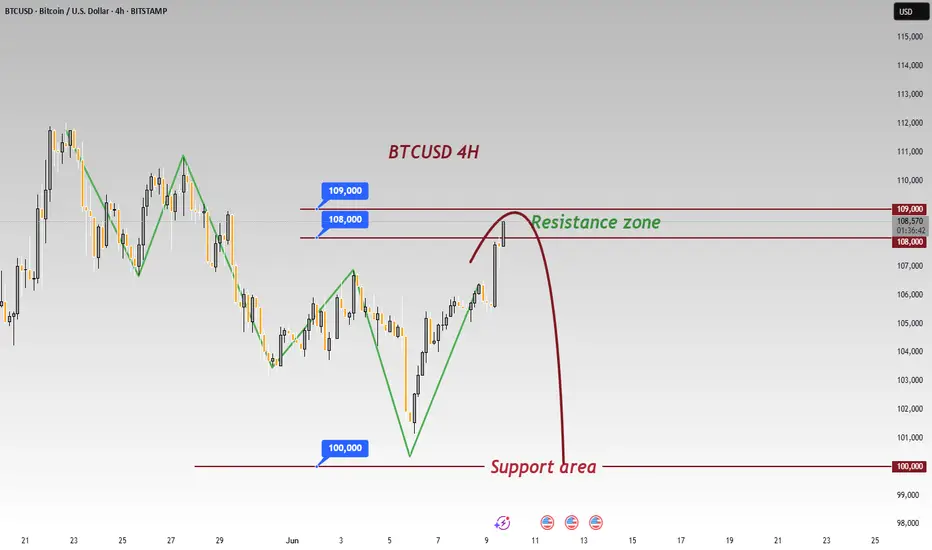
Shorting Opportunity EmergesBTC has seen significant volatility recently. 📊 After failing to break below 100,000 yesterday, it rebounded sharply to 108,500 immediately. ⚡ Now is precisely the opportunity to go short. 📉
⚡️⚡️⚡️ BTCUSD ⚡️⚡️⚡️
🚀 Sell@ 109000 - 108500
🚀 TP 105000 - 103000
Accurate signals are updated every day 📈 If you encounter any problems during trading, these signals can serve as your reliable guide 🧭 Feel free to refer to them! I sincerely hope they'll be of great help to you 🌟 👇
BTCUSDT: Your Next Move? The Blue Box OpportunityAlright, focusing on BTCUSDT. This blue box is a critical buying zone.
The market's recent moves demand clarity. You need to know where genuine opportunity lies, avoiding the traps that catch most traders.
I've identified this blue box as a prime area where demand could ignite. But don't just jump in. Here's the plan:
Watch the Volume Footprint: Is there real accumulation, or just noise?
Spot CDV Divergences: Hidden strength often appears here, even if price looks weak.
Confirm on LTF: A clear breakout above minor resistance, followed by a retest as support, is your green light.
Be vigilant for liquidity hunts – those quick dips that shake out weak hands before a real move. If this blue box holds, and we get these confirmations, my bias is firmly upwards.
I only focus on assets with sudden, significant volume increases. BTCUSDT's current setup, combined with this potential volume, makes it a high-interest play.
Keep a very close eye on this blue box. Understanding these subtle signals means you can navigate these intricate dynamics, securing your position for potential gains. Miss this, and you might regret it.
📌I keep my charts clean and simple because I believe clarity leads to better decisions.
📌My approach is built on years of experience and a solid track record. I don’t claim to know it all but I’m confident in my ability to spot high-probability setups.
📌If you would like to learn how to use the heatmap, cumulative volume delta and volume footprint techniques that I use to determine very accurate demand regions, you can send me a private message. I help anyone who wants it completely free of charge.
🔑 On my profile, you can find an extensive track record spanning hundreds of analyses and many examples of my strategies in action. To keep things concise here, I'm sharing just a few of my most recent successful calls as a small snapshot of my ongoing work:
📊 FLOKIUSDT - +%100 From Blue Box!
📊 TRXUSDT - I Do My Thing Again
📊 OGNUSDT | One of Today’s Highest Volume Gainers – +32.44%
📊 TIAUSDT | Still No Buyers—Maintaining a Bearish Outlook
📊 Simple Red Box, Extraordinary Results
Feel free to check out my TradingView profile for all of them; listing everything here would genuinely take too long! 😉

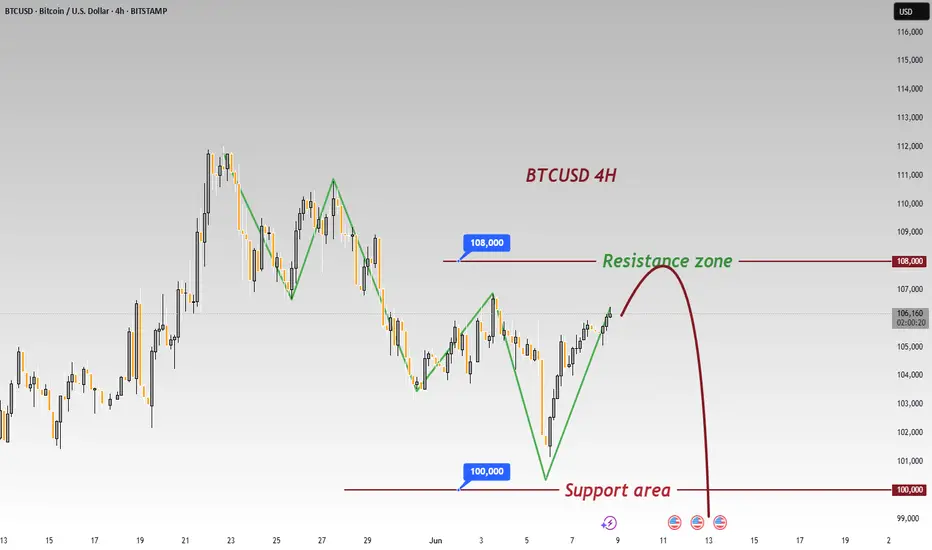
BTC Bears Eye 100000 Break; Short at 107000 -108000 ResistanceBTC's downward movement failed to break through 100,000📉, but there is a clear downward trend, and breaking below 100,000 is only a matter of time⏳. In the short term, shorting at high levels can be considered📉. The upward resistance currently has difficulty breaking through 110,000🚧, and shorting can now be considered in the resistance range of 107,000-108,000📉
⚡️⚡️⚡️ BTCUSD ⚡️⚡️⚡️
🚀 Sell@ 107000 - 106000
🚀 TP 102000 - 98000
Accurate signals are updated every day 📈 If you encounter any problems during trading, these signals can serve as your reliable guide 🧭 Feel free to refer to them! I sincerely hope they'll be of great help to you 🌟 👇
Bitcoin B-Wave Trap? Major C-Wave Down Correction Incoming!Bitcoin’s recent bounce has all the signs of a classic B-wave in an ABC corrective structure. After the impulsive A-wave down from the highs, this current rally appears more like a corrective relief move rather than the start of a new bullish impulse. Volume remains weak and the structure looks choppy — not the kind of strength you’d expect from a sustainable uptrend.
I believe we are now completing the B-wave, luring in late bulls before the real drop — the C-wave — begins. This next leg down could be sharp and painful, targeting key support zones and possibly wiping out the complacency that’s built up in the market.
🧠 Watch for signs of exhaustion in this rally.
📉 Potential C-wave targets: 98k 97k
⏳ Timing and structure suggest we’re close to the turning point.
Stay cautious. This could be the calm before the real storm.
---
BTC short setup As previous weekly went good on BTC, a nice bounce from the area on swing setup. Now wait for the liquidity grab from 107.8k then take short, that whiteline is important to break and sustain for btc to continue it's Bullish trend. Longer sl is just to avoid wick damage closing matter here. Good luck, book at least 50% on 105.2k rest hold the position, and take long from mentioned zone.
Will BTCUSD see $90,000 ever again? Phoenix FX mid term analysisBTCUSD 4-Hour Outlook: The Week Ahead
🔴 Key Resistance Zones
First Resistance
$107 000–$108 500
Recent swing highs where price stalled before the last leg down. Clearing and closing above $105 000 on the 4H would open the door toward this zone.
Final Resistance
$111 000–$113 000 (If broken expect a run to $115,000)
The all-time-high area. Heavy sell-side liquidity lives here and past price action shows repeated FVG fills and wicks into this region.
🔵 Critical Support & Buy Zones
Discount Buy Zone:
$92 000–$89 000 (50% at $89 150)
A deeper weekly FVG and longer-term trend support. The ultimate “buy the dip” area if the premium zone gives way.
Premium Buy Zone:
$100 000 – $99 000 (50% at $99 450)
A 4H Fair Value Gap that aligns with our higher-timeframe trend support. The recent bounce here signals strength—and a possible launchpad back into resistance.
📊 Weekly Price Action Scenarios
Bullish Theory:
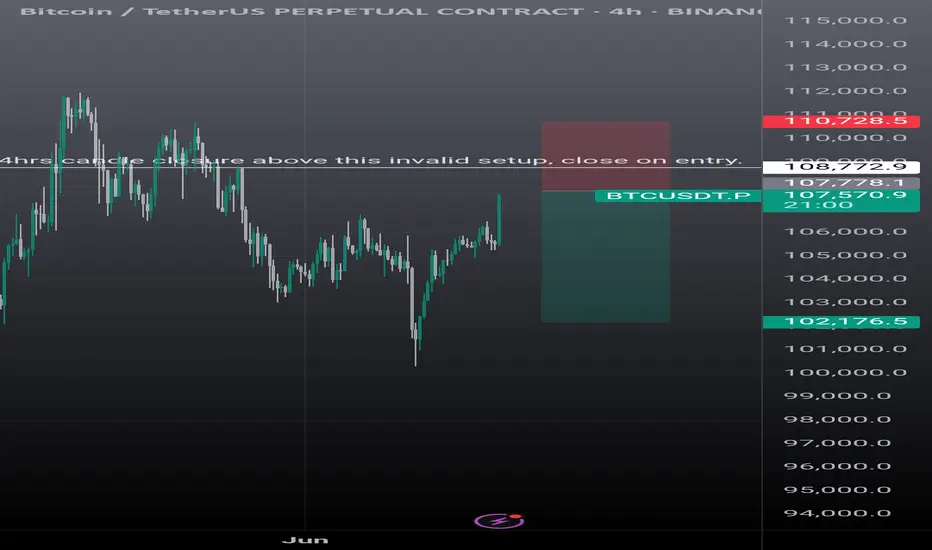
If BTC can close cleanly above $105 000 on the 4H, look for a run into $107 000–$108 500 (First Resistance). A follow-through push could then target $111 000–$113 000 (Final Resistance) by week’s end with a potential further move to $115 000 where the 8 year trend will be tested again.
Bearish Theory:
Failure to reclaim $105 000, or a clear rejection in the $107 000–$108 500 zone, could usher in a retest of the Premium Buy Zone (~$100 000). A break below $99 000 would shift focus toward the Discount Buy Zone around $92 000–$89 000.
💡 Trade Ideas for the Week
Potential Long Ideas
Entry: 4H candle close above $105 000
Targets: First take-profit at $108 500; stretch target $112 000–$113 000
Stop-Loss: Below $103 000
Zone Re-Entry Long
Entry: Bullish 4H candle close in $100 000–$99 000
Targets: $107 000 then $112 000
Stop-Loss: Below $97 500
Potential Short Ideas
Entry: Bearish price action (e.g., engulfing candle or wick rejection) in $107 000–$108 500
Targets: $100 000→$92 000
Stop-Loss: Above $109 000
Just a Heads-Up:
This is my take on the charts—not gospel, not financial advice, and definitely not a crystal ball 🔮.
Trading is part skill, part patience, and part “what just happened?” 😅
We all see things a little differently, and that’s the beauty of it.
So if you’ve got a hot take, wild theory, or just want to drop some chart wisdom—hit the comments!
Let’s grow, learn, and laugh through the madness together. 🚀📈
Each one, teach one.
— Phoenix FX Team 🔥🦅

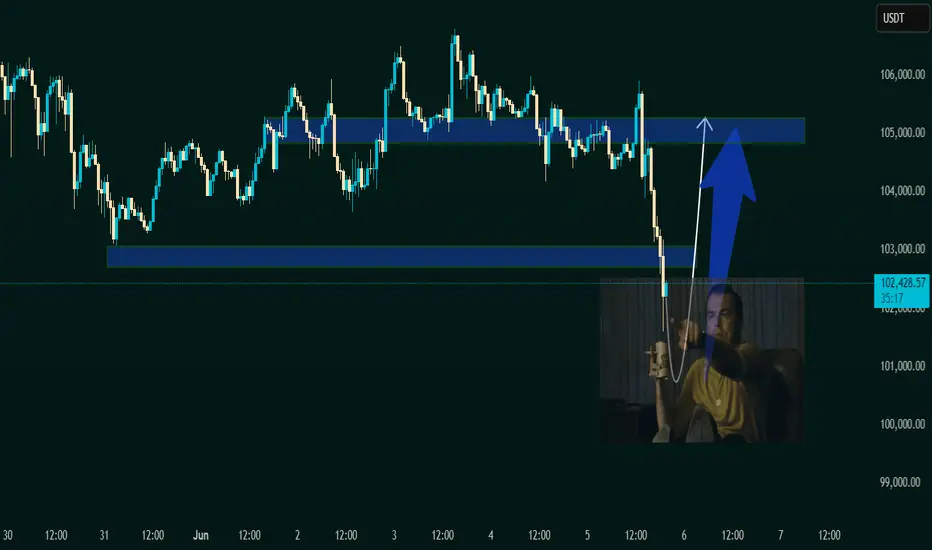
"Caught the Dip – Next Stop: Resistance Zone 1. Current Price Action:
The asset has bounced off the demand zone around 101,500 – 102,000 USDT.
It is now trading at 102,204.56 USDT, indicating early signs of the expected bullish move.
A white curved arrow suggests a rounded bottom pattern, often signaling a bullish reversal.
2. Demand Zone (Support):
Remains the same as the previous chart: 101,500 – 102,500 USDT.
Price reacted exactly at this zone and is starting to move upward.
3. Supply Zone (Target Area):
Clearly marked at 104,800 – 105,500 USDT.
This is where the expected bullish move could face resistance or where traders might look to take profit (TP).
4. Visual Reinforcement:
The large blue arrow indicates strong bullish momentum is anticipated.
The meme (Leonardo DiCaprio pointing) emphasizes that the reversal is happening as previously predicted — likely for motivational or engagement purposes in a VIP group.
---
🧠 Technical Sentiment:
Bullish Bias confirmed: Price bounced exactly from the demand zone.
Momentum Shift is underway, as indicated by the reversal pattern.
A potential "Buy Confirmation" is in play with room to ride up to the 105K resistance zone.
---
🎯 VIP Trade Setup Recap:
Parameter Value
Entry Zone 101,500 – 102,000 USDT
Current Price 102,204.56 USDT
Target (TP) 105,000 – 105,500 USDT
Stop Loss (SL) Below 101,000 USDT
Bias Bullish / Reversal
---
📌 Suggested Title:
"Reversal In Motion – Ride to 105K 🎯🚀"
BTCUSD Breakdown Alert | Bearish Momentum Setup in PlayHello traders!
After a strong uptrend, BTCUSD has now broken below the ascending trendline and is retesting from the underside — a classic bearish continuation signal. This could mark a key shift in market structure.
🔍 Key Observations:
Initial consolidation acted as a launchpad for the prior move.
Clean uptrend with higher highs and higher lows.
Recent trendline break suggests weakening bullish momentum.
Price is currently retesting the trendline from below — often a signal of incoming downside if confirmed.
📉 Bearish Scenario:
If this retest holds, BTCUSD may drop toward $105,000, with the next major support around $102,400. A break below that zone could accelerate the downtrend.
Targets / Support levels
Short-term: $105,000
Major support: $102,400
⚠ Risk Management:
Stick to your trading plan — use stop-losses and size positions carefully. No setup is guaranteed. Follow price action, not the hype.
📊 What’s your bias? Bullish or Bearish?
👍 Like & 🔔 Follow for more technical setups!
#CryptoAnalysis #BTCUSD #TrendlineBreak #TechnicalAnalysis #BearishSetup #TradingView #SupportAndResistance #PriceAction

btcusd sell signal. Don't forget about stop-loss.
Write in the comments all your questions and instruments analysis of which you want to see.
Friends, push the like button, write a comment, and share with your mates - that would be the best THANK YOU.
P.S. I personally will open entry if the price will show it according to my strategy.
Always make your analysis before a trade

earish trand analysis Read The ChaptianSMC trading point update
Technical analysis of (BTC/USDT) based on the 4-hour timeframe. Here’s a detailed breakdown of the analysis and the idea behind it:
---
Key Components of the Analysis:
1. Resistance Zone (FVG - Fair Value Gap):
The yellow zone marked as “fvg resistance level” indicates an area where price previously dropped quickly, suggesting inefficiency or imbalance in the market.
Price is approaching this zone again, which acts as a strong resistance.
2. Trendline & Lower Highs:
A descending trendline (with red arrows) shows consistent lower highs, indicating ongoing bearish pressure.
Each rejection from the trendline reinforces sellers’ dominance.
3. CHOCH (Change of Character):
The label “choch” signifies a market structure break, where bullish structure turned bearish.
This marks the transition to a downtrend.
4. EMA 200 (Exponential Moving Average):
The EMA (currently around 102,753) acts as dynamic support.
Price is currently trading above it, but a rejection from the resistance may push it below.
5. Target Zone:
A yellow box near 100,817.99 is labeled “target point”, indicating a possible short-term bearish target if price gets rejected at resistance.
6. RSI (Relative Strength Index):
RSI is around 47.11, slightly below neutral (50), suggesting bearish momentum could be building.
No clear oversold or overbought conditions yet.
---
Trade Idea Summary:
Bias: Bearish
Scenario:
If price reaches the resistance zone (~106,800–107,500) and fails to break above, a sell-off is expected.
First target: 100,800–101,000 zone
Price may also dip below EMA 200 confirming bearish strength.
Confirmation:
Rejection candle or bearish engulfing pattern near resistance.
RSI staying below 50 and starting to dip.
Invalidation:
Clean breakout and close above the resistance zone and trendline (~108,000+).
Mr SMC Trading point
---
Conclusion:
This chart sets up a high-probability short trade around the resistance area, leveraging both structural and momentum indicators. It suggests waiting for confirmation of rejection before entering, targeting the previous support and imbalance zone below.
Pales support boost 🚀 analysis follow)

BTCUSD – Bullish Channel Support Bounce SetupBTCUSD is currently trading within a clearly defined ascending channel on the 15-minute chart. The price recently touched the lower boundary of the channel and is showing signs of a potential bullish bounce.
This structure suggests that the pair may continue respecting the trend and head toward the upper boundary of the channel, offering a favorable risk-to-reward opportunity.
The trade plan includes a long setup with stop-loss placed just below the channel support and a target near the upper resistance zone. Volume remains moderate, supporting gradual upward momentum.
Technical Highlights:
Pattern: Ascending Channel
Key Support: Lower trendline
Entry Zone: Near current support
Target Zone: Around 106,500
Stop-Loss: Below recent swing low (around 104,185)
This is a technical chart idea based on price action and structure. Please manage your risk accordingly.

Bitcoin - Ready to go but from lowerAfter breaking out of the marked range, Bitcoin retested the level but is now showing weakness in bullish momentum.
Although the price has broken above the high that created the last lower low, it did so without strong momentum, and is now pulling back.
🔍 We are watching the highlighted zones for potential bullish reactions.
In these areas, we will look for a confirmed long entry trigger.
⚠️ The lower the price drops—especially if it reaches the 4H Fair Value Gap (FVG)—the higher the reward-to-risk ratio for long setups.
Be patient and wait for confirmation before entering. ✅
🔍 Insight by ProfitaminFX
If this outlook aligns with your bias, or if you see it differently, feel free to share your perspective in the comments. Let’s grow together 📈

BTCUSD Bearish Signal | Technical + Custom AlgoSmart Trend Signal | Technical Analysis + Custom Algorithm
This signal is the result of a combination of classic technical trend analysis and a proprietary software I personally developed.
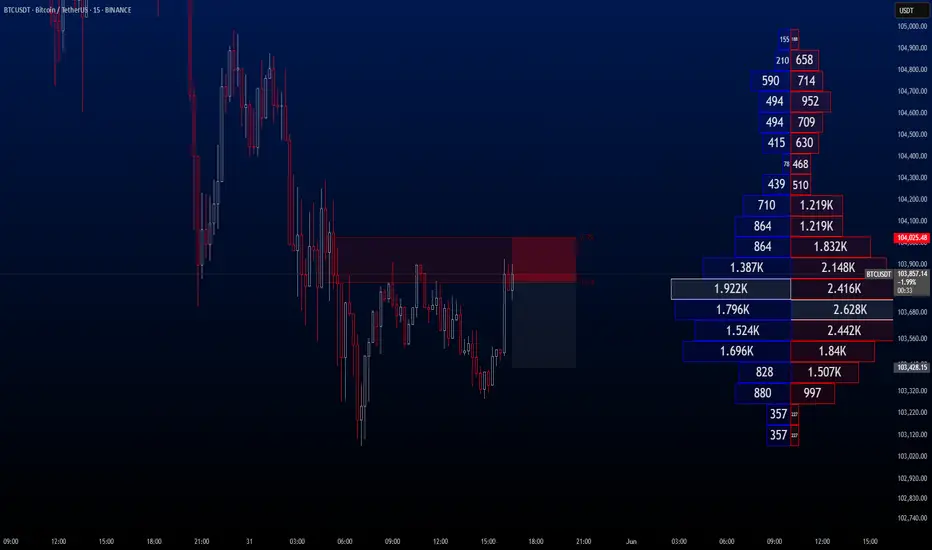
BTCUSDT Hello traders, wishing everyone a great weekend!
I’ve identified a sell opportunity on BTCUSDT and decided to share it with you as well.
🔍 Trade Details:
✔️ Timeframe: 15-Minute
✔️ Risk-to-Reward Ratio: 1:2 / 1:4
✔️ Trade Direction: Sell
✔️ Entry Price: 103,826.28
✔️ Take Profit: 103,428.15
✔️ Stop Loss: 104,025.48
🔔 Disclaimer: This is not financial advice. I’m simply sharing a trade I’ve taken based on my personal trading system, strictly for educational and illustrative purposes.
📌 Interested in a systematic, data-driven trading approach?
💡 Follow the page and turn on notifications to stay informed about upcoming trade ideas and advanced market insights.
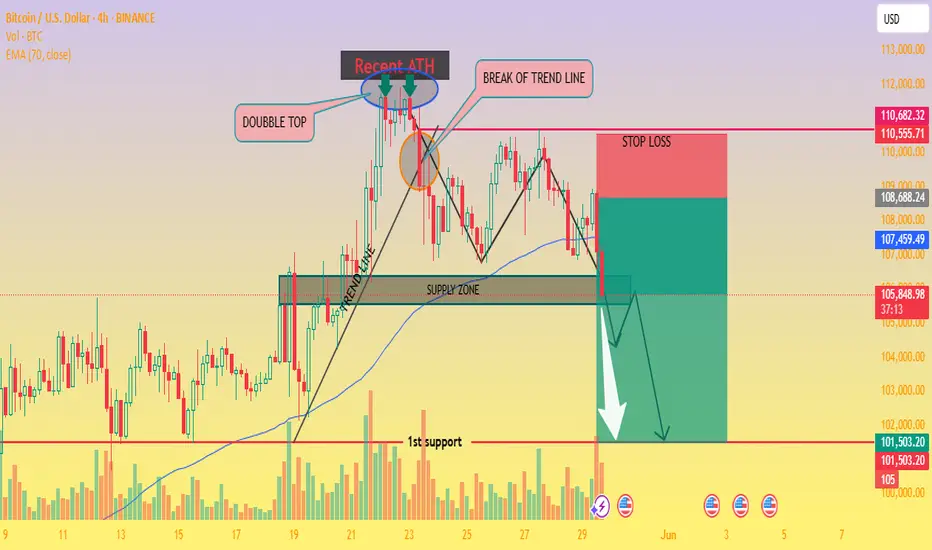
BTC/USD – Double Top Breakdown Signals Bearish Wave- 4H chart. 🧨
🔍 Chart Analysis:
🟢 Recent Price Action:
Bitcoin formed a double top pattern near the Recent All-Time High (ATH) 📈 — a strong bearish signal 🔔.
A trendline break occurred right after the second peak, confirming potential weakness ⚠️.
🟠 Supply Zone:
Price re-entered a previous supply zone (resistance area) and failed to hold above it 🧱 — indicating sellers are active again.
🔵 EMA 70 (Blue Line):
The price has dropped below the 70 EMA, signaling momentum shift from bullish to bearish 📉.
🔴 STOP LOSS ZONE:
Positioned above 110,555 🚫 — risk level for this short setup if bulls reclaim control.
🟡 Bearish Pathway (Expected Move):
Price may retest the broken zone 🔁.
Followed by a sharp drop to the 1st support near $101,503 🎯.
Confirmed by large bearish volume spikes 📊.
💥 Trade Idea:
Entry: Near 106,000 (on retest of supply zone).
Stop Loss: Above 110,555 🔺.
Target: $101,500 🎯.
Risk/Reward Ratio: 🔥 Favorable setup for swing short sellers!
📛 Pattern Breakdown:
⚠️ Double Top = Reversal Signal.
🔻 Trendline Break = Shift in Market Structure.
🧊 Supply Zone Rejection = Bearish Confirmation.
BTC/USD Potential Bullish Reversal – Falling Wedge Breakout WatcBitcoin is showing signs of a potential reversal on the 15-minute timeframe. A Falling Wedge pattern is forming, often seen as a possible early signal for upside continuation.
📌 Technical Overview:
Price is currently testing the wedge resistance.
If price breaks out and retests the wedge, it could lead to a continuation toward the 108,995–109,199 zone.
Strong horizontal support seen around 104,636.
Bullish price action forming higher lows.
📈 Breakout Confirmation:
A clear breakout and retest of the descending trendline could initiate momentum toward the upper resistance zone.
🟢 Target Area: 108,995–109,199
🔴 Support Level: 104,636
⚠️ Invalidation: Below 104,300 zone
🔎 Always observe price action and volume confirmation before making decisions. Use proper risk management.

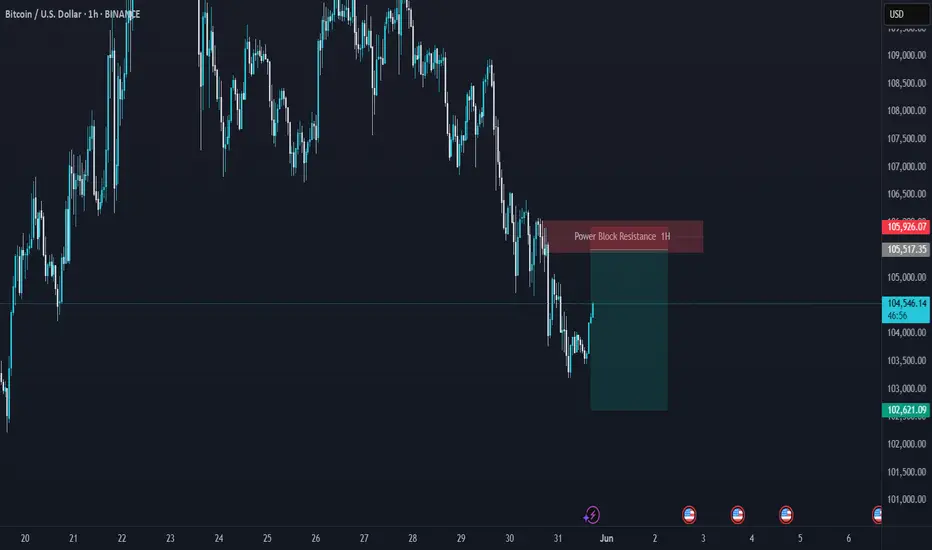
Bitcoin Price Analysis – 1H Chart (BINANCE)📊 Bitcoin Price Analysis – 1H Chart (BINANCE)
Date: May 28, 2025
Pair: BTC/USDT
Timeframe: 1 Hour (1H)
🏔 All-Time High (ATH) Rejection
🔴 Zone: ~111,800 – 112,000 USDT
BTC previously reached an ATH (marked in red) but failed to maintain momentum.
This level formed a double top pattern, a classic reversal signal.
📉 Key Resistance Zone
🟪 Range: ~109,500 – 110,500 USDT
Multiple rejections from this purple box indicate strong seller presence.
This area is now acting as a resistance barrier, preventing upward movement.
🔵 Support & Target Level
📍 Support Level: 106,622.06 USDT
🗨️ “when touch this level next target 100k”
The blue line represents a crucial short-term support.
The chart suggests a bearish move toward this level before a possible bullish reversal.
If price breaks below this, we could see further downside before any major rally.
🔄 Market Structure
🔹 BTC has formed a lower high structure, indicating weakening bullish momentum.
🔻 A head-and-shoulders pattern appears to be forming, which typically signals a reversal from bullish to bearish.
🧠 Trader Insight
📌 A drop to 106,622 USDT may act as a liquidity grab, potentially setting the stage for a major move upward.
⚠️ However, confirmation of a reversal (bullish signals, volume spike) will be critical before assuming a breakout to 100k as implied.
🔍 Conclusion
🚨 BTC is in a critical zone between resistance (~110,000) and support (~106,600).
📉 Near-term bias: Bearish → Targeting 106,622 USDT
📈 Medium-term possibility: Bullish rally only if support holds and sentiment shifts.

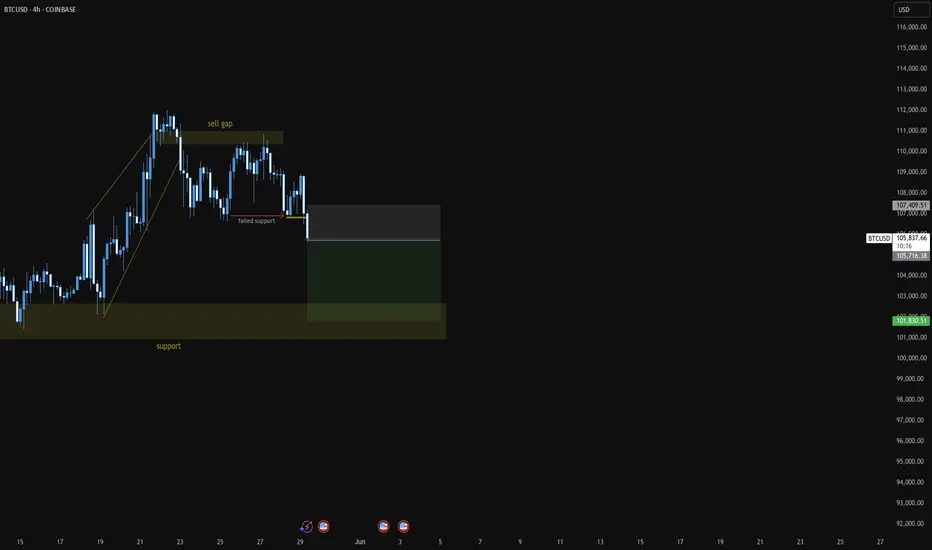
Sell to Bull supportbear pressure is established after the break of TL of the wedge channel. Followed by a strong bear BO that lead to a sell gap. Possible PB after current market made new low.
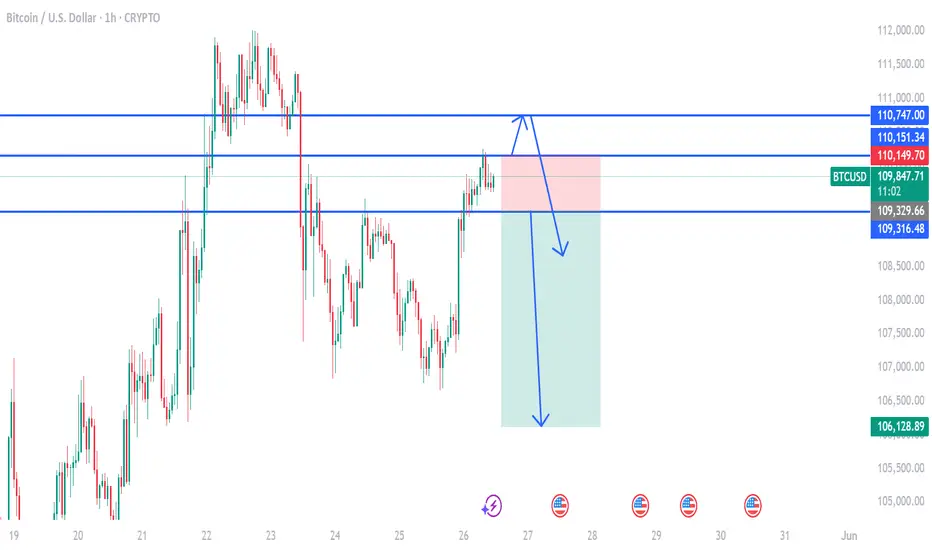
bitcoin on bearish#BTCUSD price have shown reverse trend which will drop below 106k.
Firstly we await for drop below 109300 for sell, Target 106k, SL 110151
But if prices move above 110151 Firstly then it will reach 110747 which will decline to head bearish.
Bullish is not valid yet.
#BTC
bitcoin needs a long term downward correction Bitcoin right now is in a overbought condition. technically it already gives sign for a downward correction . wait for the marking position. here you need to find the sell confirmation.