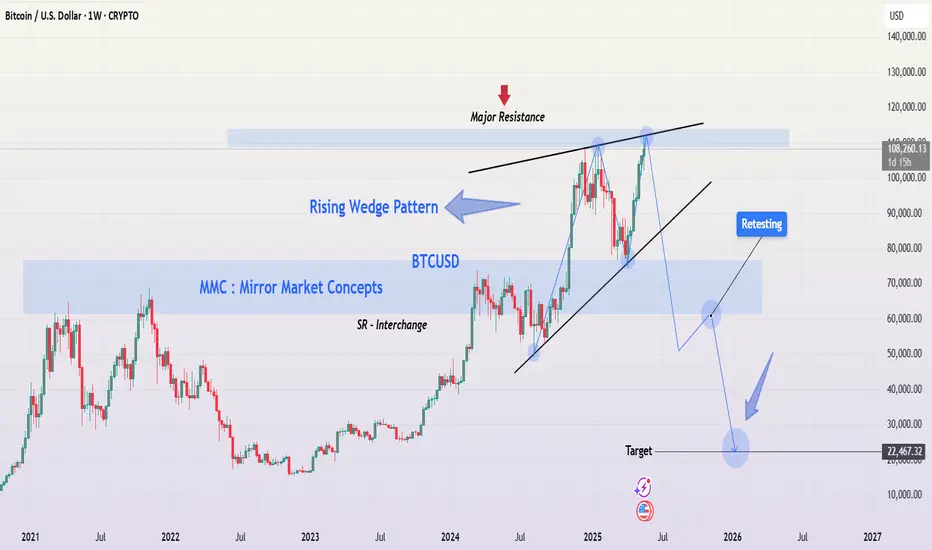
Bitcoin (BTC/USD) – Rising Wedge Pattern Signals & BreakdownThis chart illustrates a Rising Wedge Pattern on the weekly timeframe for Bitcoin (BTC/USD), which is generally considered a bearish reversal pattern in technical analysis. The pattern appears after a strong upward move and typically signals that the price is losing momentum and may be preparing for a significant correction.
📐 What is a Rising Wedge Pattern?
A rising wedge is a chart pattern formed when the price consolidates between two upward-sloping trendlines – the support line (bottom) and the resistance line (top) – with the two lines converging toward each other.
As price climbs higher, it forms higher highs and higher lows.
However, the slope of the highs is less steep than the slope of the lows, showing a loss of bullish strength.
Eventually, the price breaks below the support line, often leading to a sharp move downward.
🔍 Key Highlights from the Chart:
📌 1. Major Resistance Zone (~$110K–$120K):
BTC is currently facing heavy resistance in this area.
This zone has historically acted as a supply zone where bulls have struggled to break through.
Multiple rejection wicks indicate strong selling pressure.
📌 2. Pattern Touchpoints:
BTC has now formed multiple touchpoints on both the support and resistance lines of the wedge, confirming the structure.
This gives the pattern higher validity from a technical analysis perspective.
📌 3. SR Interchange Zone (~$65K–$70K):
This is a key horizontal zone where past resistance could act as future support.
A successful breakdown may first test this level before continuation.
📌 4. Retesting After Breakdown:
After breaking the wedge support, a retest of the broken trendline is often seen.
If the retest is rejected, it confirms the breakdown and opens the door to deeper bearish movement.
🎯 Target Projection:
If the wedge breaks down and the bearish scenario plays out, we could see Bitcoin fall to the $22,000–$25,000 region – marked as the final target zone on the chart. This level aligns with:
Previous macro-support zones from 2021
Fibonacci retracement levels
Psychological price levels where buyers may re-enter
⚠️ Bearish Factors to Watch:
Bearish divergence on indicators like RSI or MACD (not shown on chart but worth checking)
Volume decreasing as price rises – a classic wedge behavior
Macroeconomic headwinds or Bitcoin halving-related exhaustion
Rejection from major resistance with strong bearish candles
🕒 Timeframe & Patience:
This is a weekly chart, which means the pattern will play out over weeks or months, not days. Patience is key. A clear break, retest, and rejection would be the most reliable confirmation to expect further downside.
✅ Invalidation Scenario:
If BTC breaks above the wedge resistance line with strong bullish volume and holds above the $120K level, this bearish thesis becomes invalid.
In that case, BTC could enter price discovery mode, making new all-time highs.
💬 Final Thoughts:
This analysis is a technical outlook, not financial advice. Always use stop-loss strategies and manage your risk carefully. Market sentiment, news, and macro factors can quickly shift the scenario. However, from a purely technical standpoint, the rising wedge pattern is a powerful signal that should not be ignored.
Btcusdshort
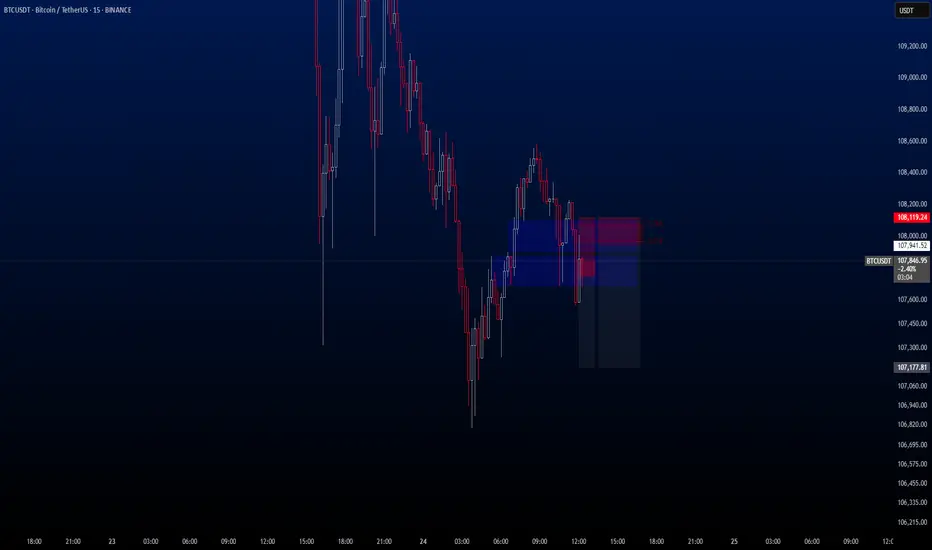
BTCUSDTHello Traders,
Despite it being the weekend, I’ve identified a short trade opportunity on BTCUSDT. The trade is currently active on my end, and anyone interested is welcome to consider entering as well.
🔍 Trade Details:
✔️ Timeframe: 15-Minute
✔️ Risk-to-Reward Ratio: 1:2 / 1:4
✔️ Trade Direction: Sell
✔️ Entry Price: 107,743.42
✔️ Take Profit: 107,181.56
✔️ Stop Loss: 108,119.24
🔔 Disclaimer: This is not financial advice. I’m simply sharing a trade I’ve taken based on my personal trading system, strictly for educational and illustrative purposes.
📌 Interested in a systematic, data-driven trading approach?
💡 Follow the page and turn on notifications to stay informed about upcoming trade ideas and advanced market insights.
Trump Tariffs Risk Triggering BTC Crash as Capital Flows to GoldOn May 23rd's U.S. session, Trump's EU/Apple tariff plans sparked market chaos:
Gold surged 💥 as a safe haven.
The euro plunged on EU tariff fears.
If tariffs persist, capital may flood into gold/forex, likely triggering a BTC crash.
⚡⚡⚡ BTCUSD ⚡⚡⚡
🚀 Sell@110000 - 109000
🚀 TP 106500 - 104500
👇Accurate signals are updated every day 📈 If you encounter any problems during trading, these signals can serve as your reliable guide 🧭 Feel free to refer to them! I sincerely hope they'll be of great help to you 👇

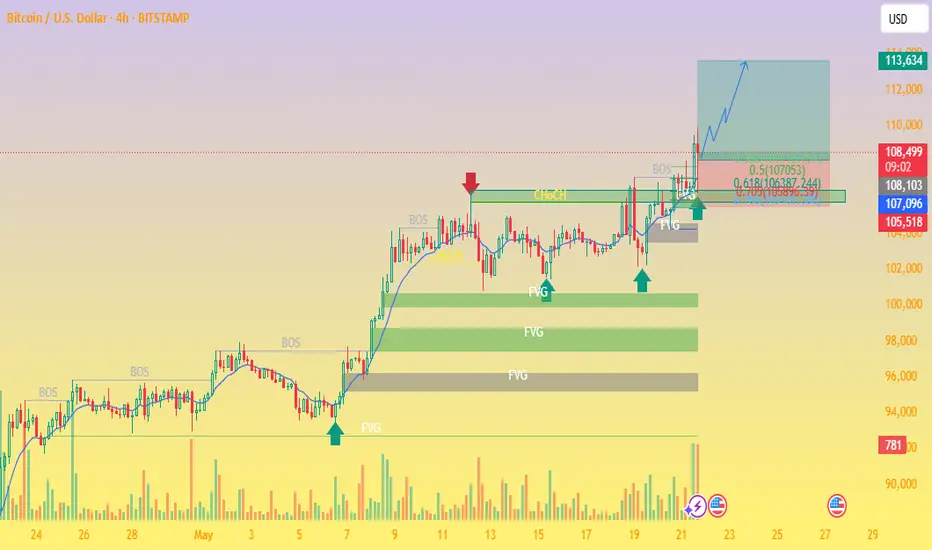
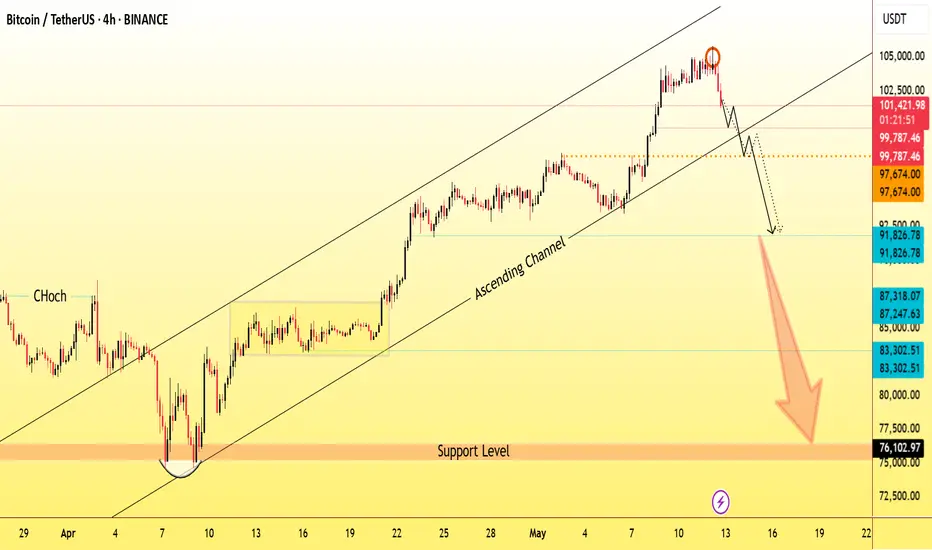
Bitcoin (BTC/USD) Timeframe: 4-HourCurrent Price: ~$108,120
Key Chart Elements:
🔹 BOS (Break of Structure):
Multiple BOS markers indicate continuation of bullish structure from late April onward.
Recent BOS near $107,000 confirms bullish momentum is active again after a brief consolidation.
🔹 CHoCH (Change of Character):
Initial CHoCH around $104,000 signals a trend reversal from previous downtrend to bullish structure.
Later CHoCH further confirms buyers taking control.
🔹 FVG (Fair Value Gaps):
Multiple FVG zones are marked below price (between ~$93,000 to ~$106,000).
These represent areas where price moved impulsively, possibly returning to fill gaps.
The most recent FVG (between ~$107,244 and ~$105,518) acted as a support zone on the current retracement.
🔹 Fibonacci Retracement:
Price bounced off between the 0.5 and 0.618 fib levels (~$107,000–$106,387), a typical reversal zone in a strong trend.
Current Setup & Projection:
Price has broken above resistance near $108,000, suggesting a bullish continuation.
Target zone projected at $113,634, supported by structure and volume breakout.
Strong bullish momentum is visible after the BOS, and the price retest of FVG confirms smart money accumulation.
Volume Analysis:
Noticeable volume spike with the most recent bullish breakout, supporting the continuation case.
No large bearish volume indicating supply absorption—bulls remain in control.
Summary:
Bitcoin has completed a successful breakout from consolidation with bullish confirmation through BOS, FVG support, and volume spike. As long as price holds above $107,000–$106,200, the target zone around $113,634 remains highly probable.
Bitcoin has put in a top and tail, the day has just begun!!!!Over the past 24 hours, Bitcoin has exhibited high volatility, with its price surging to an intraday high of $109,844.99 and dipping to a low of $105,090.90. The 24-hour trading volume reached $63.23 billion, underscoring the market's intense activity. Currently, Bitcoin's market capitalization stands at $2.16654 trillion, reinforcing its dominant position in the cryptocurrency market.
From the perspective of fund flows and market sentiment, the U.S. spot Bitcoin ETF has attracted $5.3 billion in capital inflows over the past three weeks, indicating increased institutional participation. The market's Greed Index remains at a elevated level of 76, reflecting widespread optimism among investors. However, this may also signal potential overheating risks in the market.
Technically, Bitcoin's weekly and daily charts show potential double-top patterns. If confirmed, these patterns could mark the end of the upward trend and trigger a significant correction.
In the market, there are no absolutes, and neither upward nor downward trends are set in stone. Therefore, the ability to judge the balance between market gains and losses is your key to success. Let money become our loyal servant.

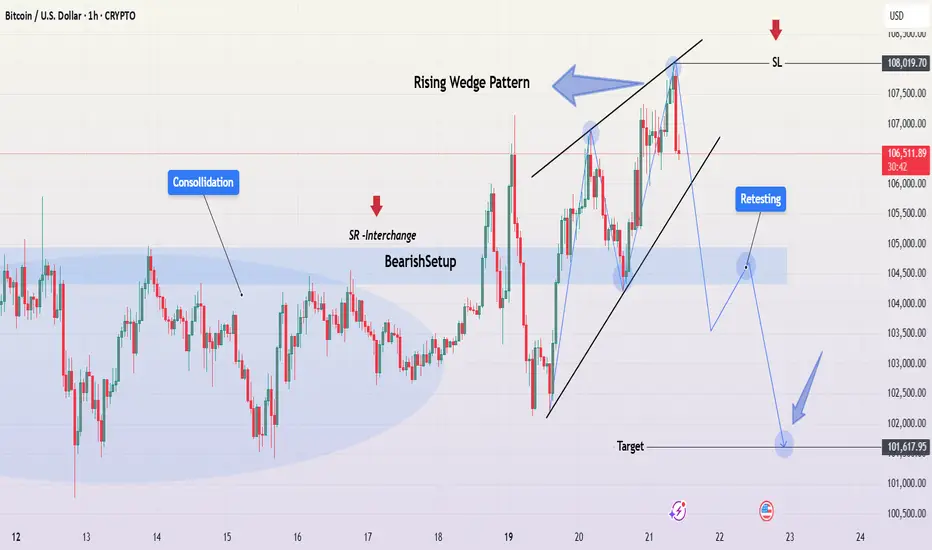
Bearish Reversal Confirmed – BTC Rising Wedge TrapBitcoin (BTCUSD) on the 1H timeframe is displaying a bearish reversal structure after failing to sustain a breakout above key resistance. The recent price action has formed a Rising Wedge Pattern, which typically precedes a downside correction, especially when formed near a key supply zone. Let’s break down the setup:
🔍 Technical Analysis Overview:
🔹 1. Rising Wedge Pattern (Bearish)
A rising wedge is visible near the top of the recent bullish impulse. This wedge is characterized by converging trendlines with higher highs and higher lows, but with diminishing momentum. It typically signals a weakening uptrend and a potential trend reversal or correction once price breaks below the lower wedge boundary.
The breakout to the downside has already begun, confirming bearish intent.
🔹 2. SR Interchange Zone
The blue zone marked in the chart represents a Support-Resistance Interchange (SR Flip). This was previously an area of consolidation and breakout, acting as a key decision zone. Price is expected to retest this zone after the wedge breakdown before continuing further down.
This creates a perfect "Break → Retest → Drop" scenario, often favored by institutional and swing traders.
🔹 3. Consolidation Structure
Before the wedge formation, Bitcoin was stuck in a prolonged consolidation phase. This type of ranging price action often accumulates orders before a breakout. Once broken, these zones serve as magnets for pullbacks or liquidity grabs, and are frequently retested.
🔹 4. Target Zone
The measured move from the rising wedge pattern points to a target near $101,617, which aligns with a previous structural low and a potential demand zone. This area could serve as the next major support level.
🎯 Trade Strategy & Setup:
Entry: After confirmation of breakdown and a clean retest of the SR zone.
Stop Loss (SL): Just above the wedge high and structural resistance (~$108,020).
Target (TP): $101,617 (downside projection based on wedge height and price structure).
📌 Risk-Reward Setup: 1:3+ possible if retest confirms.
🧠 Trader’s Insight:
This setup reflects a common smart-money behavior where price forms a bullish-looking structure (rising wedge), entices buyers, and then traps them with a swift breakdown. The SR retest provides a low-risk shorting opportunity. Patience is key — let price come to your level before entering.
🚨 Risk Note:
If BTC reclaims and holds above the $108,020 level, the bearish thesis may be invalidated. Always wait for confirmation before execution.
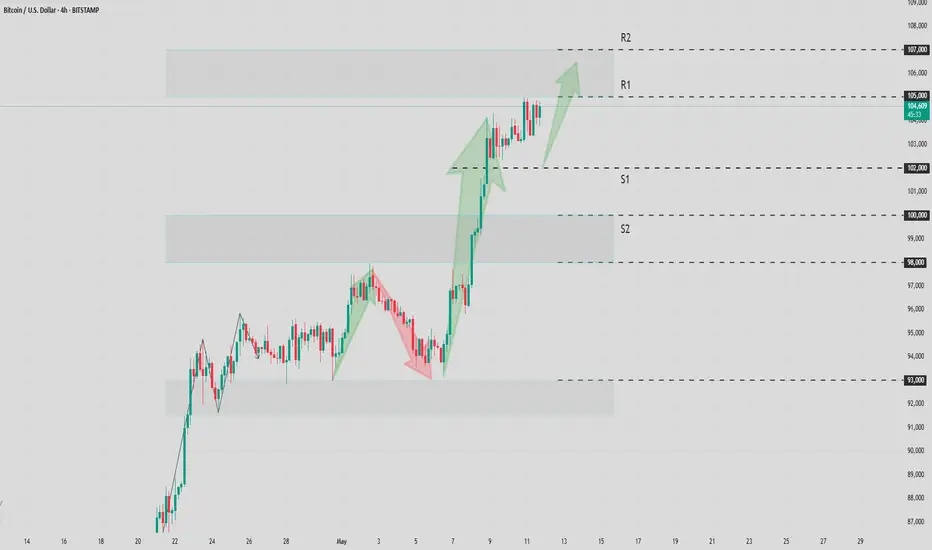
BTC Volatility Range Shifts Upward: Focus on Shorting The volatility range is moving upward, rising from 101,500–105,000 to 104,000–107,000 📈. It’s advisable to focus on shorting at higher levels ⏬. Currently, BTC is still in a range-bound fluctuation—just control your trade position sizes properly, and there won’t be any major issues essentially 😊!
⚡⚡⚡ BTCUSD ⚡⚡⚡
🚀 Sell@107000 - 106000
🚀 TP 104500 - 103500
👇Accurate signals are updated every day 📈 If you encounter any problems during trading, these signals can serve as your reliable guide 🧭 Feel free to refer to them! I sincerely hope they'll be of great help to you 👇

Analysis of BTC's Trend After Two Breakthroughs Above 105,000Recently, the price of BTC has been fluctuating within the range of 102,000-105,000 📊. It has broken through the 105,000 resistance level twice: the first breakout reached 106,000 💥, and today it strongly broke through to 107,000 🔥 before quickly retracing to the 102,000 support level ⬇️. After hitting the bottom, it rebounded rapidly to 105,000 📈. The current upward trend has not stalled 🚀, and shorting at high levels near 106,000 can be considered when the price rebounds to this area ⏳ 👉
⚡⚡⚡ BTCUSD ⚡⚡⚡
🚀 Sell@105000 - 106000
🚀 TP 102500 - 101500
🚀 Buy@101500 - 102500
🚀 TP 105000 - 106000
👇Accurate signals are updated every day 📈 If you encounter any problems during trading, these signals can serve as your reliable guide 🧭 Feel free to refer to them! I sincerely hope they'll be of great help to you 👇

BTCUSD buy opportunity next target The zone near 105,998 has been marked as a key resistance. BTC has previously failed to hold above this level, leading to sharp rejections.
Without strong volume confirmation, a breakout above this level may result in another bull trap.

BTC/USD:Trend Analysis for Next WeekSince April, BTC/USD has bottomed out and rebounded after hitting the vicinity of 74,500 US dollars twice. Currently, the price has strongly broken through the 100,000 US dollars mark. By observing its upward trend, a regular rhythm of "sharp rise + sideways movement" is evident — after each substantial rally, there is a period of sideways consolidation. Based on the current market conditions, it is recommended to adopt a strategy of selling high and buying low within the range of 102,000-105,000 US dollars to seize the band trading opportunities.
BTC/USD
buy@101500-102500
tp:105000-106000
sell@104500-105500
tp:103000-102000
I am committed to sharing trading signals every day. Among them, real-time signals will be flexibly pushed according to market dynamics. All the signals sent out last week accurately matched the market trends, helping numerous traders achieve substantial profits. Regardless of your previous investment performance, I believe that with the support of my professional strategies and timely signals, I will surely be able to assist you in breaking through investment bottlenecks and achieving new breakthroughs in the trading field.
BTCUSD Rectangle Pattern Breakout + Bearish Retest & Target🧩 Chart Overview
This chart captures a well-defined rectangle continuation pattern forming within a rising channel on the 1-hour timeframe. This setup is a classic combination of horizontal and diagonal price structure interaction, offering valuable insights into potential market behavior and trade opportunities.
🧱 Structure Breakdown
Rectangle Pattern: Price action was trapped in a sideways consolidation phase between the resistance zone (~104,800 - 105,400) and the support zone (~101,200 - 101,800).
This rectangle followed a strong bullish rally, which often implies a continuation pattern. However, the lack of follow-through from bulls near the resistance led to repeated failures to break out, suggesting weakening momentum.
Rising Channel: Within this rectangle, price respected a rising trendline support and resistance structure, forming a parallel ascending channel.
Bearish Breakout: The significant event occurred when BTC broke down below both the horizontal support of the rectangle and the lower boundary of the rising channel, triggering a structural shift from bullish to bearish.
🔁 Retesting Phase – What’s Happening Now
After the breakdown:
Price pulled back toward the prior support zone, which is now acting as resistance (a classic example of the support-turns-resistance principle).
This is commonly referred to as a retest, which validates the breakout and offers a lower-risk entry point for traders looking to short.
The retest area (around 101,500 - 102,000) is crucial. If price fails to reclaim this level and prints bearish confirmation (e.g., rejection wick, bearish engulfing candle), it increases the probability of downward continuation.
🎯 Trade Setup (Short Bias)
Entry Zone: 101,500 – 102,000 (on retest rejection confirmation)
Stop Loss: Above 103,000 (above prior highs and invalidation point)
Target 1 (TP1): 99,347 – key psychological and horizontal support level from prior structure
Target 2 (TP2): 97,277 – measured move of the rectangle height projected downward, aligning with previous demand area
This setup offers an attractive risk-to-reward ratio, assuming proper trade management and confirmation-based entry.
📊 Additional Technical Confluences
Bearish Momentum: The aggressive breakdown candle shows strong seller interest and increased volatility.
Volume: If confirmed with high selling volume during the breakdown and low buying volume during the retest, the move gains more credibility.
Trend Reversal Signals: The break of the channel and the rectangle support indicates potential trend reversal from short-term bullish to bearish.
RSI & Momentum Indicators (optional): Traders may use tools like RSI or MACD to confirm momentum shifts during retest.
📉 Psychological and Price-Level Significance
101,500 was a strong intraday support zone throughout the consolidation phase. Once broken, it flips polarity and acts as resistance.
The round-number level of 100,000 is always a psychological magnet for BTC. It often acts as a bounce or breakout zone, so traders should watch price behavior near this area closely.
Deeper demand may emerge around 97,000 – 96,500, which can serve as an extended target or reaccumulation zone depending on broader market conditions.
⚠️ Risk Management & Final Thoughts
This setup is high-probability only if the retest confirms rejection. Avoid early entries or assumptions before confirmation.
Always use proper stop-loss placement to avoid whipsaws or fake-outs.
Manage position sizing based on account size and risk tolerance.
News events or macro data can override technicals, so be aware of upcoming economic releases or sentiment shifts.
🧵 Conclusion
Bitcoin is showing clear signs of short-term weakness following the breakdown of a long-standing consolidation range within a rising channel. The ongoing retest provides an ideal area for short positioning, with clearly defined invalidation and profit targets.
✅ If bears defend the retest zone, expect downside continuation toward 99.3K and possibly 97.2K.

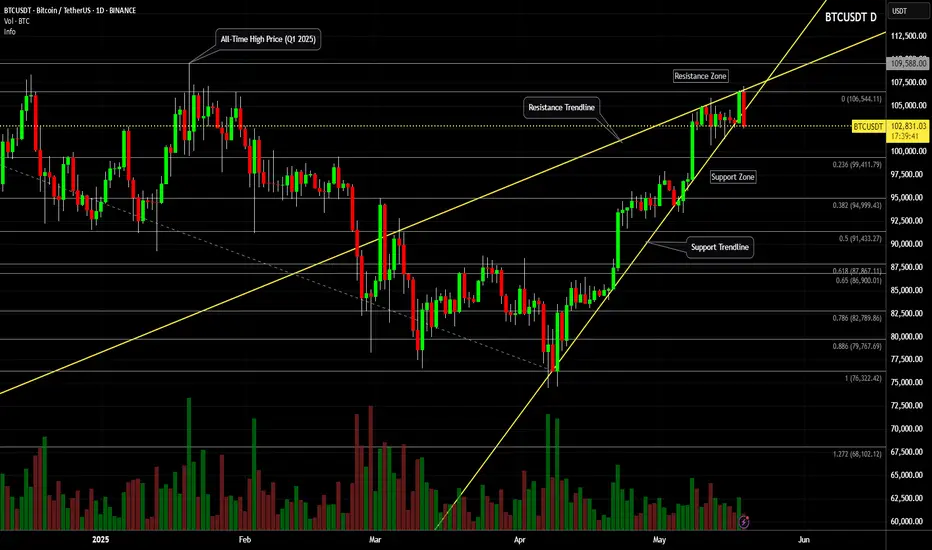
Bitcoin (BTC/USDT) - Support Trendline & Zone Price Test - DailyBitcoin (BTC/USDT) price recently rejected down from $107000 on May 19th, 2025.
The yellow Support Trendline below is currently being tested ($103000 price level).
Several candle body closes below the Support Trendline could signal weakness in the daily price trend (potential rising wedge pattern).
The April inverse head-and-shoulders price pattern and targets have been completed (+12% and +24%).
note: Breaking news, government law changes, corporate announcements, and crypto crime could affect the Bitcoin price and charts.
BTC/USD 1-Hour Range Analysis: Key Levels & StrategieBTC/USD 1-Hour Chart Analysis 📊
Currently, BTC/USD is oscillating within the 101,500–105,000 range on the 1-hour chart 📈.
Key Levels
Support: 101,500 acts as short-term support 🛡️. Below that, the strong support lies at 100,600 — a breach of this key level could trigger a sharp price decline.
Resistance: 105,000 is a tough resistance level 🚧, with multiple failed upward attempts. The area above 106,000 forms a resistance zone, which bulls must overcome to initiate a significant uptrend.
Trend
The price is in a downward consolidation phase, with recent highs and lows gradually decreasing. However, chart patterns suggest a potential rebound after testing support, hinting at a possible short-term trend shift 🤔.
⚡⚡⚡ BTCUSD ⚡⚡⚡
🚀 Sell@105000 - 106000
🚀 TP 102500 - 101500
🚀 Buy@101500 - 102500
🚀 TP 105000 - 106000
Accurate signals are updated every day 📈 If you encounter any problems during trading, these signals can serve as your reliable guide 🧭 Feel free to refer to them! I sincerely hope they'll be of great help to you 🌟

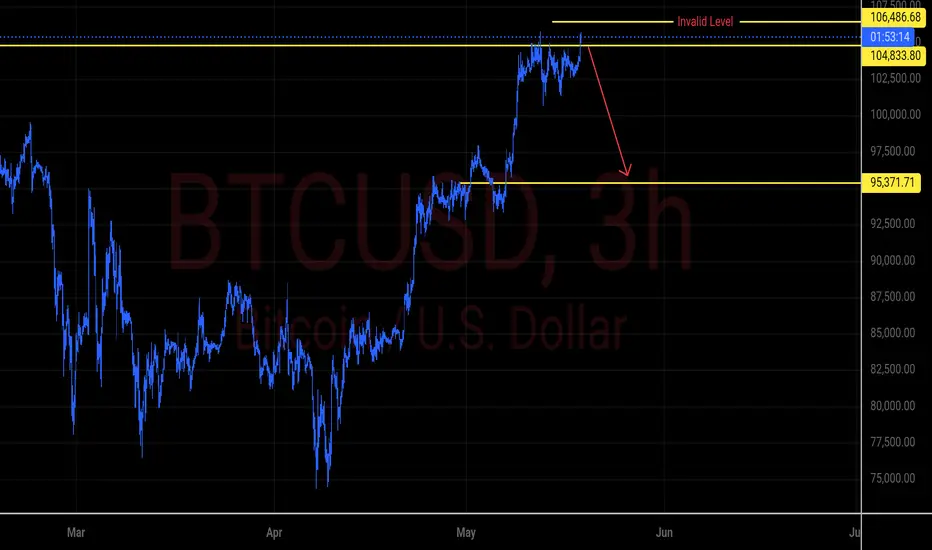
BTCUSD - Bearish Rejection Below Resistance | Targeting 95KBitcoin is currently facing strong resistance at $104,833, just below the invalidation level at $106,486. Price action suggests a potential rejection or distribution pattern forming near this resistance zone.
A break below recent local support could trigger a move toward the next key support level at $95,371, representing a significant retracement area from the recent uptrend.
---
Trade Idea:
Entry: After confirmation of rejection below $104,800
Target: $95,371
Invalidation: Sustained breakout above $106,486
This setup favors bears in the short term, as long as price remains below the invalidation zone.
---
> Disclaimer:
This analysis is for educational and informational purposes only and does not constitute financial advice. Always do your own research and consult with a professional before making any trading decisions. Trade at your own risk.
Bitcoin going to 98k ?There is a possible bearish move on the 1-hour timeframe.
There is rising wedge pattern using two converging yellow trendlines, this is a classic bearish reversal structure.
The wedge shows price making higher highs and higher lows, but with decreasing momentum.
Stop-Loss is marked above a recent swing high
Take-Profit is set near the lower ascending trendline, which aligns with the wedge’s breakdown target.

BTC/USD:Continue to adopt range trading.Based on the current market trend, today's strategy remains unchanged. Adopt the strategy of selling high and buying low within the range of $102,000 to $105,000, and seize the opportunities of swing trading.
BTC/USD
buy@101500-102500
tp:105000-106000
sell@104500-105500
tp:103000-102000
I am committed to sharing trading signals every day. Among them, real-time signals will be flexibly pushed according to market dynamics. All the signals sent out last week accurately matched the market trends, helping numerous traders achieve substantial profits. Regardless of your previous investment performance, I believe that with the support of my professional strategies and timely signals, I will surely be able to assist you in breaking through investment bottlenecks and achieving new breakthroughs in the trading field.
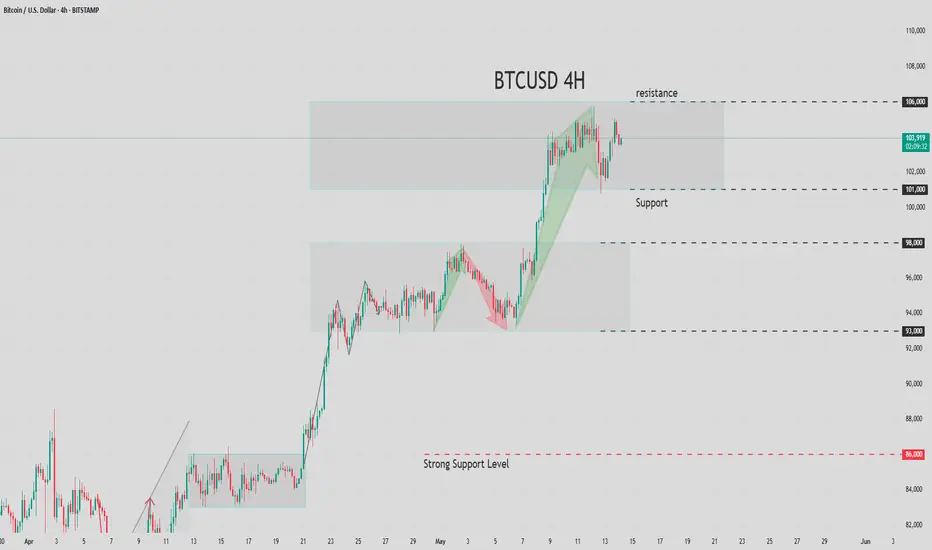
BTCUSD Next MoveNote: This chart presents a short-biased plan for BTC/USD based on key technical levels and price action signals.
🔍 Key Levels
: Resistance / All-Time High Area: $105,000
: Support Zone: Around $101,000
: Sell Trade TP1: $99,000
: Sell Trade TP2: $96,000
: Final Target: $93,500
: Critical Breakdown Level: $101,000 (Support)
📌 Plan Breakdown
🟦 Bearish Bias Setup:
> The market is consolidating between $101,000 support and $105,000 resistance, forming a range-bound structure near all-time highs.
> A breakdown below $101,000 support with a confirmed candle close below that level would trigger a sell signal.
> Rewritten chart note:
If the price breaks below the $101,000 support area and a candle closes beneath it, we can consider initiating a sell trade.
🔽 Downside Path:
: If the price breaks the support:
: First target: $99,000 — minor support.
: Second target: $96,000 — highlighted range zone.
: If the price breaks below $96,000, expect further downside toward $93,500 (final target).
🔄 Sideways Possibility:
: If the price breaks below $101,000 but fails to push through $96,000, the market may range between $96K–$99K before choosing a direction.
: The purple box (around $96K) is expected to be choppy — a break below confirms strong bearish continuation.

Thu 15th May 2025 BTC/USD Daily Forex Chart Sell SetupGood morning fellow traders. On my Daily Forex charts using the High Probability & Divergence trading methods from my books, I have identified a new trade setup this morning, and this is a BTC/USD Sell trade. As usual, you can see the details of the trade/s on the chart. Keep in mind that I am generally looking to buy when the MACD is below the zero level & sell when it is above the zero level. The red/blue QMP Filter dots on the price chart produce the actual trade signal. I am also considering things like divergence, support/resistance, round numbers etc, and these will be marked up on the chart. Enjoy the day all. Cheers. Jim

BTC/USD:Continue to adopt range trading.Based on the current market trend, today's strategy remains unchanged. Adopt the strategy of selling high and buying low within the range of $102,000 to $105,000, and seize the opportunities of swing trading.
BTC/USD
buy@101500-102500
tp:105000-106000
sell@104500-105500
tp:103000-102000
I am committed to sharing trading signals every day. Among them, real-time signals will be flexibly pushed according to market dynamics. All the signals sent out last week accurately matched the market trends, helping numerous traders achieve substantial profits. Regardless of your previous investment performance, I believe that with the support of my professional strategies and timely signals, I will surely be able to assist you in breaking through investment bottlenecks and achieving new breakthroughs in the trading field.
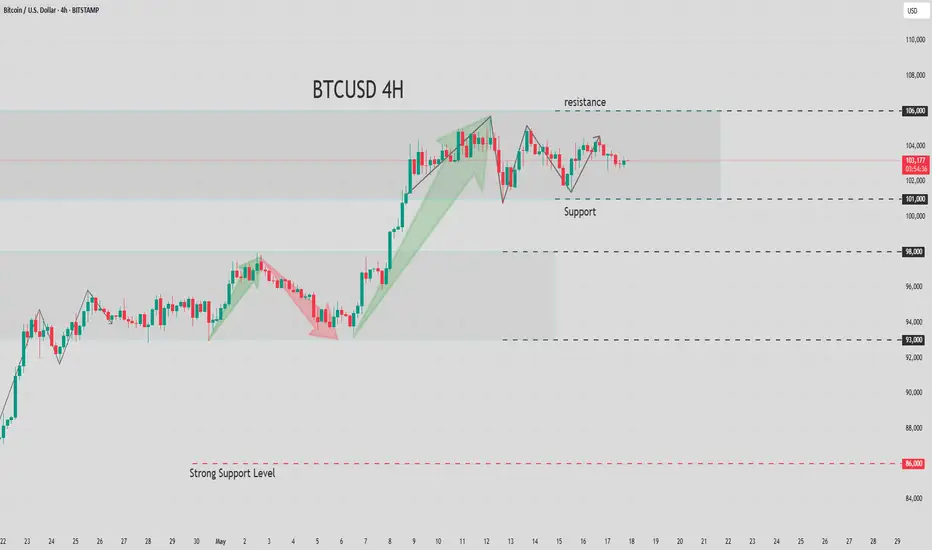
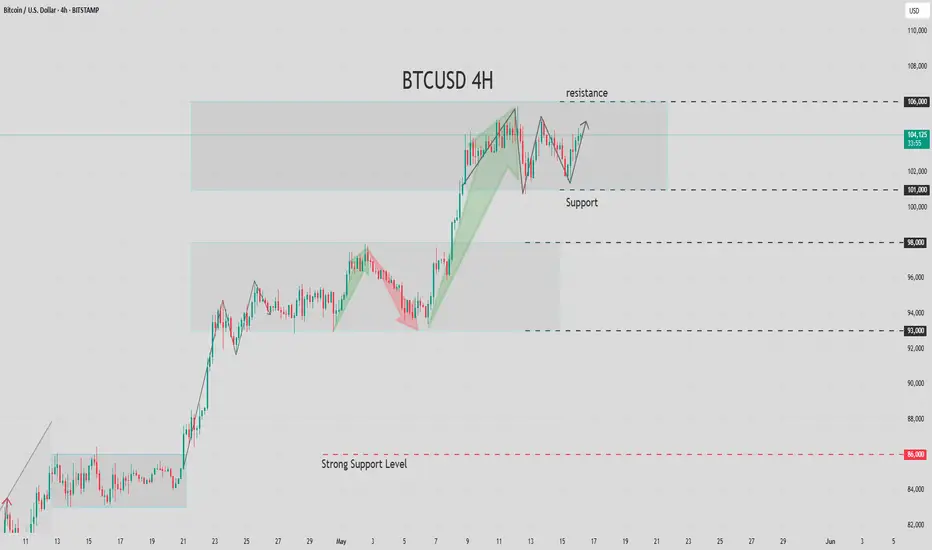
"Bearish Reversal Setup with Target at Key Support Zone (95,440 1. EMA Indicators:
50 EMA (red line): Currently at 103,112.73.
200 EMA (blue line): Currently at 98,739.46.
The price is above both EMAs, typically a bullish sign, but the analysis suggests a potential reversal.
2. Support Zone (Top Pink Box):
Around the 105,000–106,000 USD range.
Labeled as "support" but is likely being interpreted as a resistance now due to failure to break higher.
3. Target Zone (Bottom Pink Box):
Around the 95,000–96,000 USD range.
Marked as the "target point" for a potential drop.
4. Bearish Projection:
A curved arrow suggests a rejection from the current levels (~104,000 USD) leading down toward the target zone.
Large blue arrow emphasizes expected bearish momentum.
Interpretation:
The chart suggests a reversal from the recent highs and expects a decline toward the 95,440.94 USD support.
This could be driven by:
Rejection from resistance.
Overbought conditions.
Price losing momentum near the upper level.
Confirmation may be awaited via a break below the 50 EMA or loss of key support.
Strategy Implication:
Short bias if price fails to reclaim the resistance.
Take profit potentially near the 95,440 level.
Invalidation of the bearish scenario may occur on a strong breakout above the resistance zone (~105,700 USD).

BTC/USD:Range tradingSince April, BTC/USD has bottomed out and rebounded after hitting the vicinity of 74,500 US dollars twice. Currently, the price has strongly broken through the 100,000 US dollars mark. By observing its upward trend, a regular rhythm of "sharp rise + sideways movement" is evident — after each substantial rally, there is a period of sideways consolidation. Based on the current market conditions, it is recommended to adopt a strategy of selling high and buying low within the range of 102,000-105,000 US dollars to seize the band trading opportunities.
BTC/USD
buy@101500-102500
tp:105000-106000
sell@104500-105500
tp:103000-102000
I am committed to sharing trading signals every day. Among them, real-time signals will be flexibly pushed according to market dynamics. All the signals sent out last week accurately matched the market trends, helping numerous traders achieve substantial profits. Regardless of your previous investment performance, I believe that with the support of my professional strategies and timely signals, I will surely be able to assist you in breaking through investment bottlenecks and achieving new breakthroughs in the trading field.

SHARE THE IDEA ABOUT BTCUSD BEARISH PATTERNCurrent Market Overview:
Price Action: Bitcoin has rallied approximately 40% from its April lows, reaching a high near $105,525 today.
Support Levels: Key support is identified around $100,000, with additional support near $92,000.
Resistance Levels: Immediate resistance is observed around $107,000, with a potential upside target near $120,000 if bullish momentum continues.
Bearish Pattern Analysis:
While the broader trend remains bullish, certain patterns indicate possible short-term bearish movements:
Head and Shoulders Formation: Some analysts have noted a potential head and shoulders pattern forming, which could signal a reversal if confirmed.
Momentum Indicators: The Relative Strength Index (RSI) is above 70, suggesting overbought conditions that might precede a pullback.
BTCUSD: Analysis and Next Week's TrendFrom the 4-hour K-line chart of BTC, the bullish power in the market has been overwhelming. There have been six consecutive bullish candles. Last week,Not only has it successfully broken through the important defense line of the 100,000 mark, but it has also continued to rise with increasing trading volume after the breakthrough, indicating a strong bullish momentum.
The MACD indicator has been diverging above the zero axis, and the fast and slow lines are extending upward at an angle of 45 degrees. The RSI indicator remains in the overbought area above 70 without showing any obvious signs of turning down, which validates the strong characteristics of the current market trend.
When observed from the 1-hour time frame, the market is also dominated by bulls. The price has been steadily moving above the middle band of the Bollinger Bands. Although there have been pullbacks, each pullback has found effective support at the previous high, forming a standard bullish arrangement of higher highs and higher lows, and continuing to maintain an upward trend.
BTCUSD
buy@102500-103500
tp:105000-106000
I am committed to sharing trading signals every day. Among them, real-time signals will be flexibly pushed according to market dynamics. All the signals sent out last week accurately matched the market trends, helping numerous traders achieve substantial profits. Regardless of your previous investment performance, I believe that with the support of my professional strategies and timely signals, I will surely be able to assist you in breaking through investment bottlenecks and achieving new breakthroughs in the trading field.