BTC at Crucial Retest Zone — Bearish Setup in Play!Price Action Alert on #BTC/USDT (4H Timeframe)
#Bitcoin recently broke down from a rising wedge, a classically bearish pattern. Alongside this, we've also identified a bearish RSI divergence, further validating potential downside momentum.
Key Observations:
🔺 Rising wedge breakdown confirmed
📉 Bearish divergence on RSI (4H)
🔁 Price is now retesting the broken wedge from below (a classic bear signal!)
⛔️ Still holding above a key horizontal support — watching for a clean break here for confirmation
📌 Bearish Trade Setup (Waiting for Confirmation):
Entry: Below key support zone (marked on chart)
Target 1: $84,300
Target 2: $75,000
Stop-loss: Above wedge breakout point (100,500)
💼 Always follow proper risk management!
🧠 Why This Matters:
The combination of pattern breakdown, bearish divergence, and a retest zone is a powerful signal — but patience is key. We wait for full confirmation (support break) before executing any short trade.
📣 What do you think — will #BTC break the support or bounce back? Drop your thoughts in the comments! 🗣️
If you found this analysis helpful, like, comment, and follow for more real-time setups! 🚀
#BTC #Bitcoin #CryptoAnalysis #PriceAction #Bearish #ShortSetup #RisingWedge #TechnicalAnalysis #CryptoTrading #TradingView
Btcusdshort

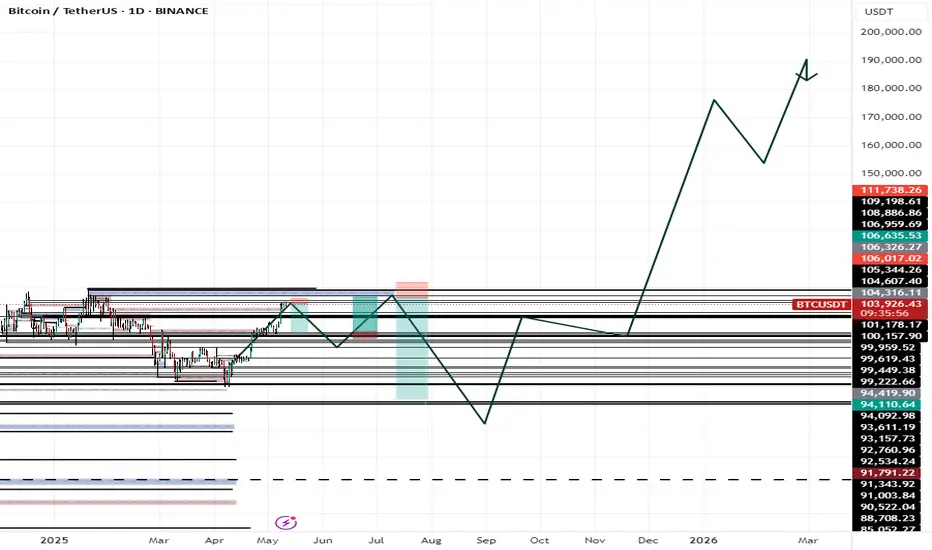
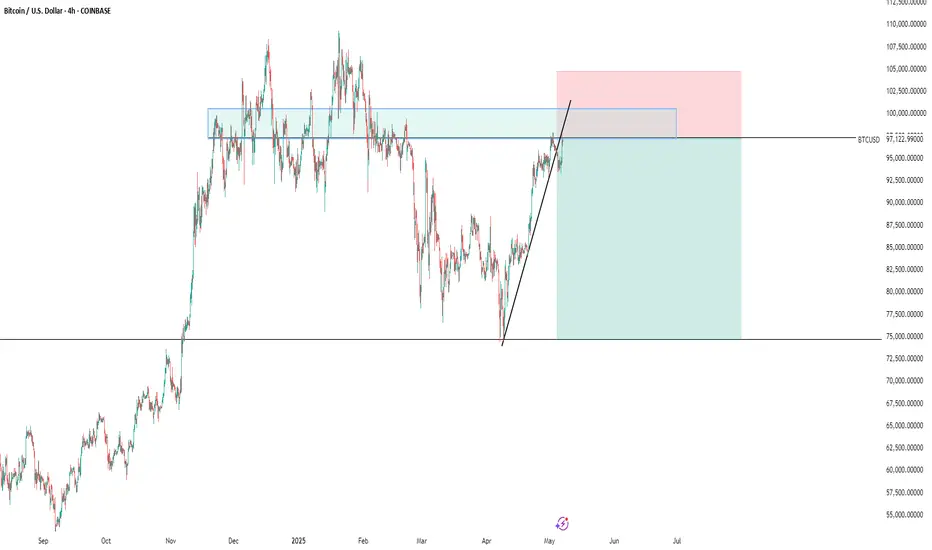
BTCUSDT SHORTHere’s the translation for your analysis:
"The price here is a good level to open a sell position. The future buy and sell levels I've marked are based on the perspective it creates for us, but for now, it's just a viewpoint."
ITS POSSIBLE SCENARIO FOR BTCUSDT.
BTC/USD) Resistance level pullback Read The ChaptianSMC Trading point update
Technical analysis of Bitcoin (BTCUSDT), highlighting key levels and potential price movements based on trend channels, support/resistance, and RSI. Here's the breakdown:
---
Key Elements in the Analysis:
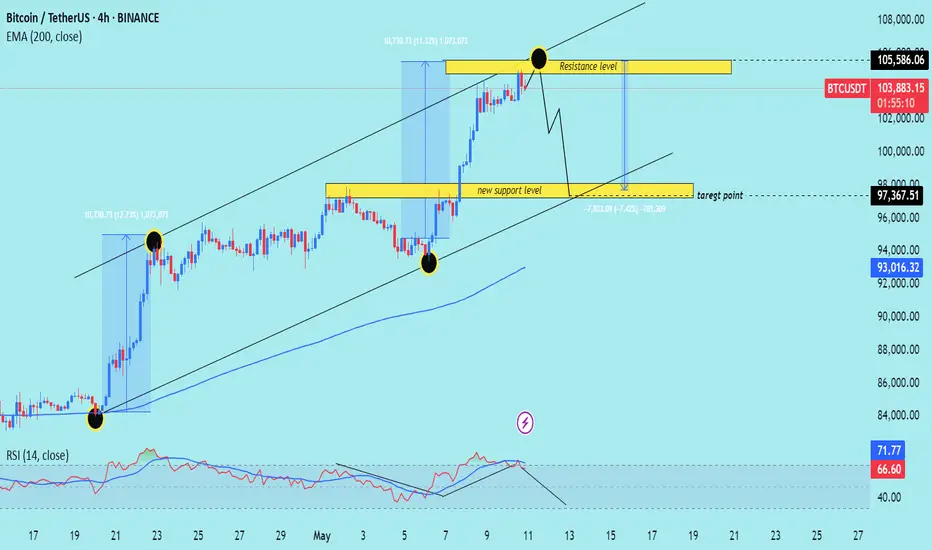
1. Trend Channel:
BTC is trading within an ascending channel, indicating an ongoing bullish trend.
The recent price action hit the upper boundary (resistance) of the channel, suggesting potential for a pullback.
2. Resistance Zone:
105,586.06 is marked as a resistance level, where price faced rejection.
Strong reaction here suggests sellers are defending this area.
3. Support Zone:
A new support level is established around 98,000.
This zone aligns with the lower boundary of the ascending channel and previous breakout structure.
4. Target Point (Bearish Projection):
The chart projects a potential drop to the 97,367.51 level, representing a ~7.4% correction.
This move mirrors the prior leg up, applying a measured move concept.
5. RSI Indicator:
RSI is around 66–71, indicating overbought conditions.
A bearish divergence or trendline break on RSI suggests weakening momentum.
Mr SMC Trading point
---
Summary of Trading Idea:
Bias: Short-term Bearish (correction within an overall bullish trend)
Expected Move: Potential dip toward 97,367.51 support
Confirmation: Rejection at resistance, RSI divergence, and trendline break
Invalidation: A strong breakout above 105,586.06 would nullify the correction setup and favor continued bullish movement
pelas support boost 🚀 analysis follow)
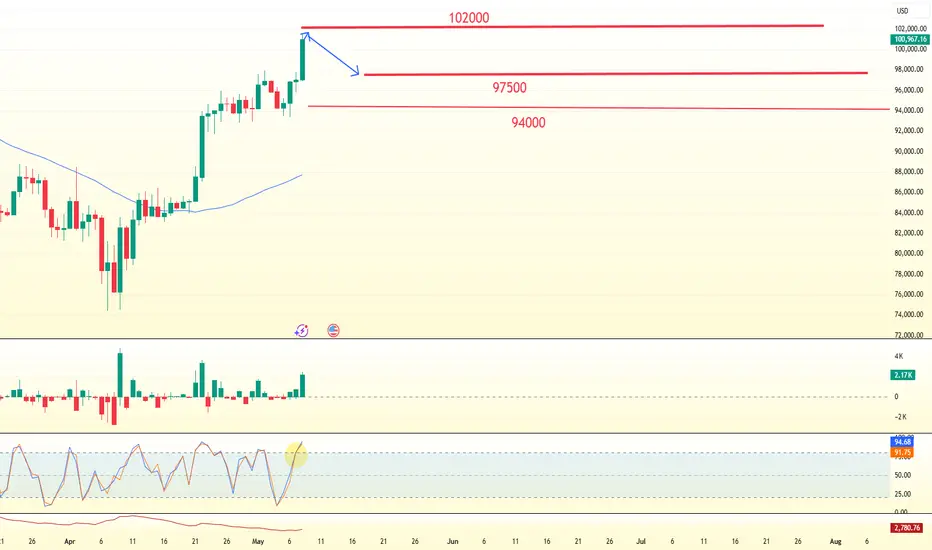
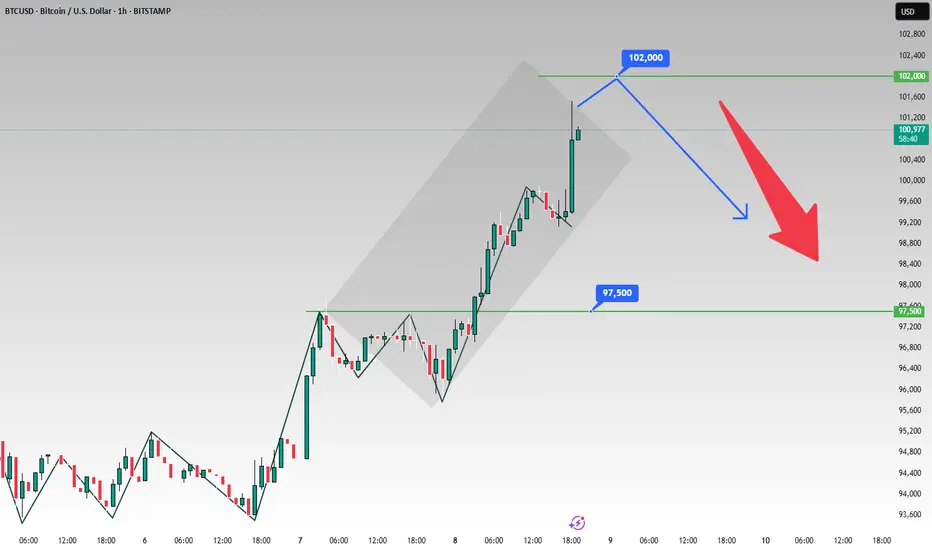
Bitcoin – Price Hits $100KThe current price of Bitcoin has soared all the way, breaking the 100,000 mark. Thumzup, a listed company on the US stock market, has announced its plan to raise up to $500 million for its Bitcoin acquisition strategy. Metaplanet, a listed company in Japan, has once again spent $53.4 million to increase its holdings of 555 Bitcoins. In addition, New Hampshire has become the first state in the United States to pass the Strategic Bitcoin Reserve Act, authorizing the state's treasurer to hold Bitcoins in a regulated reserve structure. This has led some local governments to regard Bitcoin as a strategic reserve asset with long-term value. The Federal Reserve has announced that it will maintain the benchmark interest rate at 4.25%-4.50%, which is in line with market expectations. Moreover, the Federal Reserve's meeting minutes imply that interest rates may start to be cut in July, and the market has reacted optimistically to this, to a certain extent, driving up the prices of cryptocurrencies such as Bitcoin.
you are currently struggling with losses, or are unsure which of the numerous trading strategies to follow, at this moment, you can choose to observe the operations within our channel.
Trading Strategy:
sell@101500-102000
TP:97500-98000
Gold's Slide Powers BTC Past 100K: Time to Short at Highs🚀 BTC Explodes Past the 100,000 Milestone!
Today, BTC shattered the highly anticipated 100,000 mark, sending shockwaves through the crypto market. But this remarkable rally came at a steep cost—💥 many traders faced liquidations, wiping out their accounts as the price volatility reached a fever pitch.
💎 The Gold - Crypto Connection
Interestingly, as gold continues its noticeable downward slide 📉, virtual currencies are stepping in as an alternative haven. The influx of capital seeking new opportunities has fueled the upward trajectory of cryptos, firmly establishing their bullish momentum.
📈 What’s Next?
With the 100,000 resistance now decisively breached, BTC is poised to climb even higher, riding the wave of its recent triumph 🌊. But savvy traders are eyeing a strategic play: once the price hits a peak, it could be prime time to short at the highs ⏳—a move that balances the allure of profit with the inherent risks of a volatile market.
⚡⚡⚡ BTCUSD ⚡⚡⚡
🚀 Sell@101000
🚀 TP 98000 - 97000
Accurate signals are updated every day 📈 If you encounter any problems during trading, these signals can serve as your reliable guide 🧭 Feel free to refer to them! I sincerely hope they'll be of great help to you 🌟
BTC/USD:range tradingBTC/USD is currently fluctuating within the range of $96,000 to $98,000. We can adopt the strategy of selling high and buying low.Until it breaks through this range.
BTC/USD
sell@98000-97500
tp:96000-95500
buy@95000-95500
tp:97000-97500
I am committed to sharing trading signals every day. Among them, real-time signals will be flexibly pushed according to market dynamics. All the signals sent out last week accurately matched the market trends, helping numerous traders achieve substantial profits. Regardless of your previous investment performance, I believe that with the support of my professional strategies and timely signals, I will surely be able to assist you in breaking through investment bottlenecks and achieving new breakthroughs in the trading field.

BTC/USD:range tradingAfter multiple probes over the course of two days, BTC/USD once again challenged the threshold of $95,000 and successfully achieved a breakthrough. Currently, its price fluctuates within the range of $95,000 to $98,000. Within this range, investors can adopt a trading strategy of selling high and buying low. Once a new breakthrough occurs, they can flexibly adjust their trading strategies according to the direction of the breakthrough.
BTC/USD
sell@98000-97500
tp:96000-95500
buy@95000-95500
tp:97000-97500
I am committed to sharing trading signals every day. Among them, real-time signals will be flexibly pushed according to market dynamics. All the signals sent out last week accurately matched the market trends, helping numerous traders achieve substantial profits. Regardless of your previous investment performance, I believe that with the support of my professional strategies and timely signals, I will surely be able to assist you in breaking through investment bottlenecks and achieving new breakthroughs in the trading field.

btcusd sell signal. Don't forget about stop-loss.
Write in the comments all your questions and instruments analysis of which you want to see.
Friends, push the like button, write a comment, and share with your mates - that would be the best THANK YOU.
P.S. I personally will open entry if the price will show it according to my strategy.
Always make your analysis before a trade
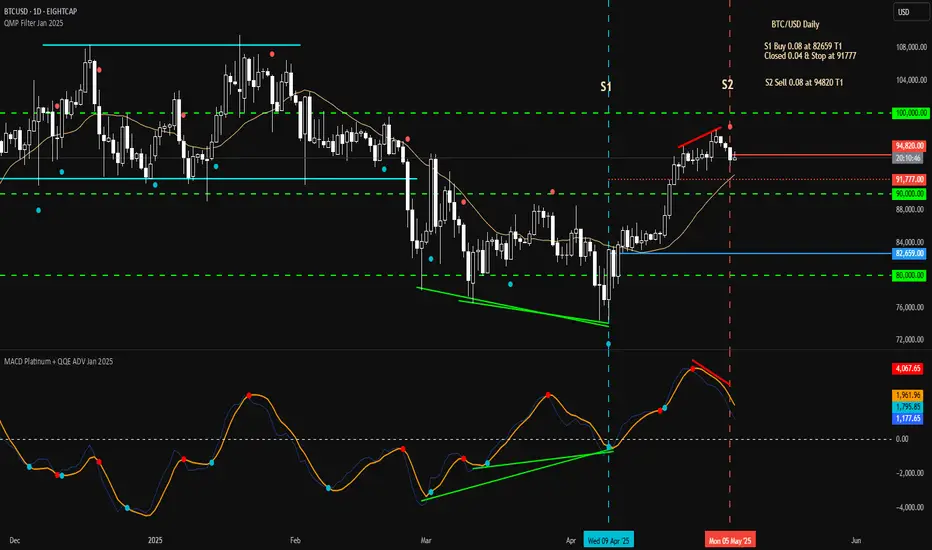
Tue 6th May 2025 BTC/USD Daily Forex Chart Sell SetupGood morning fellow traders. On my Daily Forex charts using the High Probability & Divergence trading methods from my books, I have identified a new trade setup this morning. As usual, you can read my notes on the chart for my thoughts on this setup. The trade being a BTC/USD Sell. Enjoy the day all. Cheers. Jim
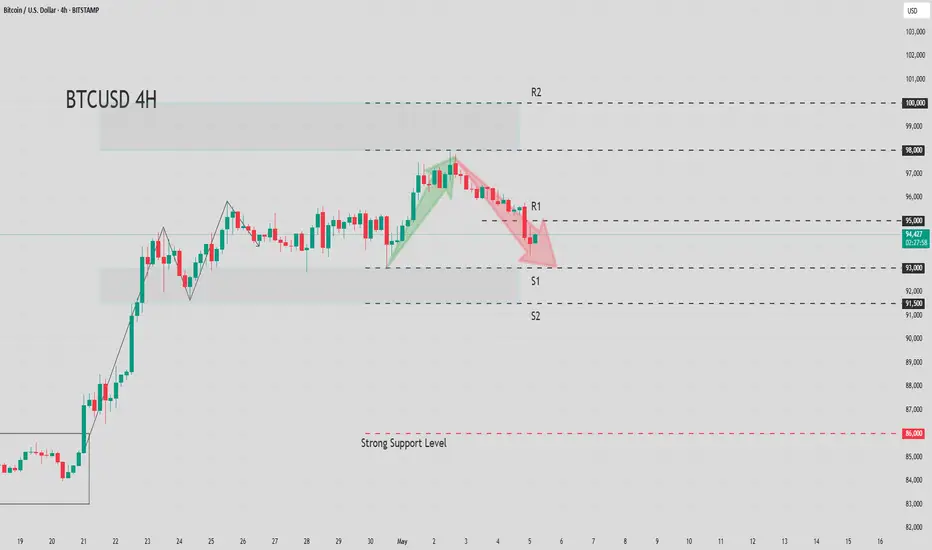
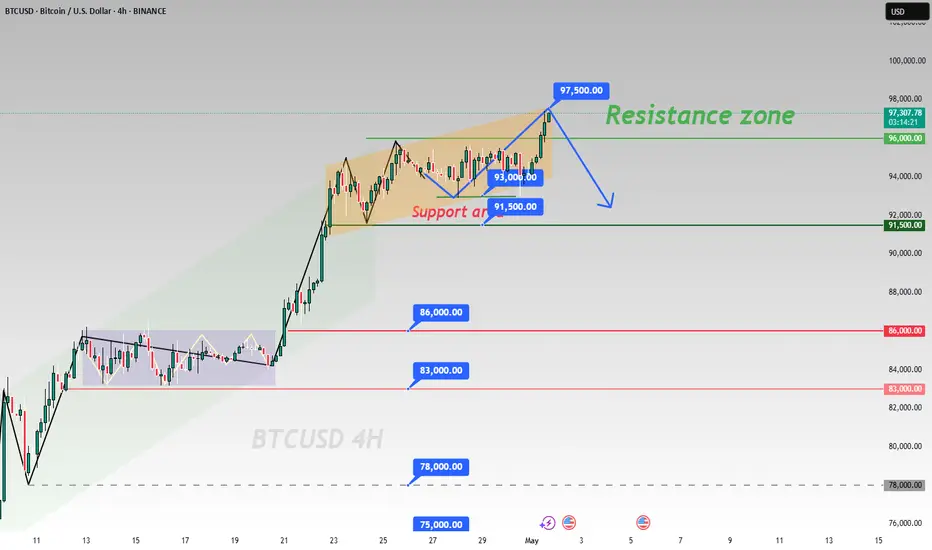
BTCUSD NEXT MOVE BUYYYDisrupted (Bearish) Analysis:
Current Setup:
The chart shows Bitcoin ( AMEX:BTC ) bouncing from a support zone around $94,000.
The analysis suggests a bullish reversal toward the resistance around $97,500.
Bearish Counterpoints:
Lower High Structure: Recent price action shows a series of lower highs and lower lows, suggesting continued downtrend pressure.
Volume Weakness: The volume during the bounce from support is declining, indicating weak buying interest and potential for a fakeout.
Rejection Risk at Mid-Level Supply: The price is near a local supply zone (~$94,800–$95,000) that could act as resistance again.
Macro Context: If macroeconomic data or Fed policy is hawkish this week, it could lead to risk-off sentiment, affecting BTC negatively.
Bearish Scenario:
BTC fails to hold the $94,000 support zone.
Breakdown leads to a retest of $93,000–$92,500, the next significant demand zone.
If panic sets in or liquidity is swept under $94K, we could see a move toward $90,000.
Visual Disruption Suggestion:
Replace the upward blue arrow with a downward red arrow.
Mark a new support target near $92,500.
Indicate a potential fakeout just above the current resistance zone

BTCUSD short-term view.It is a good opportunity to sell BTCUSD in real time. Short-term is based on the right side of the swing trading, with a target of 93000-92500. In addition, the uncertainty of the news on BTCUSD. It is a good time to sell now.

BTCUSD Daily Trend Analysis from May 05, 2025Based on my analysis, BTCUSD is likely to experience a bearish trend over the next four trading days. A sell signal has been confirmed, with a stop-loss set at 97,939. Key support levels to watch are 83,974 and 80,491 — the latter becoming relevant only if the price breaks and closes below 83,974.
Please note: this is a personal market outlook and not a trading recommendation. Traders should rely on real-time technical analysis and implement appropriate risk management practices before making any trading decisions.

BTCUSD: Break of Key Level in the Early Trading SessionDuring the early trading session, BTCUSD continued its weak trend. After the price broke below the key support level of $95,000, it kept declining. This price level quickly transformed into a resistance after being breached, suppressing any potential rebound. Currently, the bearish momentum is dominant, and the short-term market sentiment has turned cautious. If it fails to regain the lost ground of $95,000 in the future, the price is likely to decline further, and the next target will be the important support area of $93,000.
BTCUSD
sell@94500-95000
tp:93500-93000
I am committed to sharing trading signals every day. Among them, real-time signals will be flexibly pushed according to market dynamics. All the signals sent out last week accurately matched the market trends, helping numerous traders achieve substantial profits. Regardless of your previous investment performance, I believe that with the support of my professional strategies and timely signals, I will surely be able to assist you in breaking through investment bottlenecks and achieving new breakthroughs in the trading field.
BTCUSDTLooks like BTCUSDT wants to make us smile again 🙂 A new opportunity for a Sell signal has emerged, and I’ll be taking advantage of it. However, don’t forget that in 35 minutes**, the *U.S. Services Purchasing Managers' Index (PMI)* data will be released — and that could cause some market volatility. I’m opening the trade with that in mind, so make sure you adjust your risk accordingly.
🔍 Criteria:
✔️ Timeframe: 15M
✔️ Risk-to-Reward Ratio: 1:1.60
✔️ Trade Direction: Sell
✔️ Entry Price: 94333.33
✔️ Take Profit: 93908.54
✔️ Stop Loss: 94598.39
🔔 Disclaimer: This is not financial advice. It's a trade I’m taking based on my own system, shared purely for educational purposes.
📌 If you're also interested in systematic and data-driven trading strategies:
💡 Don’t forget to follow the page and subscribe to stay updated on future analyses."

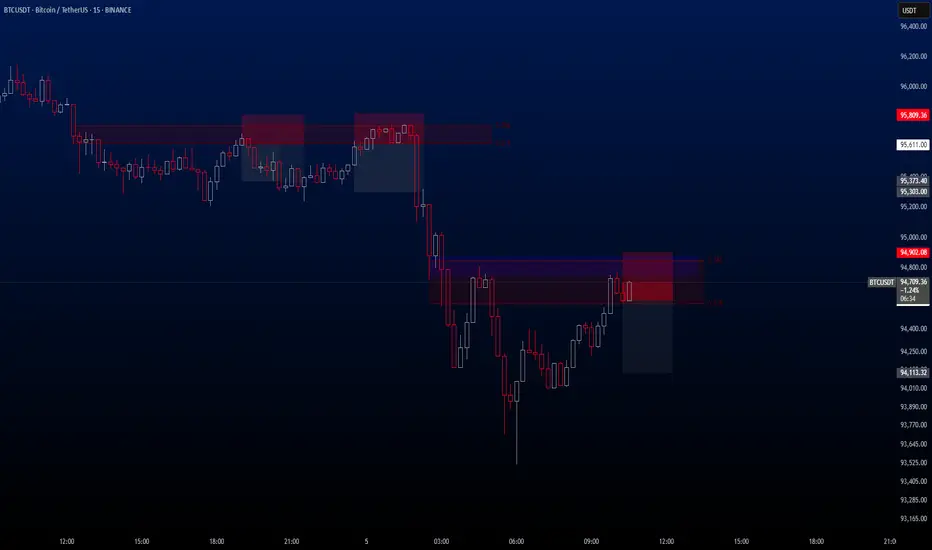
BTCUSDT Take ProfitHave I ever told you how much I love BTC? 😄 Yes! Our BTCUSDT trade has hit Take Profit!
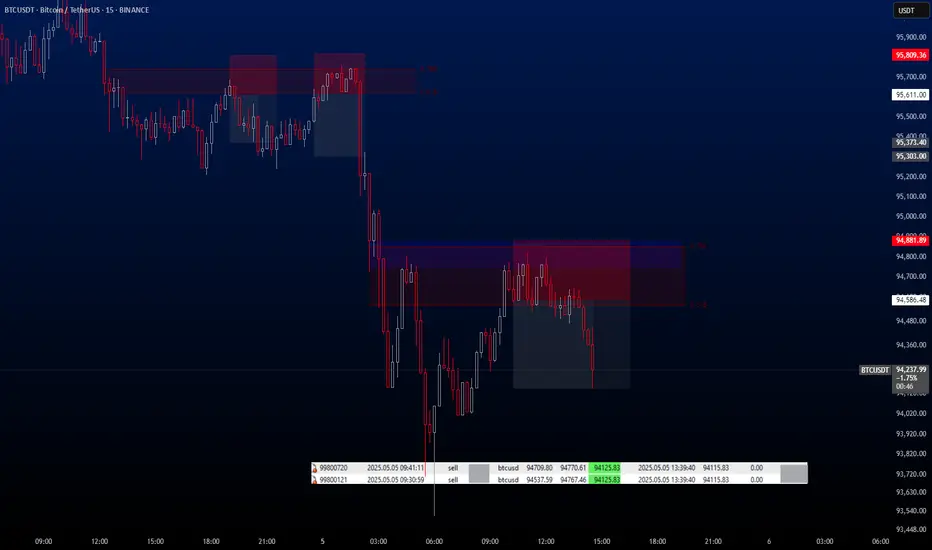
BTCUSDTHello everyone! The downtrend in BTCUSDT continues with strong volume. Since May 3rd, the bearish trend has remained intact, and the current delta rate stands at -45%.
This indicates that the downward momentum is likely to continue for a while.
Therefore, I’m planning to open a short position on BTCUSDT.
You can find the entry, exit, and TP levels below.
🔍 Criteria:
✔️ Timeframe: 15M
✔️ Risk-to-Reward Ratio: 1:1.50
✔️ Trade Direction: Sell
✔️ Entry Price: 94586.48
✔️ Take Profit: 94113.32
✔️ Stop Loss: 94902.08
🔔 Disclaimer: This is not financial advice. It's a trade I’m taking based on my own system, shared purely for educational purposes.
📌 If you're also interested in systematic and data-driven trading strategies:
💡 Don’t forget to follow the page and subscribe to stay updated on future analyses.
Trading suggestions for BTCTwo days ago, I accurately predicted that the price of BTC would break through 97,500! 🚀
Currently, BTC is finding it difficult to break through the resistance level of 98,000 ⚠️. Given the current situation, it is recommended to decisively adopt a short-selling strategy at a high price level 📉.
⚡⚡⚡ BTCUSD ⚡⚡⚡
🚀 Sell@97500
🚀 TP 96000 - 95000 - 94000
Accurate signals are updated every day 📈 If you encounter any problems during trading, these signals can serve as your reliable guide 🧭 Feel free to refer to them! I sincerely hope they'll be of great help to you 🌟

Sell@97500, TP 96000 - 95000 - 94000🎉 Yesterday, I accurately predicted that the price of BTC would break through 97,000! 🚀 Now, a pullback is on the horizon ⬇️. Keep an eye on the support level at 93,000! 👀
⚡⚡⚡ BTCUSD ⚡⚡⚡
🚀 Sell@97500
🚀 TP 96000 - 95000 - 94000
Accurate signals are updated every day 📈 If you encounter any problems during trading, these signals can serve as your reliable guide 🧭 Feel free to refer to them! I sincerely hope they'll be of great help to you 🌟
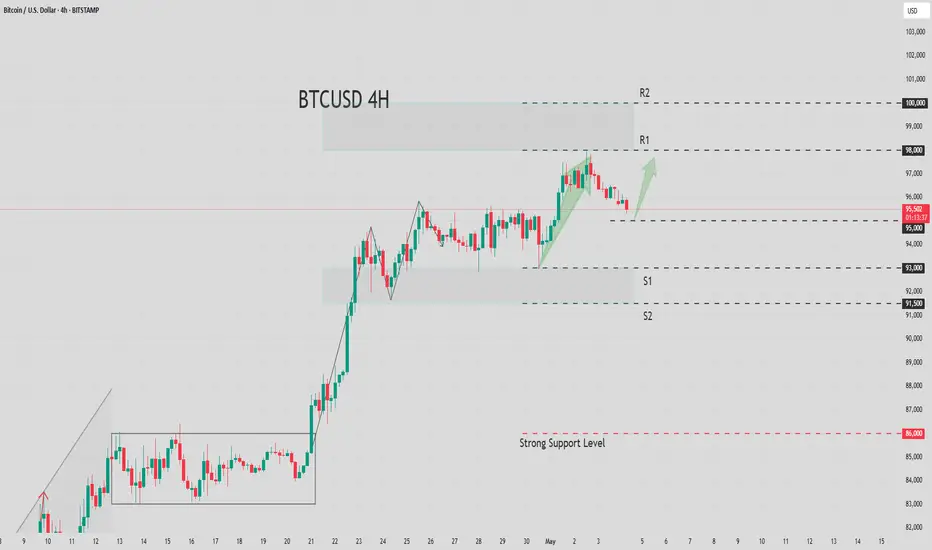
BTCUSD: Gathering Momentum for a BreakthroughThe price of BTCUSD strongly broke through the threshold of $97,000 this week, showing a robust upward momentum. Although there has been a pullback currently, it still remains in a strong uptrend above $95,000 overall. In the short term, the primary target for the upward movement is $98,000. If this level is broken through, the focus will shift to the significant psychological level of $100,000. However, when the price of BTCUSD approaches the level of $98,000, this area will form a resistance, and investors should be cautious about the potential risk of a pullback. If it unexpectedly breaks below the support level of $93,000, it may pull back to the area around $89,000.
Taking all factors into consideration, the overall trend of BTCUSD next week is relatively optimistic, with a high probability of continuing to break through upwards. However, the risk of a pullback should also be watched out for. There are uncertainties in the market, and macroeconomic factors such as the progress of negotiations between the United States and its major trading partners may also have an impact on the price of Bitcoin. Therefore, relevant news should be closely monitored.
I am committed to sharing trading signals every day. Among them, real-time signals will be flexibly pushed according to market dynamics. All the signals sent out last week accurately matched the market trends, helping numerous traders achieve substantial profits. Regardless of your previous investment performance, I believe that with the support of my professional strategies and timely signals, I will surely be able to assist you in breaking through investment bottlenecks and achieving new breakthroughs in the trading field.
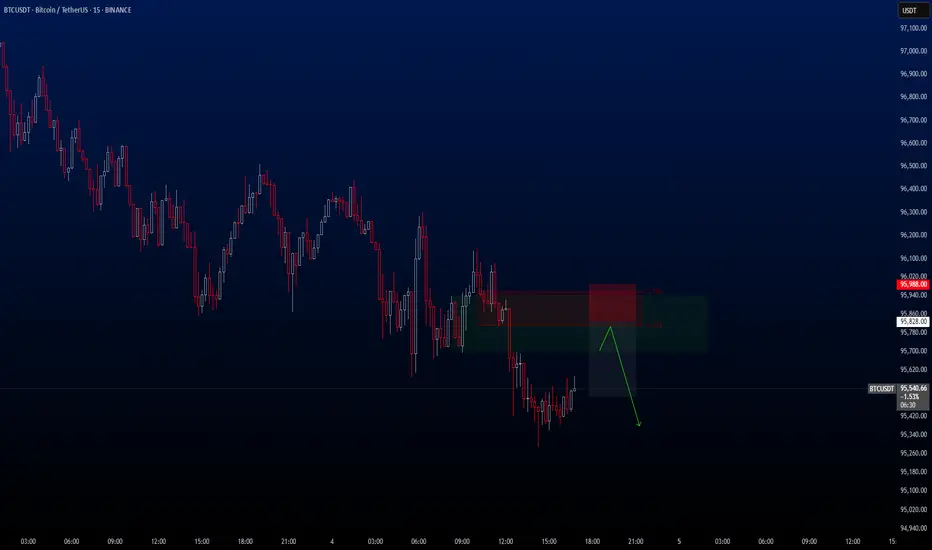
BTCUSDTI’ve cancelled this trade. The new setup will be the one I’m sharing now. 🔄📉
A potential short signal is forming on BTCUSDT. However, it's not ideal to open the sell position right now — we need to wait for the price to reach a specific level. Once it does, we can execute the trade.
So, what are the entry, TP, and SL levels for this setup?
If you’ve just started following me, let’s get started!
🔍 Criteria:
✔️ Timeframe: 15M
✔️ Risk-to-Reward Ratio: 1:1.50 / 2
✔️ Trade Direction: Sell
✔️ Entry Price: 95652.05
✔️ Take Profit: 95300.05
✔️ Stop Loss: 95827.73
🔔 Disclaimer: This is not financial advice. It's a trade I’m taking based on my own system, shared purely for educational purposes.
📌 If you're also interested in systematic and data-driven trading strategies:
💡 Don’t forget to follow the page and subscribe to stay updated on future analyses.
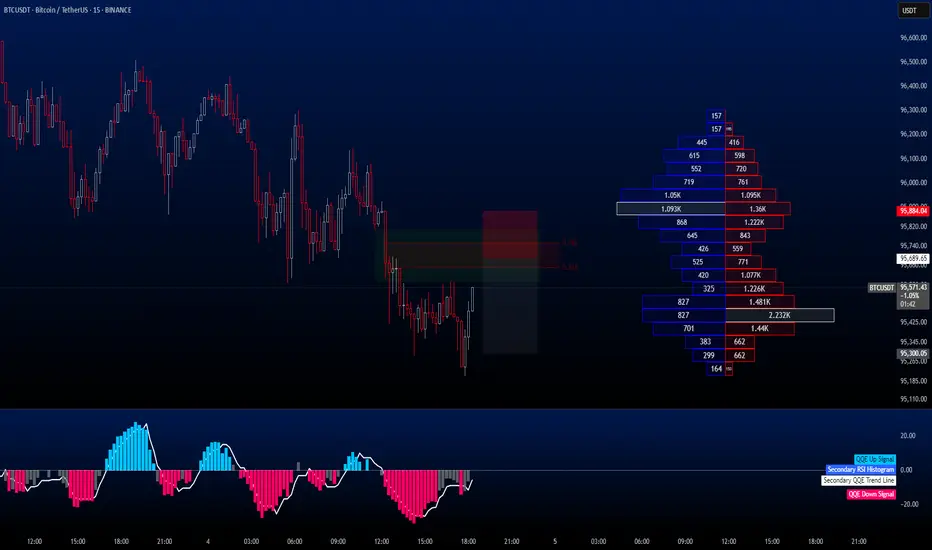
BTCUSDTHello traders! A potential short signal is forming on BTCUSDT. However, it's not ideal to open the sell position right now — we need to wait for the price to reach a specific level. Once it does, we can execute the trade.
So, what are the entry, TP, and SL levels for this setup?
If you’ve just started following me, let’s get started!
🔍 Criteria:
✔️ Timeframe: 15M
✔️ Risk-to-Reward Ratio: 1:1.50 / 2
✔️ Trade Direction: Sell
✔️ Entry Price: 95828.00
✔️ Take Profit: 95507.18
✔️ Stop Loss: 95988.00
🔔 Disclaimer: This is not financial advice. It's a trade I’m taking based on my own system, shared purely for educational purposes.
📌 If you're also interested in systematic and data-driven trading strategies:
💡 Don’t forget to follow the page and subscribe to stay updated on future analyses.
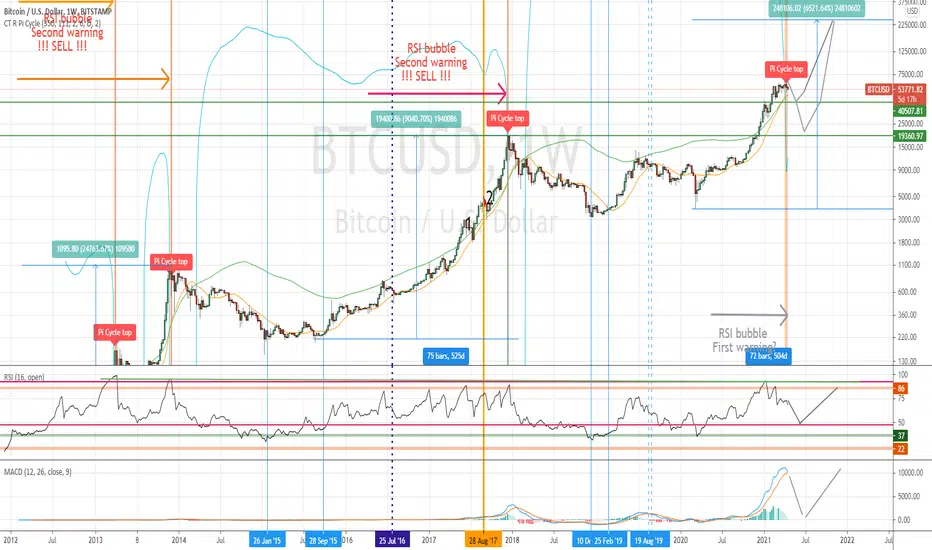
Entry and exit strategy for Bitcoin pt3Hello again, I know that some of you are not in favour of Pi Cycle Top Indicator or even RSI but seems like there is too many signals at once indicating intermediate TOP in the price of Bitcoin!
According to MACD etc. this price pullback may be... brutal and will scare many, many early investors! I see price moving down to 40k or even lower so, either you HODL or sell now and re-buy when the price will be closer to support levels - two scenarios visible on the plot. In the long term perspective, we are in the middle of a bull run (according to many Glassnode indicators) so, don't let this pullback shake you off!
Entry and exit strategy for Bitcoin pt2 - Pi Cycle Top crossed, published early April
Entry and exit strategy for Bitcoin pt1 - first RSI bubble is exactly at the point of dotted line, published in late February
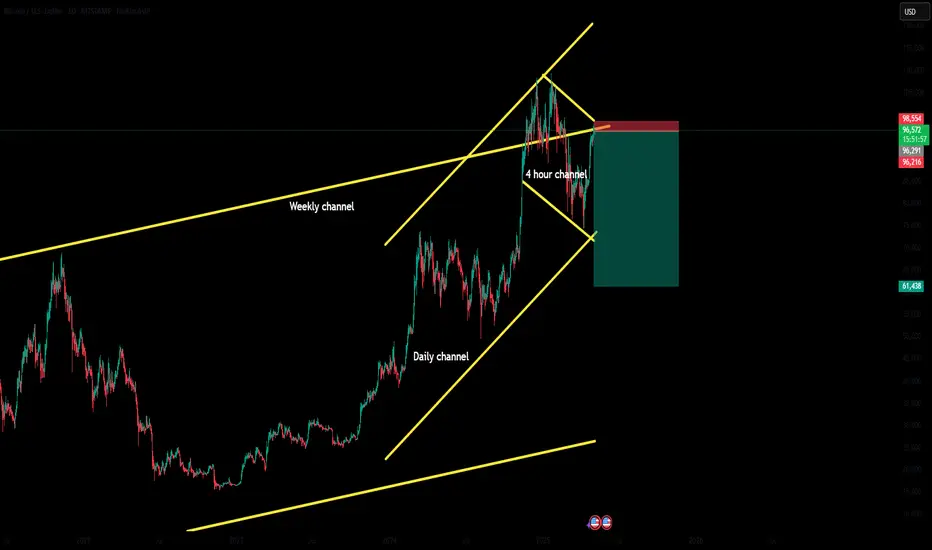
Bitcoin to 61k ?Follow up on my weekly idea.
There is potential sell on the 4 hour chart
Bitcoin is just below a weekly resistance and at the 4 hour resistance
Stop loss: 98500
Take profit: Around 61 k