The decisive day of major data (BTCUSD)Yesterday, it was mentioned that the expectation of continuing to buy after a retracement of 96k was completely correct. Followers also made good profits.
BTCUSD bulls are still strong. The retracement is mainly long trading, which needs to be paid attention to at present. 96k/95k are both good buying opportunities.
TP98K-100K
Btcusdshort
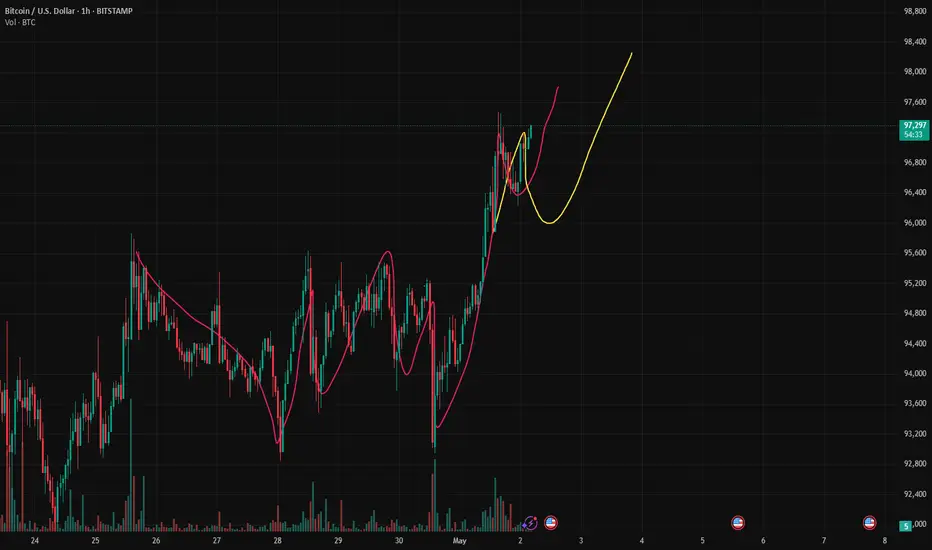
Can BTCUSD continue to be purchased? The answer is definitely.Can BTCUSD continue to be purchased? The answer is definitely.
The current trend is a rebound trend after a volatile decline. The space for a short-term increase of 1,500 points is very simple. The target position is 94,700-95,200. Friends who like to do short-term swing trading can follow.

Buy@9500096000: This represents the resistance level adjacent to the upper trend-line of the current ascending wedge. The price has repeatedly probed this zone but hasn't managed to achieve a decisive breakthrough, underscoring significant selling pressure at this crucial juncture 💥.
97500: It stands as a more elevated resistance milestone. Should the price powerfully breach the 96000 resistance barrier and sustain its upward momentum, it could potentially challenge this level 🎯.
⚡⚡⚡ BTCUSD ⚡⚡⚡
🚀 Buy@95000
🚀 TP 96000 - 97000
Accurate signals are updated every day 📈 If you encounter any problems during trading, these signals can serve as your reliable guide 🧭 Feel free to refer to them! I sincerely hope they'll be of great help to you 🌟

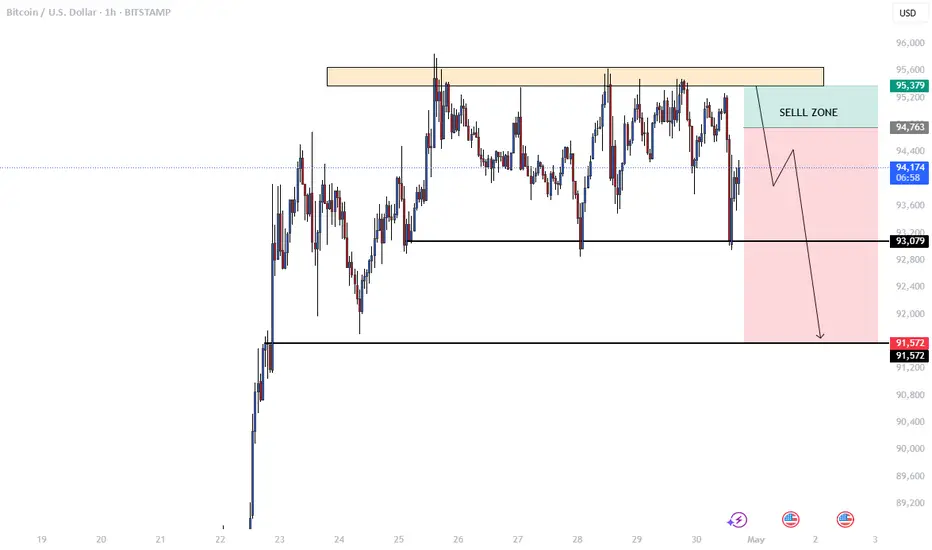
BTC/USD 1-hour timeframe chart, showing a bearish setup.
This is a BTC/USD 1-hour timeframe chart, showing a bearish setup. Here are the key elements:
Sell Zone (Resistance Area):
The zone around 95,379 to 95,622 is marked as a "SELL ZONE" (highlighted in green and yellow).
This area has acted as strong resistance multiple times in the past.
Current Price:
BTC is currently trading around 94,145.
Support Levels:
First support is marked at 93,079.
The next major support level (and likely target for the bearish move) is 91,572.
Price Projection:
The expectation is that price will move up slightly into the sell zone, then get rejected.
After rejection, the price is projected to break below support and fall toward 91,572 (as indicated by the red arrow).
Market Bias:
The setup shows a bearish bias, suggesting a short (sell) trade from the resistance zone.
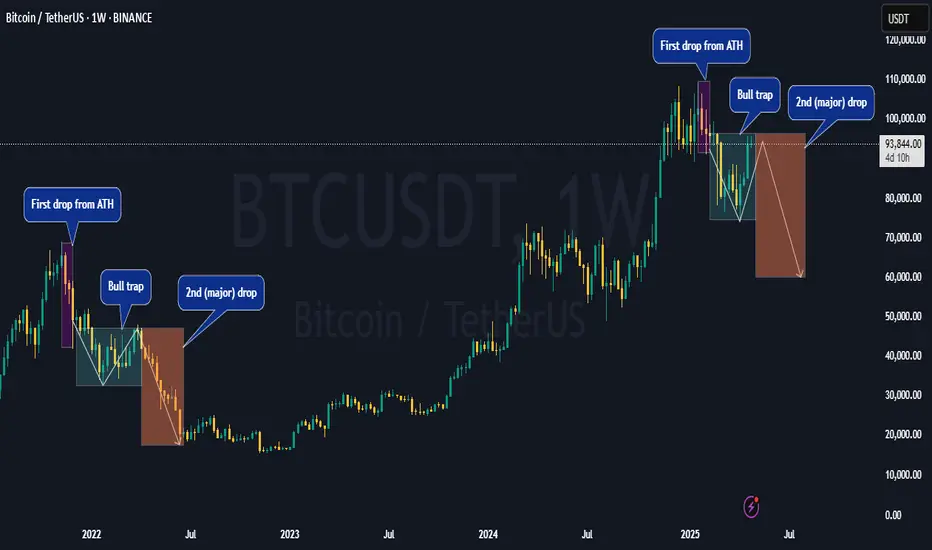
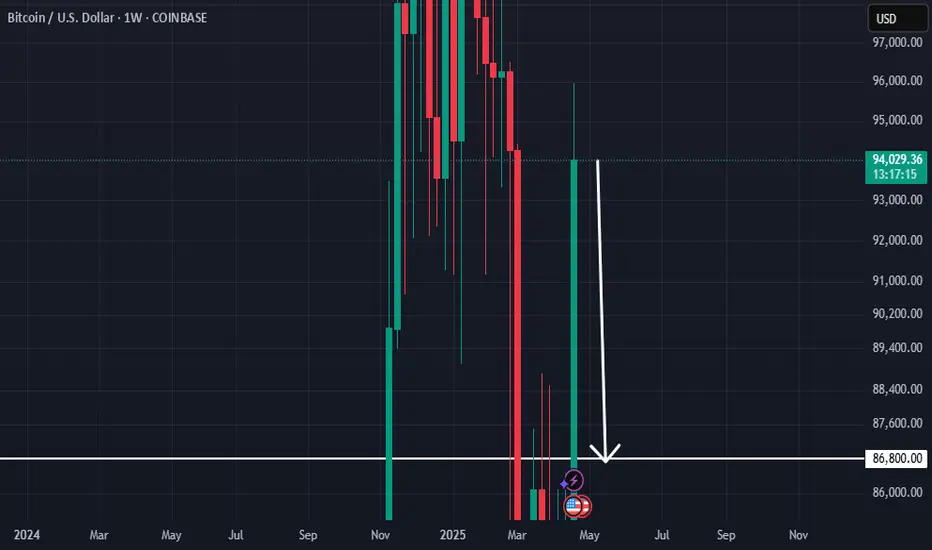
Bitcoin Repeating 2022 Structure? Same Setup, Same Outcome?Bitcoin’s current market structure is starting to mirror its 2022 setup—right before the big drop.
This chart shows a familiar pattern: a rally, a peak, first drop from the ATH, a bull trap… then the major second leg down.
If history repeats, CRYPTOCAP:BTC could be on the verge of another significant move.
Will it break the cycle this time—or follow the same path again?
📉 What do you think?
Share your take in the comments below.
Please support this idea with a LIKE👍 if you find it useful🥳
Happy Trading💰🥳🤗
BTCUSD:Adopt range trading before the breakout.Given that a number of important data are about to be released intensively, the market volatility is rising sharply. Before a clear breakout signal in the price is formed, it is recommended that within the range of $93,000 - $96,000, the range trading strategy be flexibly applied: sell at highs, and then buy at lows to build positions when the price drops back to the support level, so as to seize the band trading opportunities in the volatile market. At the same time, strictly control the position size to prevent the risk of sudden and significant fluctuations triggered by the data release.
BTCUSD
buy@93000-93500
tp:95000-95500
sell@96000-95500
tp:94000-93500
In the future, we will continue to monitor the market changes and update the trading strategies in real time.
I am committed to sharing trading signals every day. Among them, real-time signals will be flexibly pushed according to market dynamics. All the signals sent out last week accurately matched the market trends, helping numerous traders achieve substantial profits. Regardless of your previous investment performance, I believe that with the support of my professional strategies and timely signals, I will surely be able to assist you in breaking through investment bottlenecks and achieving new breakthroughs in the trading field.

BTCUSD:Adopt range trading before the breakout.Given that a number of important data are about to be released intensively, the market volatility is rising sharply. Before a clear breakout signal in the price is formed, it is recommended that within the range of $93,000 - $96,000, the range trading strategy be flexibly applied: sell at highs, and then buy at lows to build positions when the price drops back to the support level, so as to seize the band trading opportunities in the volatile market. At the same time, strictly control the position size to prevent the risk of sudden and significant fluctuations triggered by the data release.
In the future, we will continue to monitor the market changes and update the trading strategies in real time.
I am committed to sharing trading signals every day. Among them, real-time signals will be flexibly pushed according to market dynamics. All the signals sent out last week accurately matched the market trends, helping numerous traders achieve substantial profits. Regardless of your previous investment performance, I believe that with the support of my professional strategies and timely signals, I will surely be able to assist you in breaking through investment bottlenecks and achieving new breakthroughs in the trading field.

BTCUSD:Wait for a breakthroughToday, the price of BTC strongly broke through the threshold of $93,000. Subsequently, it started a rebound trend. After consolidating near $95,500, it failed to further break through the resistance level of $96,000 and dropped back to around $94,000. It may fall again and break below the support level of $93,000.
The breakthrough of these two key price levels will serve as an important dividing line for the subsequent trend of BTC, indicating the direction of its future price movement.
Special Reminder: A number of important economic data will be intensively released this week, and market volatility is likely to increase significantly. It is recommended that everyone trade with caution and strictly control risks.
I am committed to sharing trading signals every day. Among them, real-time signals will be flexibly pushed according to market dynamics. All the signals sent out last week accurately matched the market trends, helping numerous traders achieve substantial profits. Regardless of your previous investment performance, I believe that with the support of my professional strategies and timely signals, I will surely be able to assist you in breaking through investment bottlenecks and achieving new breakthroughs in the trading field.
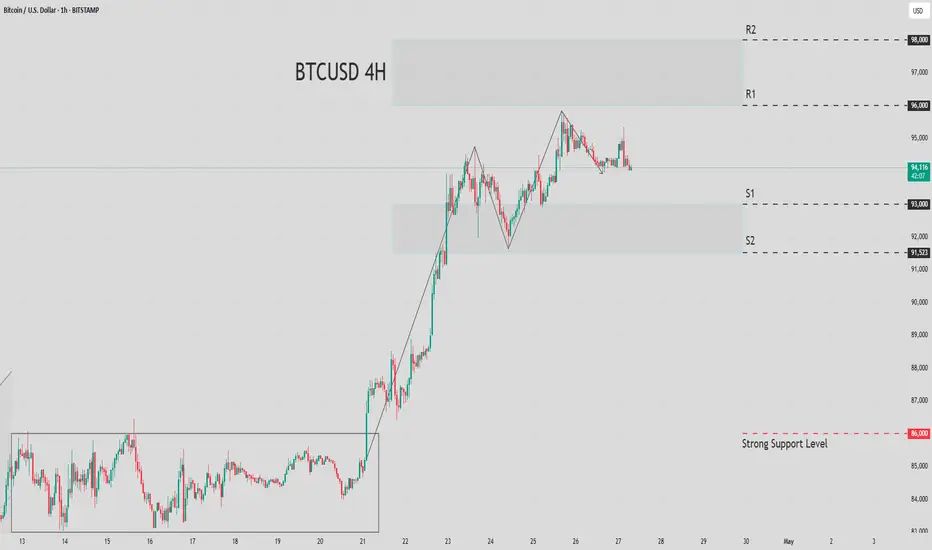
BTCUSD:Ascending Wedge Trend and StrategiesI. Trends and Patterns
From the 4 - hour chart, BTCUSD has shown complex volatility characteristics recently:
1.Consolidation phase: The price oscillated within a narrow range in the early stage, forming a rectangular consolidation pattern. The forces of bulls and bears were relatively balanced, and there was a strong wait - and - see sentiment in the market.
2.Breakout and current pattern: After breaking through the consolidation range, the price moved upward, indicating that the bulls were dominant in the short term. However, it has now entered an ascending wedge pattern - which is a common reversal signal in technical analysis.
- Pattern characteristics: Although the price has been making short - term new highs, the upward slope has gradually flattened, suggesting that the bullish momentum is fading and the bearish momentum is gradually accumulating. Be vigilant against the risk of trend reversal.
II. Key Support and Resistance Levels
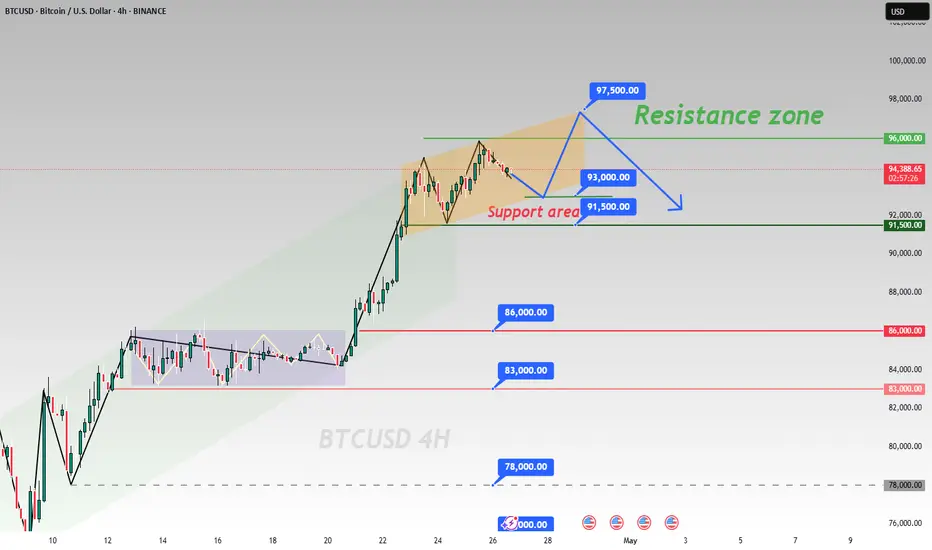
S1: $93,000. It is near the lower trend line of the ascending wedge and also a previous pullback low. If the price drops, this could form a strong support. If it is broken, it may open up a downward space, and we need to be vigilant against trend reversal.
S2: $91,500. It is the upper edge of the previous consolidation range. If the price drops significantly, this may form a secondary support to slow down the decline.
R1: $96,000. It is near the upper trend line of the ascending wedge. The price has tested it several times without a valid breakthrough, indicating strong selling pressure here and a significant short - term suppression effect.
R2: $98,000. It is a higher - level resistance target. If the price breaks through $96,000 strongly and holds above it, it may further rise to this level.
III. Trading Strategy Recommendations
1.Bullish strategy:
- Entry conditions: The price finds support near $93,000 (such as the appearance of bullish candlestick patterns like hammer candlesticks), and does not break below this level.
- Target price: $96,000 (testing the upper wedge), and if broken, look towards $97,500.
- Stop - loss setting: Break below $92,500 (below the lower edge of the support level).
2.Bearish strategy:
- Entry conditions: The price effectively breaks below the support level of $93,000 (such as closing below it for two consecutive candlesticks), or encounters resistance and falls back near $96,000 (the appearance of bearish patterns like shooting star candlesticks).
- Target price: $91,500 (the upper edge of the previous consolidation), and if it further drops, it can look towards $86,000.
- Stop - loss setting: Break above $96,500 (above the upper wedge).
3.Risk warnings:
- The reversal signal of the ascending wedge needs to be verified with trading volume (for example, if there is a significant increase in volume during the breakout, the signal is more reliable).
- Pay close attention to fundamental factors such as the expected Fed policy and regulatory dynamics of cryptocurrencies. Be vigilant against breakout movements triggered by unexpected news.
IV. Conclusion
Currently, BTCUSD is in a critical observation period of the ascending wedge. Technical analysis shows that the bullish momentum is waning, and it faces a directional choice in the short term. Aggressive traders can lightly test the waters near support/resistance levels, while conservative traders are advised to wait for clear breakout signals (such as a volume - based breakout of the upper wedge or an effective breakdown of the lower wedge) before entering the market. At the same time, strictly control positions and stop - losses to avoid volatility risks before the pattern is confirmed.
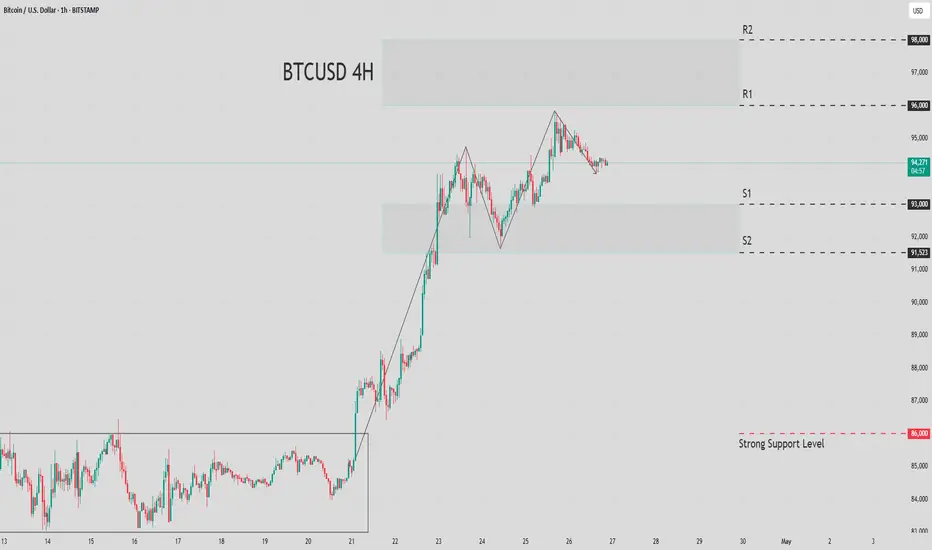
BTCUSD:Ascending Wedge Trend and StrategiesI. Trends and Patterns
From the 4 - hour chart, BTCUSD has shown complex volatility characteristics recently:
1.Consolidation phase: The price oscillated within a narrow range in the early stage, forming a rectangular consolidation pattern. The forces of bulls and bears were relatively balanced, and there was a strong wait - and - see sentiment in the market.
2.Breakout and current pattern: After breaking through the consolidation range, the price moved upward, indicating that the bulls were dominant in the short term. However, it has now entered an ascending wedge pattern - which is a common reversal signal in technical analysis.
- Pattern characteristics: Although the price has been making short - term new highs, the upward slope has gradually flattened, suggesting that the bullish momentum is fading and the bearish momentum is gradually accumulating. Be vigilant against the risk of trend reversal.
II. Key Support and Resistance Levels
S1 : $93,000. It is near the lower trend line of the ascending wedge and also a previous pullback low. If the price drops, this could form a strong support. If it is broken, it may open up a downward space, and we need to be vigilant against trend reversal.
S2 : $91,500. It is the upper edge of the previous consolidation range. If the price drops significantly, this may form a secondary support to slow down the decline.
R1 : $96,000. It is near the upper trend line of the ascending wedge. The price has tested it several times without a valid breakthrough, indicating strong selling pressure here and a significant short - term suppression effect.
R2 : $98,000. It is a higher - level resistance target. If the price breaks through $96,000 strongly and holds above it, it may further rise to this level.
III. Trading Strategy Recommendations
1.Bullish strategy:
- Entry conditions: The price finds support near $93,000 (such as the appearance of bullish candlestick patterns like hammer candlesticks), and does not break below this level.
- Target price: $96,000 (testing the upper wedge), and if broken, look towards $97,500.
- Stop - loss setting: Break below $92,500 (below the lower edge of the support level).
2.Bearish strategy:
- Entry conditions: The price effectively breaks below the support level of $93,000 (such as closing below it for two consecutive candlesticks), or encounters resistance and falls back near $96,000 (the appearance of bearish patterns like shooting star candlesticks).
- Target price: $91,500 (the upper edge of the previous consolidation), and if it further drops, it can look towards $86,000.
- Stop - loss setting: Break above $96,500 (above the upper wedge).
3.Risk warnings:
- The reversal signal of the ascending wedge needs to be verified with trading volume (for example, if there is a significant increase in volume during the breakout, the signal is more reliable).
- Pay close attention to fundamental factors such as the expected Fed policy and regulatory dynamics of cryptocurrencies. Be vigilant against breakout movements triggered by unexpected news.
IV. Conclusion
Currently, BTCUSD is in a critical observation period of the ascending wedge. Technical analysis shows that the bullish momentum is waning, and it faces a directional choice in the short term. Aggressive traders can lightly test the waters near support/resistance levels, while conservative traders are advised to wait for clear breakout signals (such as a volume - based breakout of the upper wedge or an effective breakdown of the lower wedge) before entering the market. At the same time, strictly control positions and stop - losses to avoid volatility risks before the pattern is confirmed.
Buy@92000 - 93000 TP 95000 - 96000 - 9700096000: This is the resistance level near the upper trend - line of the current ascending wedge. The price has tested this area several times but failed to break through effectively, indicating strong selling pressure at this level 💥.
97500: It is a higher - level resistance target. If the price can strongly break through the 96000 resistance level and continue to rise, it may test this level 🎯.
⚡⚡⚡ BTCUSD ⚡⚡⚡
🚀 Buy@92000 - 93000
🚀 TP 95000 - 96000 - 97000
Accurate signals are updated every day 📈 If you encounter any problems during trading, these signals can serve as your reliable guide 🧭 Feel free to refer to them! I sincerely hope they'll be of great help to you 🌟
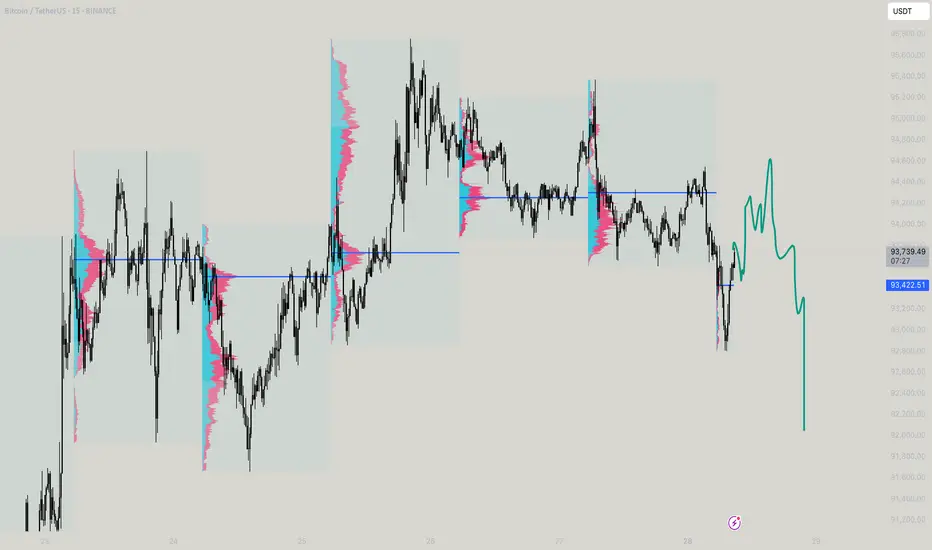
BTC will ever go 100k?
The immediate structure shows aggressive selling pressure — big thin volume zones (where there is less historical volume) are visible between $93,200 and $92,700. If BTC cannot reclaim and close strongly back above $93,900–$94,100 (preferably closing inside the old VA), the path of least resistance remains downward toward $92,500 first and even $91,700–$91,500 eventually.
In simple words: as long as BTC stays under $93,900, the market is favoring shorts, not longs. Quick bounces can happen, but they are more likely to get sold off unless a very strong reclaim happens. Bulls need to urgently push back above $94,100 to reattempt upside momentum, otherwise downside expansions toward lower value zones remain active.
TL:DR - Observe!
BTCUSD BEARISHMy calculations find that this asset, will indeed drop to the indicated price in coming days or weeks. This move will be overwhelmingly bearish.
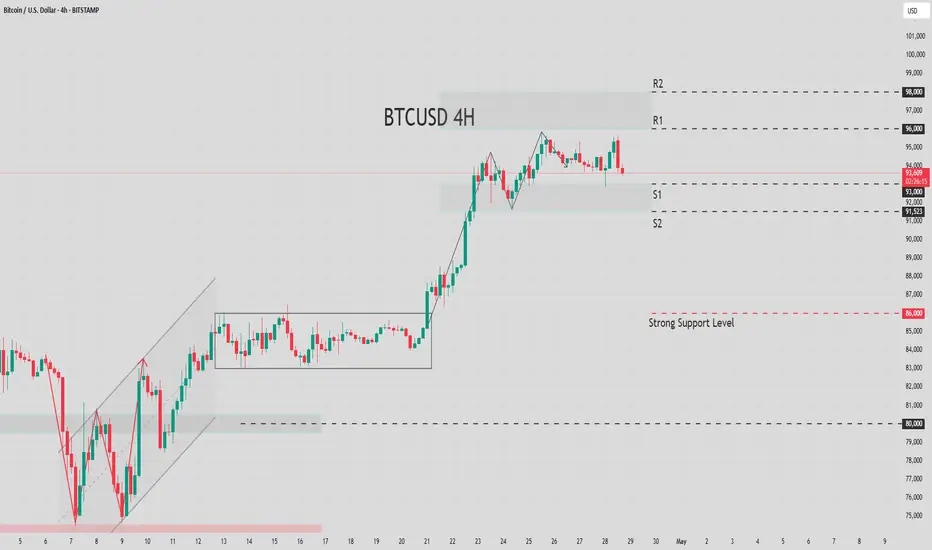
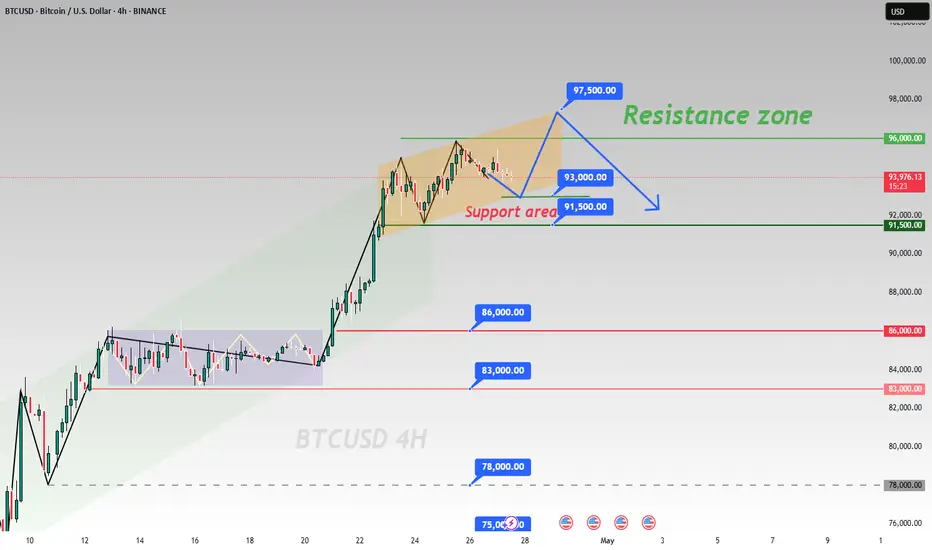
BTCUSD 4 - Hour Chart Market AnalysisBTCUSD 4 - Hour Chart Market Analysis
I. Trends and Patterns 📈
Looking at the 4 - hour chart, the recent performance of BTCUSD has been characterized by complex fluctuations. In the earlier stage, there was a consolidation phase where the price oscillated within a relatively narrow range, forming a roughly rectangular consolidation pattern 📊. During this period, the forces of bulls and bears were relatively balanced 🤝, and the market was in a wait - and - see mode 🕵️. Subsequently, the price broke above this consolidation range and moved upward, indicating that the bulls had taken the upper hand 🐂, driving the price to gradually climb ⬆️.
Currently, the price is in an ascending wedge pattern, a common technical pattern. An ascending wedge is generally regarded as a reversal pattern. In an uptrend, although the price continues to reach new highs, the upward slope gradually flattens, suggesting that the bullish momentum is weakening while the bearish momentum is accumulating 🐻.
II. Key Support and Resistance Levels 📌
Support Levels
93000: This is a crucial support level, located near the lower trend - line of the ascending wedge and also a key low point during previous pullbacks. If the price moves downward, this level is likely to provide strong support. A break below this level may trigger further declines ⚠️.
91500: It is the upper edge of the previous consolidation range. If the price experiences a significant drop, this level may prevent the price from falling further sharply 🛑.
86000: It is the lower edge of the previous consolidation range. If the price continues to decline, this will be an important support line. A break below it may open up a larger downside space 📉.
Resistance Levels
96000: This is the resistance level near the upper trend - line of the current ascending wedge. The price has tested this area several times but failed to break through effectively, indicating strong selling pressure at this level 💥.
97500: It is a higher - level resistance target. If the price can strongly break through the 96000 resistance level and continue to rise, it may test this level 🎯.
⚡⚡⚡ BTCUSD ⚡⚡⚡
🚀 Sell@95000 - 94500
🚀 TP 93000 - 92000
🚀 Buy@92000 - 93000
🚀 TP 95000 - 96000
Accurate signals are updated every day 📈 If you encounter any problems during trading, these signals can serve as your reliable guide 🧭 Feel free to refer to them! I sincerely hope they'll be of great help to you 🌟
Short-term shorting opportunities emergeBTC encountered significant resistance near $94,500 during this week's rally, and short-selling operations can be attempted when approaching this price level.
BTCUSD
sell@94000-94500
tp:93000-92500
I hope this strategy will be helpful to you.
When you find yourself in a difficult situation and at a loss in trading, don't face it alone. Please get in touch with me. I'm always ready to fight side by side with you, avoid risks, and embark on a new journey towards stable profits.

BTCUSD 4 - hour Chart AnalysisBTCUSD 4 - hour Chart Analysis
I. Trend Judgment
From the 4 - hour chart, BTCUSD is on an upward trend, consolidating at relatively high levels. Despite price fluctuations, bulls are still in control to some extent 🐂.
II. Key Levels
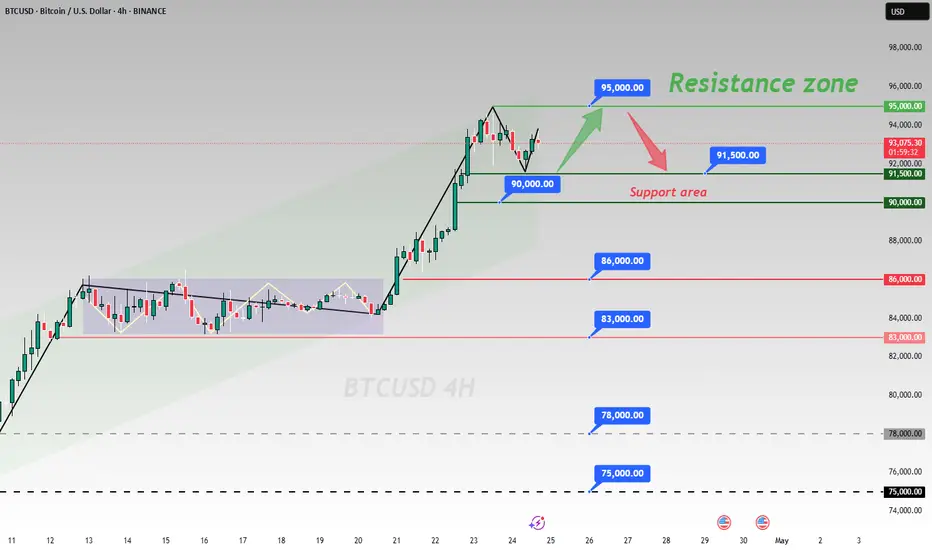
Support Area: The 90,000 - 91,500 range is a key support zone. The price has rebounded here multiple times, suggesting strong buying interest. If it drops back, it could be a buying opportunity 📈. 86,000 and 83,000 are additional lower - level supports.
Resistance Area: 95,000 is the resistance area. The price has faced hurdles here. If bullish momentum strengthens, breaking this could open up more upside 🚀.
III. Trading Strategies
Long - position Strategy: When the price retreats to the 90,000 - 91,500 support area and a bullish candlestick shows up, consider going long. Place stop - loss below the support and aim for 95,000. If broken, higher levels may follow 💰.
Short - position Strategy: Near 95,000, if a bearish candlestick appears with rising volume, try a small short position. Set stop - loss above resistance and target 91,500 - 90,000 ⬇️.
⚡⚡⚡ BTCUSD ⚡⚡⚡
🚀 Sell@95000 - 94000
🚀 TP 92000 - 91000
🚀 Buy@91000 - 92000
🚀 TP 94000 - 95000
Accurate signals are updated every day 📈 If you encounter any problems during trading, these signals can serve as your reliable guide 🧭 Feel free to refer to them! I sincerely hope they'll be of great help to you 🌟
BTC may drop back to 90,000 pointsBTC is likely to pull back to around 90,000 points before starting to rebound.
In terms of capital flow, the upward momentum of XAU/USD has been temporarily halted ⏸️, and a large amount of capital is rapidly flowing into the virtual currency market 💸! As the leader of virtual currencies, Bitcoin has undoubtedly become an important destination for capital inflows 🌟. The injection of a large amount of capital has directly driven a significant surge in the price of BTC 📈. Capital chases profits just like water flows 🌊. Against the backdrop of the phased adjustment in the gold market, Bitcoin, with its unique technological attributes and market vitality, has attracted the attention of many investors, laying a solid capital foundation for its subsequent price increase 🏗️.
At the macro policy level, Trump's remarks have had a strong impact on the financial market 😲! His change in attitude towards Fed Chairman Powell has triggered the reallocation of market funds 🔄. When he previously threatened to remove Powell, investors' concerns about the Fed's policy intensified, and they flocked to the gold market for hedging, pushing up the gold price 🚀. However, Trump's latest statement that he will not fire Powell and his call for interest rate cuts have alleviated some of the investors' anxiety, prompting funds to flow back into US dollar - denominated assets 📉. It should be noted that during this process, some of the funds withdrawn from the gold market have not fully returned to traditional US dollar assets but have flowed into the virtual currency field such as Bitcoin 💥. As an emerging digital asset, Bitcoin has both certain hedging and speculative attributes, and has become a new safe haven and value - added target for funds 💰.
In international trade, Trump has shown signs of easing in the trade negotiations with China and is trying to reach an agreement quickly to reduce tariffs (although not to zero) 🤝. The past uncertainty in trade relations was one of the important factors driving up the gold price ⚠️. With the expected easing of trade tensions, potential future trade easing measures may suppress the market demand for gold as a safe haven asset ⏳. In contrast, the Bitcoin market is less directly affected by trade policies. Instead, due to its characteristics such as decentralization and global circulation 🌐, it has gained more favor during the process of capital reallocation. When the attractiveness of traditional safe haven assets declines, the scarcity and innovation of Bitcoin make it a new choice for investors to diversify risks and pursue returns 🎯, further stimulating the market demand for BTC 📈.
⚡⚡⚡ BTCUSD ⚡⚡⚡
🚀 Sell@92000 - 92500
🚀 TP 91000 - 90000
The market has been extremely volatile lately 📈📉 If you can't figure out the market's direction, you'll only be a cash dispenser for others 💰

Safe-haven funds continue to drive BTC higher.Yesterday, Bitcoin approached $94,000 with bulls maintaining strength, and $95,000 may become the next target. As a high-quality safe-haven asset, Bitcoin is currently still supported by uncertainties surrounding U.S. trade policies and the Federal Reserve's interest rate path. In trading operations, the strategy of going long on pullbacks should still be adhered to, with attention paid to the support level at $90,000 below.
BTCUSD
buy@93K-94K
tp:95K-96k
I hope this strategy will be helpful to you.
When you find yourself in a difficult situation and at a loss in trading, don't face it alone. Please get in touch with me. I'm always ready to fight side by side with you, avoid risks, and embark on a new journey towards stable profits.
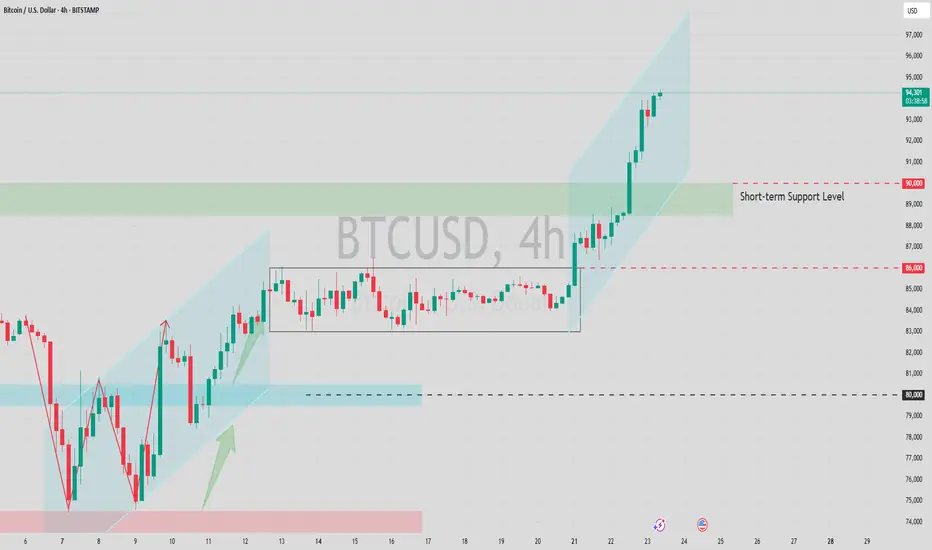
Risk-averse funds drive BTC higher.The sharp collapse of the DXY has triggered violent fluctuations in the global monetary system. As risk aversion heats up, investors are adjusting their asset allocations, with substantial capital flowing into "digital gold," which has enabled BTC to break last week's sideways consolidation and initiate an upward trend.
BTCUSD
buy@86500-87500
tp:88500-89500
I hope this strategy will be helpful to you.
When you find yourself in a difficult situation and at a loss in trading, don't face it alone. Please get in touch with me. I'm always ready to fight side by side with you, avoid risks, and embark on a new journey towards stable profits.
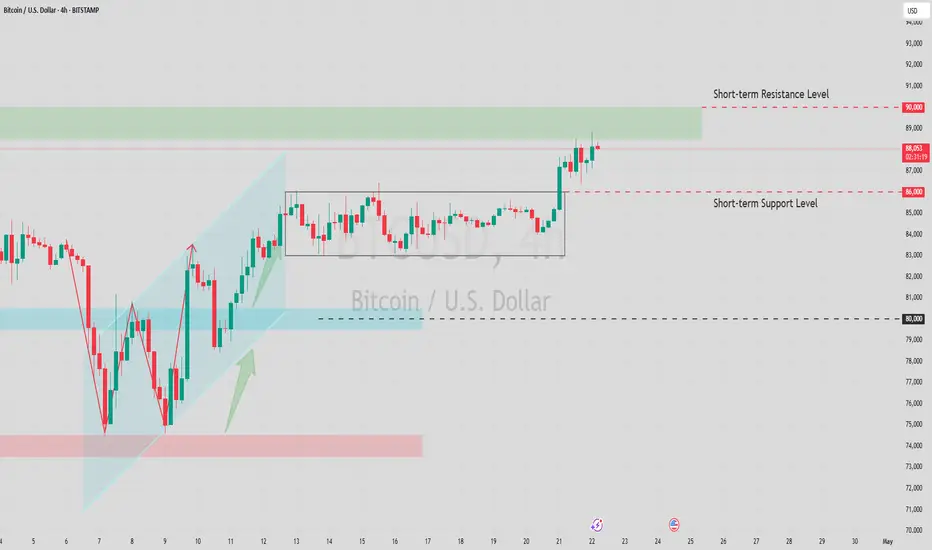
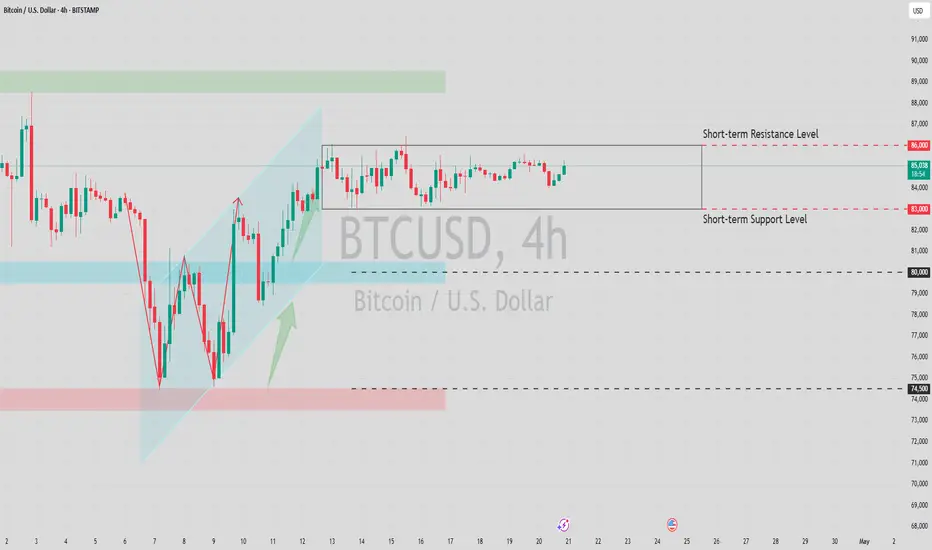
Consolidation Divergence - Range Trading StrategyLast week, BTC continued to oscillate in the 83K-86K range. Technically, the daily MACD showed increasing volume but a deviation from the price. At the same time, the Bollinger Bands narrowed sideways, and the market entered a typical "pre-breakout momentum" stage.
Before an effective breakthrough, you can rely on the range to sell high and buy low, strictly set stops, and pay close attention to changes in volume and energy and confirmation of the breakthrough direction.
BTCUSD
sell@86500-85500
tp:84500-83500
buy@83000-84000
tp:85000-86000
I hope this strategy will be helpful to you.
When you find yourself in a difficult situation and at a loss in trading, don't face it alone. Please get in touch with me. I'm always ready to fight side by side with you, avoid risks, and embark on a new journey towards stable profits.
BTC | FAKE REVERSAL - Here's WhyI'm not convinced of the recent "bullish" price action. In fact, I say it's likely the calm before the next bearish move down.
In a downtrend, there are a few tale tell signs that the price has gone into full bear mode . In this video, I discuss two of them.
Make sure you catch up on ALTCOINS, and their ideal buying zones HERE 👀👇
__________________
BINANCE:BTCUSDT

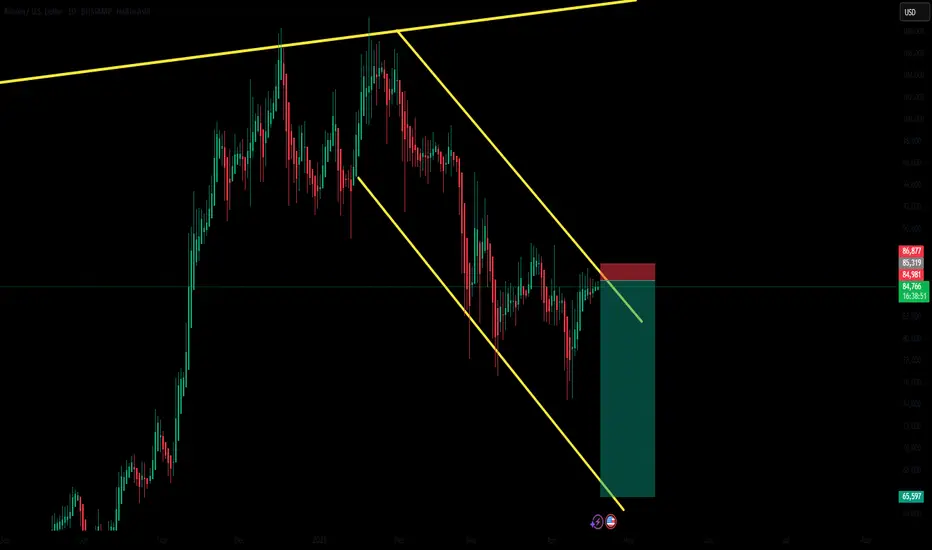
Bitcoin sell to 65K?Follow up on my weekly idea.
There is potential sell in the incoming days on the daily chart
Stop loss: 86900
Take profit: Around 65k
BTC/USD Short Setup – Triple Top Reversal with EMA Confirmation Entry Point (Sell): Around $85,699.52
Stop Loss: $86,741.44 (above resistance zone)
Target (Take Profit): $82,982.09
This provides a Risk-Reward Ratio of approximately 1:2, a commonly acceptable ratio in trading.
📈 Indicators:
EMA 30 (Red) is currently above the EMA 200 (Blue), indicating bullish momentum—but this setup anticipates a trend reversal.
If price breaks below the EMAs, that would confirm bearish strength.
🧠 Conclusion:
This setup is based on:
A strong resistance zone,
Bearish reversal pattern (triple top),
Risk management via stop loss and take profit levels.
If you're trading this:
Wait for confirmation with a bearish candlestick below the EMAs or a break of recent support.
Manage position size based on stop distance and your account risk tolerance.
